

Courtesy of Sabrient Systems and Gradient Analytics
 Was that really a breakout? With the S&P 500 struggling around the 2,000 level for the past two weeks, Friday’s strong finish might seem like a bullish breakout. But the market has already given us a couple of false breakouts at this level, and although I see higher prices ahead, I’m still not convinced that we have seen all the near-term downside that Mr. Market has in store, particularly given we are now in the historically weak month of September. Also, the improving economy is a double-edged sword from an equity investor’s perspective as they are concerned that the Fed might feel the need to raise rates sooner than currently planned.
In this weekly update, I give my view of the current market environment, offer a technical analysis of the S&P 500 chart, review our weekly fundamentals-based SectorCast rankings of the ten U.S. business sectors, and then offer up some actionable trading ideas, including a sector rotation strategy using ETFs and an enhanced version using top-ranked stocks from the top-ranked sectors.
Market overview:
Yes, we are entering the historically weakest month of September, at least according to Stock Trader’s Almanac. However, the reality is that the average monthly loss is only -0.5%, and nearly half of the time the market finishes positive. Moreover, recent performances have bucked the averages, with solid gains in September the past two years and a robust +8.8% in 2010.
There is no doubt that the U.S. economy is strengthening while central banks flood world markets with liquidity, and global investors look to U.S. stocks and Treasuries for the unusual combination of more safety and higher returns. Hiring has surged starting with lower wage jobs but also with the expectation that higher wage jobs will soon follow. Corporate profits are at record highs and stock buybacks are raging. Also, oil prices have fallen as domestic production continues to rise. The European Central Bank has joined the other major central banks in lowering interest rates and launching its own version of quantitative easing, and much of that new liquidity should find its way into the relative safety of U.S. stocks and Treasuries.
And don’t forget, hedge funds are finding themselves way underweight in equities. After the ECB announced its stimulus program, David Tepper of hedge fund Appaloosa Management predicted that this signals the official end of the bond market rally, driving even more capital into equities. Although elevated, valuation multiples are not out of line given low interest rates and strong earnings growth expectations.
However, that doesn’t mean that the stock market is destined to go straight up. There hasn’t been a real 10% correction in nearly three years, which is twice as long as the typical interval between corrections. We are way overdue. Notably, leading sectors last week were defensive-oriented Utilities and Telecom, which is not particularly encouraging to the bulls. And of course, ECB liquidity programs have little chance of making much difference in an EU in desperate need of major structural reform (although U.S. equities will welcome the capital inflows).
The yield on the 10-year U.S. Treasury fell to less than 2.4% during the summer and closed Friday at 2.46%, so a significant weakening in Treasuries hasn’t happened yet. In fact, Jeff Gundlach of DoubleLine Funds (who predicted this year’s rally in bonds), has predicted the 10-year yield to remain between 2.2-2.8% for the foreseeable future, with the main risk being to the downside. So, there is still no consensus on the near-term direction of Treasury bonds.
The CBOE Market Volatility Index (VIX), a.k.a. fear gauge, closed Friday at 12.09 after taking a few stabs above 13 during the week and challenging its 50-day simple moving average. It has been gradually creeping higher over the past couple of weeks. Investors seem to be quite cognizant of historical market behavior during the month of September.
So, is VIX being kept artificially low to prevent it from reverting to its low-term mean of 20? According to a recent blog post by Brian Stutland of Equity Armor Investments (a Sabrient strategic partner), monetary policy coupled with a strengthening U.S. dollar has pushed money flow into both U.S. bonds and stocks, and this enhanced liquidity has tamed realized volatility and equity movements. Nevertheless, he believes that the VIX has nowhere to go from here but up, although it could be a matter of days or months before it happens — VIX is not a timing signal.
Although we remain well overdue for a -10% cleansing correction, we also know that Q4 is traditionally strong for equities, particularly given the strengthening economy and global liquidity. So, whether or not we finally get a correction in the near term, buy-the-dips remains the mantra until proven otherwise.
By the way, Sabrient’s annual Baker’s Dozen portfolio of 13 top picks for the year is really starting to kick into gear. Because this portfolio represents a sector-diversified group of our favorite Growth At a Reasonable Price (GARP) stocks without regard to timing signals, they usually take a few months to get going, and this year has been no different. Nevertheless, as of last Friday, the portfolio was up nearly +17% since its January 13 launch versus the SPY performance of +11.7% over the same timeframe. Top performers include NXP Semiconductors (NXPI) and Southwest Airlines (LUV), and Jazz Pharmaceuticals (JAZZ) had a big +7% day on Friday. Portfolio performance is quite strong versus many other firms that publish annual Top Picks lists, as shown in this third-party tracking site.
Also, there was an interesting article on ETF.com last week comparing the performance of Guggenheim Defensive Equity ETF (DEF), which tracks our Defensive Equity Index, against PowerShares S&P 500 Low Volatility ETF (SPLV) as low-volatility defensive-oriented investments. DEF has been quite impressive.
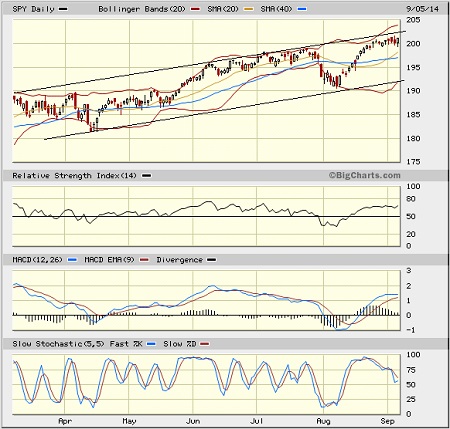
SPY chart review:
The SPDR S&P 500 Trust (SPY) closed last Friday at 201.11 (while the underlying S&P 500 closed at 2,007.71), and seems to be showing the launch of a bullish breakout. Or is it? Yes, it is above 200, but it has spent some time intraday below the 200 level virtually every day since it initially breached this psychological level. So, this is still within a consolidation range. The challenge remains recruiting enough new bullish conviction (and fresh capital) to break out in earnest, and that has not happened yet. I am certainly not convinced that a breakout has started, particularly as we just get started with the historically weak month of September. Moreover, the top line of the bullish rising channel is once again providing strong resistance. Like the price action, oscillators RSI, MACD, and Slow Stochastic are all looking neutral and could go either way from here.
Latest sector rankings:
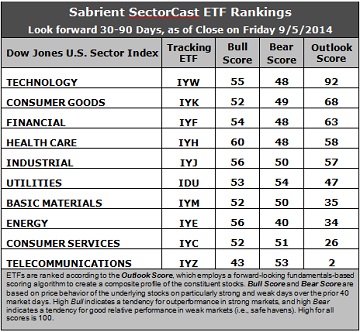
Relative sector rankings are based on our proprietary SectorCast model, which builds a composite profile of each equity ETF based on bottom-up aggregate scoring of the constituent stocks. The Outlook Score employs a forward-looking, fundamentals-based multifactor algorithm considering forward valuation, historical and projected earnings growth, the dynamics of Wall Street analysts’ consensus earnings estimates and recent revisions (up or down), quality and sustainability of reported earnings (forensic accounting), and various return ratios. It helps us predict relative performance over the next 1-3 months.
In addition, SectorCast computes a Bull Score and Bear Score for each ETF based on recent price behavior of the constituent stocks on particularly strong and weak market days. High Bull score indicates that stocks within the ETF recently have tended toward relative outperformance when the market is strong, while a high Bear score indicates that stocks within the ETF have tended to hold up relatively well (i.e., safe havens) when the market is weak.
Outlook score is forward-looking while Bull and Bear are backward-looking. As a group, these three scores can be helpful for positioning a portfolio for a given set of anticipated market conditions. Of course, each ETF holds a unique portfolio of stocks and position weights, so the sectors represented will score differently depending upon which set of ETFs is used. We use the iShares that represent the ten major U.S. business sectors: Financial (IYF), Technology (IYW), Industrial (IYJ), Healthcare (IYH), Consumer Goods (IYK), Consumer Services (IYC), Energy (IYE), Basic Materials (IYM), Telecommunications (IYZ), and Utilities (IDU). Whereas the Select Sector SPDRs only contain stocks from the S&P 500, I prefer the iShares for their larger universe and broader diversity. Fidelity also offers a group of sector ETFs with an even larger number of constituents in each.
Here are some of my observations on this week’s scores:
1. Technology still holds the top spot with an Outlook score of 92. The sector displays relatively solid scores across most factors in the model, including the best Wall Street analyst sentiment (net upward revisions to earnings estimates), a good forward long-term growth rate, and strong return ratios. The forward P/E is below average (Financial and Energy sport the lowest), but insider sentiment (open market buying) is now among the highest. Consumer Goods has taken the second spot this week with a score of 68 as the sector displays strong sell-side analyst sentiment (upward revisions) and insider sentiment, as well as strong return ratios. Financial has risen to the third spot, followed by Healthcare and Industrial rounding out the top five.
2. Telecom stays in the cellar this week with an Outlook score of 2, as the sector has low scores on most factors in the model. Consumer Services/Discretionary stays in the bottom two with a score of 20, despite a strong forward long-term growth rate. Telecom and Energy have been hit recently with the most Wall Street downward earnings revisions.
3. Looking at the Bull scores, Healthcare displays the strongest score of 60. Telecom is the only sector scoring below 50, with a score of 43. The top-bottom spread is 17 points, reflecting fairly low sector correlations on particularly strong market days. It is generally desirable in a healthy market to see low correlations and a top-bottom spread of at least 20 points, which indicates that investors have clear preferences in the stocks they want to hold, rather than the all-boats-lifted-in-a-rising-tide mentality that dominated 2013.
4. Looking at the Bear scores, Utilities is the leader again, but its score is only 54, which is lower than the 60-70 range it has been showing. Stocks within this sector have been the preferred safe havens on weak market days. Telecom also has shown good relative strength during market weakness. Energy continues to display the lowest score of 40. The top-bottom spread has dropped to 14 points, reflecting higher sector correlations on particularly weak market days. Again, it is generally desirable in a healthy market to see low correlations and a top-bottom spread of at least 20 points.
5. Technology displays the best all-weather combination of Outlook/Bull/Bear scores, while Telecom is clearly the worst. Looking at just the Bull/Bear combination, Healthcare is the leader, followed by Utilities, indicating superior relative performance (on average) in extreme market conditions (whether bullish or bearish). Energy and Telecom score the worst, indicating general investor avoidance during extreme conditions.
6. Overall, this week’s fundamentals-based Outlook rankings continue to look neutral as defensive and economically-sensitive sectors are mixed about in the rankings with no clear direction emerging. Also, all-weather sector Healthcare displays the highest Bull score, which is not particularly exciting for a bullish investor.
These Outlook scores represent the view that the Technology and Consumer Goods/Staples sectors remain relatively undervalued, while Telecom and Consumer Services/Discretionary may be relatively overvalued based on our 1-3 month forward look.
Stock and ETF Ideas:
Our Sector Rotation model, which appropriately weights Outlook, Bull, and Bear scores in accordance with the overall market’s prevailing trend (bullish, neutral, or bearish), suggests holding Healthcare, Technology, and Industrial (in that order) in the prevailing bullish climate. (Note: In this model, we consider the bias to be bullish from a rules-based standpoint because SPY is above both its 50-day simple moving average and its 200-day SMA.)
Other highly-ranked ETFs from the Healthcare, Technology, and Industrial sectors include PowerShares DWA Healthcare Momentum Portfolio (PTH), PowerShares Dynamic Semiconductors Portfolio (PSI), Market Vectors Semiconductor ETF (SMH), and PowerShares Dynamic Building & Construction ETF (PKB).
For an enhanced sector portfolio that enlists top-ranked stocks (instead of ETFs) from within Healthcare, Technology, and Industrial, some long ideas include Edwards Lifesciences (EW), Actavis plc (ACT), Skyworks Solutions (SWKS), Lam Research (LRCX), AECOM Technology (ACM), and Lowe’s Companies (LOW). All are highly ranked in the Sabrient Ratings Algorithm and also score within the top two quintiles (lowest accounting-related risk) of our Earnings Quality Rank (a.k.a., EQR), a pure accounting-based risk assessment signal based on the forensic accounting expertise of our subsidiary Gradient Analytics. We have found EQR quite valuable for helping to avoid performance-offsetting meltdowns in our model portfolios.
However, if you think the market has come too far and you prefer to maintain a neutral bias, the Sector Rotation model suggests holding Technology, Consumer Goods/Staples, and Financial (in that order). But if you have a bearish outlook on the market, the model suggests holding Utilities, Technology, and Consumer Goods/Staples (in that order).
Disclosure: Author has no positions in stocks or ETFs mentioned.
Disclaimer: This newsletter is published solely for informational purposes and is not to be construed as advice or a recommendation to specific individuals. Individuals should take into account their personal financial circumstances in acting on any rankings or stock selections provided by Sabrient. Sabrient makes no representations that the techniques used in its rankings or selections will result in or guarantee profits in trading. Trading involves risk, including possible loss of principal and other losses, and past performance is no indication of future results.