

The Fibonacci series of numbers make me think of designs in nature, and patterns that come to life again in art and architecture. Images like these:

(Source)

(Source)
(Source)
I also think of some rather mystic notion that the Fibonacci series of numbers — which generate the "golden ratio" — can somehow help equity traders examining a chart predict which way the price line is going move. I've assumed we're looking at "group think" and not magic, and certainly not the rules of the universe affecting something so contrived as the US stock market.
In the third interview in our series, I asked John Ehlers about the Fibonacci series and whether he puts Fibonacci numbers to use in his trading algorithms.
Ilene: Has Fibonacci or his series of numbers influenced your trading system?
 John: Fibonacci is kind of a hero of mine. He is also called Leonardo de Pisa and was born in about 1170 AD. His father was a merchant who directed a trading post in what is now Algeria. He returned to Pisa in about 1200 AD. He introduced the Hindu-Arabic numbering system to the western world when he published Liber Abaci (Book of Calculation) in 1202 AD. Up till then, Roman numerals had been used, and they were terribly inefficient for commerce. Just think about it. Roman numerals had no concept of zero. Negative numbers were not used in Europe until much later – but that was before they had margin calls.
In his book, Liber Abaci, Fibonacci solved a problem involving the idealized growth of a rabbit population, solving generation by generation as a sequence of numbers. That sequence creates the next number in the sequence as the sum of the previous two numbers as: 1, 1, 2, 3, 5, 8, 13, 21, 34, 55, 89 144, 233, 377, etc. The golden ratio is taken as the ratio of the limit of the ratio of the consecutive numbers in the sequence. For example, 377/233 = 1.618 — the golden ratio.
Some 20th century artists and architects have proportioned their works to approximate the golden ratio because it seems to be aesthetically pleasing. Some traders have picked up the concept, probably for the same reason. The golden ratio, and its reciprocal, are used to establish targets for advances and pullbacks. By assigning Fibonacci numbers to the time axis, logarithmic spirals can be plotted that are supposedly predictive of price peaks and troughs. I think these are just “magic numbers,” numerology, if you will. One would have thought that Fibonacci would have had the common sense to start his sequence with two rabbits.
Ilene: Well, I was going to ask why he set out to describe rabbit reproduction starting with ONE rabbit…
John: Actually, you can start a Fibonacci sequence with any two numbers. My friend Greg Morris gave me an example. Suppose you start the Fibonacci sequence with 2 and 19. Then, the sequence would be 2, 19, 21, 40, 61, 101, 162, 263, 425, 688, etc. In this case, the golden ratio computes to be approximately 688/425 = 1.6188. In the limit, the ratio is the same as with the original Fibonacci sequence. This shows that the golden ratio can be achieved with numbers other than the Fibonacci numbers, depending on the starting seeds. Since we are talking about numerology, let’s examine the seed numbers we used. B is the second letter of the alphabet and S is the nineteenth letter of the alphabet. So that is what the Fibonacci sequence is: B.S.
Ilene: So you do not use these numbers, the golden ratio, or the derivative patterns in your trading systems?
John: Not just no. Hell No. It is my goal to bring science to the art of trading as opposed to using magic numbers. Magic numbers are a wonderful way of explaining history, but I don’t think they have any predictive powers. Using magic numbers, any one of them is bound to be correct if you put enough lines on the chart. The scientific approach involves applying information theory with the use of modern Digital Signal Processing (DSP) to arrive at higher probability forecasts of future prices. These forecasts produce trading signals. At StockSpotter.com we use a very fast-acting cycle indicator to identify the toughs of tradable cycles. If a cycle has been present in the past, the presumption is that it will continue a short time into the future – long enough for us to take a short term position. Since the cycle indicator is fast-acting it can lead to some whipsaw trades, and so we combine it with a more slowly reacting momentum indicator to form a reliable trade setup. A trade setup occurs when the cycle indicator is at a trough, indicated by the green bar, and the blue line momentum indicator is declining or at a minimum. Click here to see an example of the Trade Setup Analyzer chart. A trade setup is a necessary, but not sufficient, condition for a trade signal. Trade signals are produced by additional data mining for such things as degree of the trend, absolute cycle amplitude, and so forth – things that are difficult to chart.
*****
Note: Brett Steenbarger, Ph.D., at TraderFeed has been following Stock Spotters, and wrote this on his blog on Jan. 14, 2015: "On a related note, I have mentioned in the past the Stock Spotter site of John Ehlers and Ric Way. They make use of cycle analysis to generate buy and sell signals for individual stocks and ETFs. Notably, they publish their track record of signals and have done well overall. I note that, as of yesterday's close (Jan. 13), they had 138 buy signals on stocks. Since late 2013, when I began tracking the service, there have only been five occasions in which we've had 100 or more buy signals. It's a small sample, to be sure, but all five occasions were higher in SPY five trading sessions later, by an average of 1.59%."
While the engineers at StockSpotter.com usually talk about the science of their trading signals and make no ridiculous get-rich-quick claims, the StockSpotter trading performance last week (Jan. 20-24) — the week following Brett's comment — was outstanding:
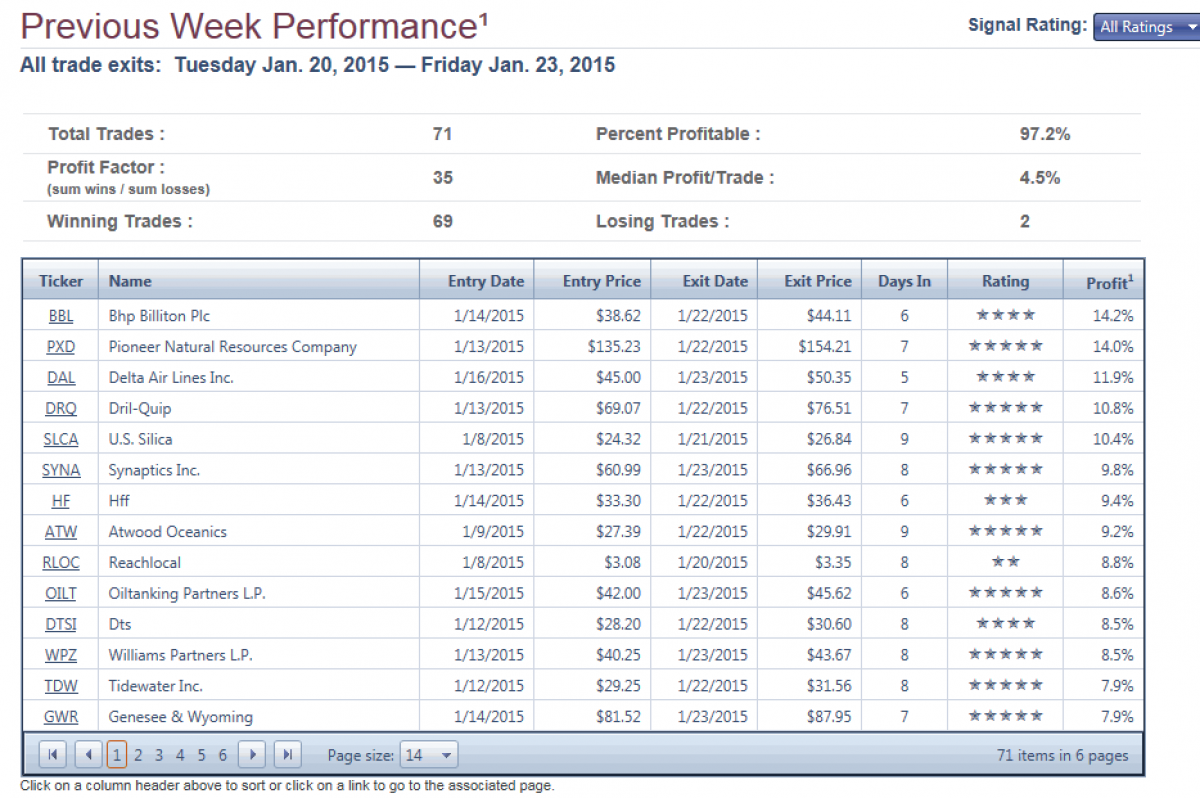
97.2 percent of the 71 trades closed out last week were profitable. The Profit Factor (ratio of gross winnings to gross losses) was also very high. Profit Factor is analogous to the payout in gaming. If you think in terms of gaming, the combination of percent winners and Profit Factor are a statistical description of performance. This is only an example for last week but the long range statistics are pretty good too. (Review the performance here.)
Special Offer: Try StockSpotter for only $16 for 20 days by clicking here and using the promo code XPN4387 for a 20% discount. Traders have free and unlimited access to StockSpotter.com Trade Setup Analyzer and Forecasting charts, as well as to the Stealth Hot Stocks and Momentum Screeners.
Previous interviews with John Ehlers: