

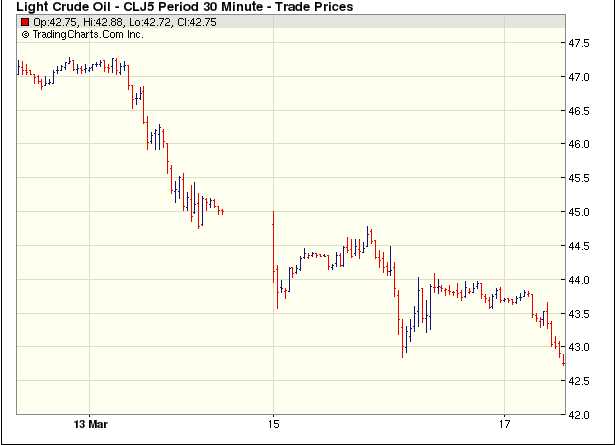 Oil is down 10% this week (so far).
This is being caused by FAKE!!! orders that have been placed at the NYMEX where traders pretended to demand hundreds of millions of barrels of oil in order to inflate prices during the summer. Now they are suffering for their scam as the physical inventories have filled up and they are forced to roll (now 5% of the contract cost per month) or cancel their fake orders when there are no buyers present.
In other words, this is EXACTLY what I told you would happen when oil was at $107 in June! As I said at the time:
Forget peak oil, we're seeing PEAK DEMAND for oil pass us by! Keep in mind that the non-OECD line on the chart above is just 1/4 of all demand and that is barely positive while OECD demand (66M out of 90Mbd demand) has been NEGATIVE since 2008 with the very brief exception of 2011 but, of course, that was only up 2% compated to 2010, which was flat to 2009s 5% decline.
In other words, the demand NEVER CAME BACK but that fact is being covered up by a cartel of Billionaires who own the supply of oil as well as the media that they control (see excellent History Channel report on the subject). As I noted yesterday, the "demand" on the NYMEX for 172M barrels of oil that is scheduled to be delivered to the US in July is completely and utterly FAKE and those contracts will almost all be cancelled by next Friday – purposely shorting our country's oil just at the start of summer driving season.
Our play at the time was shorting the /CL oil futures at $107. At $47, those shorts were already up $60,000 per contract and, for non-futures players, I sent out an alert that morning to our Members on SCO (ultra-short oil ETF), which was down at $24.87 at the time and our option trade idea was 20 Oct $22/26 bull call spreads at $1.30 ($2,600), selling 10 of the $24 puts for $1.25 ($1,250) for net $1,350. As you can see on the chart, we were well over target in October and that trade returned $8,000 per set – a 492% return in 4 monts – much better than the mere 50% gain in the contracts!
 That's what we love about options, we can use them both for leverage and protection at the same time and we can give ourselves fantastic returns if we are only just a little bit right. Futures are nice too. Had Obama listened to me and handed me the keys to the Strategic Petroleum Reserve and let me sell (short) 350,000 contracts at $107, we could have dropped $22.4Bn in to treasury at $43 a barrel. That's much better than the $3.9Bn I could have made him the year before, when I made the same offer.
I'm not going over this stuff to brag about it (though they were amazing calls) – I'm going over it so you can see that we do understand oil trading and that perhaps you can now benefit from our LONG trade ideas on oil.
We're already long on UCO ($6.48) and USO ($16.35) in our Member Portfolios and we're already long in the Futures at the $42.50 line on /CLJ5 ($45 on /CLK5), with tight stops as we think $40 may be tested first ($42.50 on /CLK5 – the May contract). As you can see from the SCO chart above, not only didn't our trade pay off right away, but it went against us in June and July. This is NOT an exact science – these trades are not for the feint of heart. We're targeting $60 on oil by July, that's up $17,250 per contract if all goes well.
I will go over some option trade ideas for playing oil today in a FREE session of our Live Trading Webinar at 1pm (EST) and I hope you'll join us there and, of course, we'll have plenty of trade ideas for our Members in our Live Chat Room.
 This morning we got some TERRIBLE housing data with February Housing Starts off 17% from the prior month at an annualized pace of just 897,000 homes. There are 110M homes in America so we're only replacing them once every 100 years and not accounting for any growth – that doesn't sound healthy at all, does it?
They will, of course, blame the weather for the low housing starts but the data wouldn't have been impressive if it were up 17% instead of down 17% because the "normal" amount of starts is more like 1.5M. This isn't Europe, we didn't build our houses out of bricks like the wisest piggy but, at least we didn't use straw. Most houses in the US are built out of sticks and sticks, as we know, don't always last 100 years. That's why HD and LOW are doing so well – there's a lot of repairs to be made when no one is buying new houses.
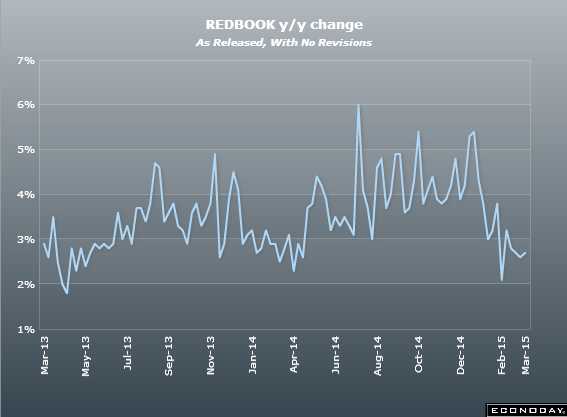 Retail Sales were no picnic either, up 2.7% from last year barely keeps up with inflation. Again the weather to blame (who knew it would be cold in February?). March should be aided somewhat by an early easter (April 5th) and, of course, when there's good news, they never blame the weather or the timing of holidays – they just act like it's a sign of an improving economy but look at that collapse from the Fall numbers – improving?
We're short XRT (Retail Sales ETF) but it's still up around $100, and that's up 20% since last March, even though Retail Sales are only up 2.7%. That must be one incredibly high-margin extra 2.7%, right? I will admint I had a $7.50 cup of hot cocao in Sachs this winter – I'm sure that had a huge profit margin, so maybe…
There's a lot of maybes behind this rally. A lot of hopefullys as well. I just HOPE that, one day, we get some data that actually confirms these sky-high valuations!
