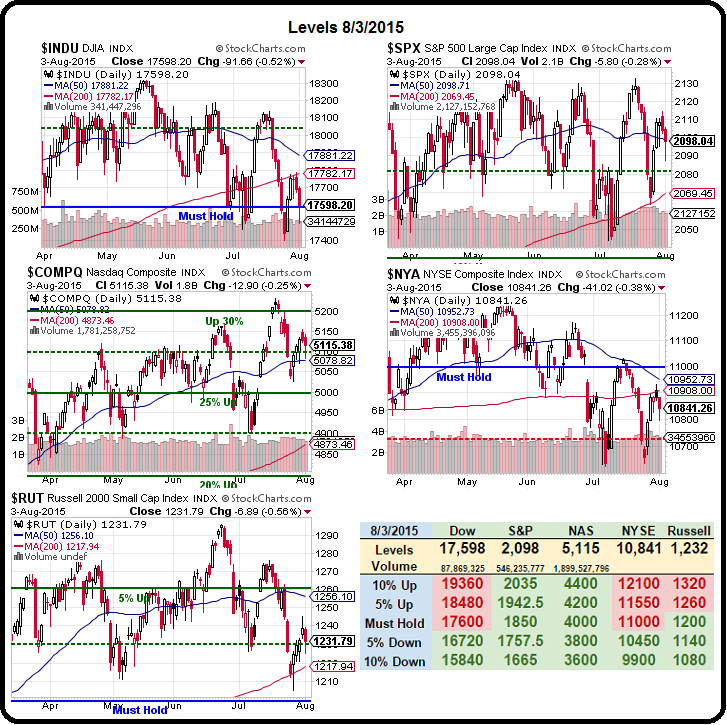 Today the NYSE is 56 points from a "death cross."
That's something we discussed regarding the Dow on Friday, so we won't get all into it again just because another major index looks like it's about to flash a major bearish signal – it's just something else we can enjoy ignoring while we wait to see if the S&P can take back 2,100 on all the "good" news out of China.
That's right, the Shanghai Composite jumped 3.69% last night as China made it even harder to short their market, requiring short sellers to wait 24 hours to cover their positions and repay loans used to buy shares. That means there is a longer period to short a Chinese stock than to buy a gun in the US! All this financial manipulation did not cheer up the copper market, which remained down at $2.36/lb along with Aluminum, both at 6-year lows.
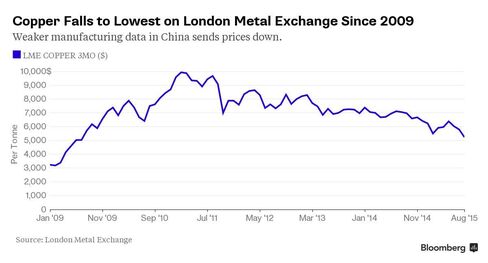
A private Chinese factory gauge released on Monday fell to a two-year low in July and an official index on Saturday slipped to the weakest in five months, adding to a near-$4 trillion rout in Chinese stocks and declining car sales that are threatening economic growth. The country uses about 40 percent of the world’s copper and half its aluminum. In the U.S., manufacturing cooled in July from the highest level in five months.
 Commodity prices have slumped to the weakest level in 13 years as supply gluts emerged in everything from oil to metals and crops. Zinc joined aluminum, nickel, lead and tin in bear markets on Friday amid the slowdown in China. The Bloomberg Industrial Metals Subindex reached the lowest since April 2009. “Copper could still go lower from here before it starts to pick up pace again,” said Wayne Gordon, an analyst at UBS Group AG in Singapore. “We now are pushing that recovery out a little bit into the fourth quarter.”
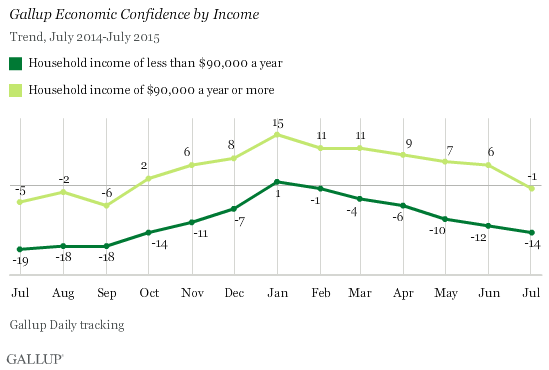
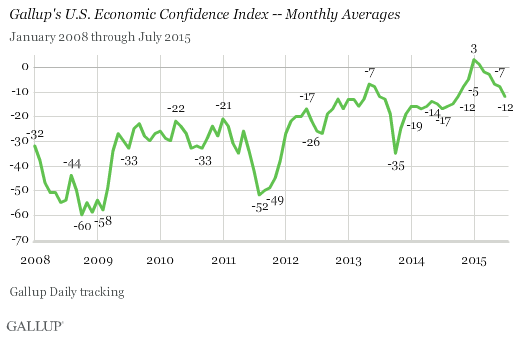
This is not isolated to China, of course. As we've discussed, it's already clearly spreading to Asian trading partners and Europe is feeling the effects of China's slowdown and so, apparently are we as July's Gallup Economic Confidence Index got 50% worse, falling from -8 to -12, though still a far cry from the kind of crisis mentality that gripped us in 2008. Still, does this really look like the confidence underlying a market that is making record highs?
I know, I am such a downer! As I have said before, my biggest mistake in 2007/8 was NOT chasing more people into CASH!!! at the top of the markets. I know it's boring and I know it costs us subscribers because no one wants to sign up for a stock market newsletter that tells people to stay out of the markets but THAT is what the current market conditions call for and that's my job – to tell you what I see…
I'm not the only one who sees it. Notice how "Economic Outlook" is decaying much faster than current conditions. That's because the people who are surveyed see their own outlook getting worse but they are also brainwashed by the MSM who tells them everything is awesome in America but, as you can see from this chart, even the top 10% are getting a bit worried now.
In fact, the top 10% haven't been this worried since last August/Sept, when the S&P topped out at 2,019 in mid-September, only to fall to 1,820 (10%) over the next few weeks. If you don't want to get "Cashy and Cautious" – in the very least please try to be careful and use some hedges for your positions. We got a bit more aggressive with our Jan hedges (SQQQ, TZA) on Friday and today we'll be watching for action around 2,100 on the S&P to determine whether or not to stick with our Sept Ultra-Short S&P (SDS) hedges.
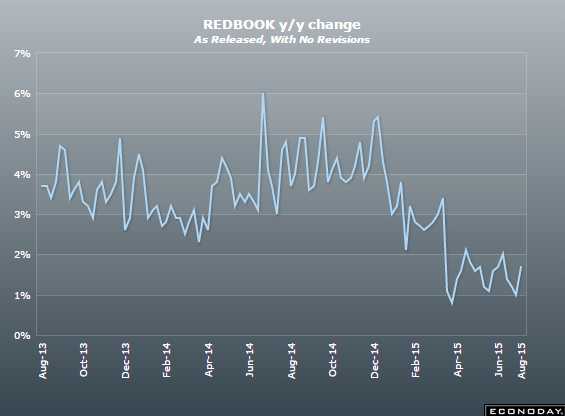 Another indicator we have this morning is Redbook Retail Sales, which measures sales at chain stores, discounters and department stores. That indicator is somewhat encouraging compared to last month but, looking at the bigger picture, we're mile's off last year's pace. Yet consumer stocks and retail stocks are booming – as if they don't have a care in the world…
Investor sentiment has become completely detached from the market at this point, with just 21% bullish according to the American Association of Individual Investors (AAII). This represents the lowest level since early June and the 18th straight week that it has been below the average reading of 38.19% since 2009. Last week's move in bearish sentiment was even larger, as pessimism spiked up to 40.7%. That's the highest level of bearish sentiment in nearly two years (Aug 2013). As a result of this week's moves, the spread between bullish and bearish sentiment now stands at -19.59%, which is the most negative spread since April 2013!
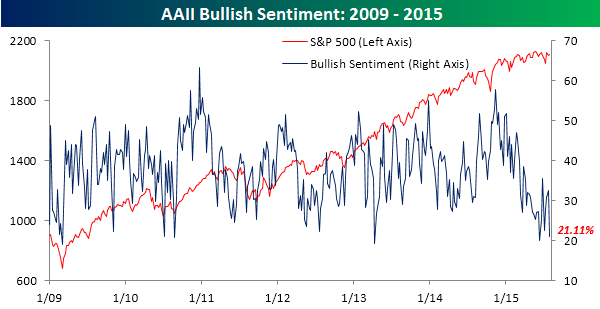
That has pushed neutral sentiment below 40% for the first time since April but let's not read too much into this as clearly the Fed has been papering over this indicator since 2012. As long as our Federal Reserve and the People's Bank of China and the European Central Bank and the Bank of England and the Bank of Japan and all the other Central Banksters are willing to prop up the markets – they are likely to remain propped up.
BUT – isn't it obvious to you that, the moment they stop extending and pretending, this house of cards will come tumbling down?