

 Oops, sorry, I'm not supposed to do this.
Sometimes we know things in advance and we are not allowed to talk about them until the data is release and Personal Income and Spending reports don't come out until 8:30 but we already know Personal Income and Spending are heading lower, not higher as expected, because it's right in yesterday's GDP Report, which shows Real Annualized Per Capita Disposable Income at $37,843, which is down $3 from the last estimate, not up at all.
Overall Gross Domestic Income (GDI), which includes our Corporate Masters, increased just 0.6% in the 2nd quarter, compared to 0.4% in the first half. This does not seem like the kind of number that would lead us to have a MASSIVE upward revision in GDP – from 2.3% to 3.7% in the second estimate and up 3.1% (400%) from Q1's anemic 0.6% growth rate.
| Category | Q2 | Q1 | Q4 | Q3 | Q2 |
|---|---|---|---|---|---|
| GDP | 3.7% | 0.6% | 2.1% | 4.3% | 4.6% |
| Inventories (change) | $121.1B | $112.8B | $78.2B | $79.9B | $77.1B |
| Final Sales | 3.5% | -0.2% | 2.1% | 4.3% | 3.5% |
| PCE | 3.1% | 1.7% | 4.3% | 3.5% | 3.8% |
| Nonresidential Inv. | 3.2% | 1.6% | 0.7% | 9.0% | 4.4% |
| Structures | 3.2% | -7.6% | 4.2% | -1.8% | -0.2% |
| Equipment | -0.4% | 2.3% | -4.9% | 16.5% | 6.5% |
| Intellectual Property | 8.6% | 7.4% | 6.9% | 6.5% | 4.9% |
| Residential Inv. | 7.8% | 10.1% | 9.9% | 3.4% | 10.4% |
| Net Exports | -$532.7B | -$541.2B | -$463.6B | -$429.1B | -$443.3B |
| Export | 5.2% | -6.0% | 5.4% | 1.8% | 9.8% |
| Imports | 2.8% | 7.1% | 10.3% | -0.8% | 9.6% |
| Government | 2.6% | -0.1% | -1.4% | 1.8% | 1.2% |
| GDP Price Index | 2.1% | 0.1% | 0.1% | 1.6% | 2.2% |
How did we pull off such an amazing turnaround in such a short time? Well, coming off a bad quarter gives you very easy comps, for one thing. Structural investments fell 7.6% in Q1 and going up 3.2% in Q2 still makes us overall leaves us down 0.2% from Q4 of last year (which was only up following two negative quarters) but it makes for a very impressive 10.8% q/q swing!

A statement like that doesn't fit in a news headline or a tweet, so you'll never hear it from the MSM but Dave Fry sums it up very nicely, saying:
GDP came in a “revised” 3.7% vs 2.3% but as Consumer Metrics Institute summarizes the data below it may not be as good as you think:
“Once again we wonder how much we should trust numbers that bounce all over the place from revision to revision. One might expect better from a huge (and expensive) bureaucracy operating in the 21st century. Among major economies, only the Chinese numbers are more suspect.”
It’s no surprise the government is messing with important statistical data. They’ve done it before with employment and inflation data.
The other factors that swung the report were the usual Q2 jump in Government Spending (if you don't use your budget by June 30th, it gets cut for next fiscal year) and a huge rise in inventories which, traditionally were considered a good thing because the "wise" people who sell things wouldn't order stuff that the customers weren't going to buy. That is tragically flawed Econ 101 thinking from the 60s, where local store managers who understood their local customers did the buying.
 Now these decisions are made by, for example, Wal-Mart's central computer in Arkansas, which orders and ships to the whole country and it is influenced by the expectations of managers, who are under constant pressure to improve their sales numbers and that, coupled by the fact that the sales managers in the top 10% are increasingly out of touch with the poor consumers in the bottom 80% and overly influenced by the Corporate cheer-leading MSM – leads to a lot of bad decision-making.
As you can see on the chart, we've had nothing but building inventories for 5 years now. This chart is the CHANGE in inventories in Billions of Dollars so we cleared out $700Bn of excess inventory during the crash (companies stopped spending) and have since replace it AND added $1,700,000,000,000 to replace it. That's a $1Tn build in UNSOLD inventories in 5 years and no sign that buyers are showing up – how is this considered a positive factor in GDP?
The only thing driving the US economy at the moment is low oil prices. Gasoline is currently $2.63 per gallon, down from $3.45 per gallon last year and cars are using 3% less gas on the average than they did last year as we continue to replace our fleet with more efficient cars (thanks Obama). In fact, according to the EIA, we are now only importing 27% of our oil from overseas.

Anyway, so if the average person drives 15,000 miles a year and used to have a 20 mpg car they needed 750 gallons of $3.45 gas last year ($2,587.50) but this year they have a new 30 mpg car so they only need 500 gallons of $2.63 gas and that's just $1,315, leaving them with $1,272.50 more disposable income than they had last year ($100/month). Multiply that $100/month times 200M drivers and that's a very nice $20Bn monthly bonus!
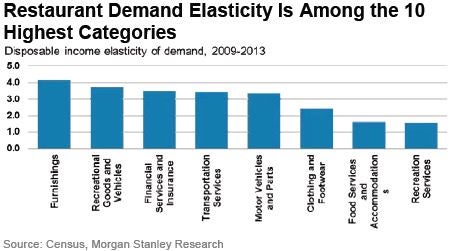 As traders, our job is to figure out what people do with their disposable income and, as it turns out, there's a chart for that! Apparently Furniture is the big winner, followed by Cars, a little Savings and Speculation followed by Clothing, Food and, finally Recreation. Like the man said, learn to "follow the money" and you'll know how to invest yours…
Unfortunately, a negative effect of yesterday's relief rally is that Gasoline Prices jumped 10%, wiping out $2Bn of monthly consumer savings in a single day. Since the market is a forward-looking price discovery mechanism (in theory, in practice it's a manipulated con game), we're not going to be able to sustain this rally if it's based on rising fuel costs, as that will put us right back where we started.
Meanwhile, on Tuesday we told you to expect strong bounces on our indexes but that we had to be OVER those lines by Friday to remain bullish (otherwise we turn a bit more bearish into the weekend). We don't expect a bit sell-off today because Monday is the end of the month and the Banksters like to have pretty-looking charts to put on their brochures, so they'll do whatever it take to keep things floating a few more days.
- Dow 16,200 (weak) and 16,650 (strong)
- S&P 1,900 (weak) and 1,950 (strong)
- Nasdaq 4,550 (weak) and 4,700 (strong)
- NYSE 10,050 (weak) and 10,300 (strong)
- Russell 1,130 (weak) and 1,160 (strong).
From Monday's post, we had suggested taking longs on the index Futures at:
- Dow 15,840 (/YM), now 16,655 – up $4,075 per contact
- S&P 1,850 (/ES), now 1,988 – up $6,900 per contract
- Nasdaq 4,000 (/NQ), now 4,813 – up $16,260 per contract
- Russell 1,080 (/TF), now 1,154 – up $7,400 per contract
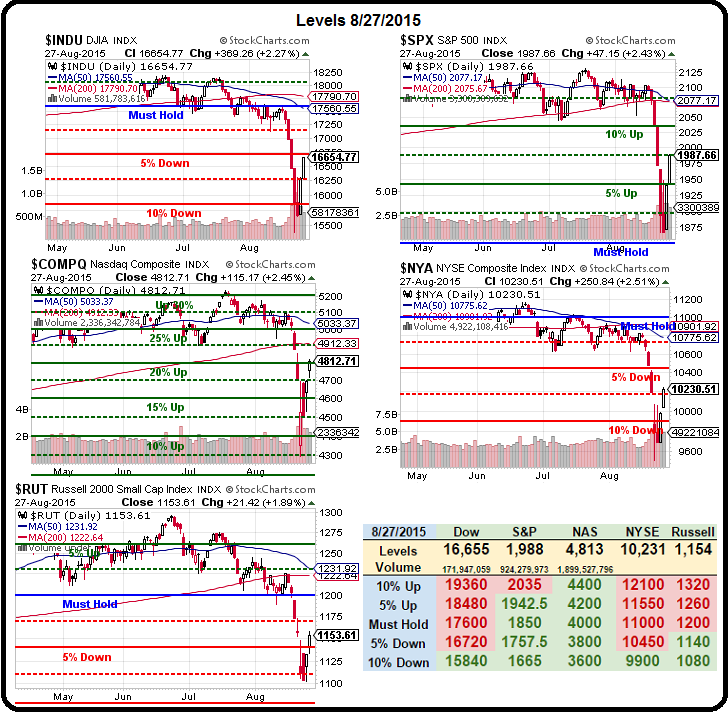
First of all, I want to apologize for missing our Dow target by 5 points (0.003%). We'll have to re-check our calculations and promise to do better in the future. 😎 Meanwhile, the S&P blew past our line and the Nasdaq is also way over but we're still waiting for the NYSE and the Russell to join the party. If any of our strong bounce lines fail – that will be bearish while getting green on the NYSE or the Russell (if the others hold) will be a bullish sign.
Next week promises to be just as exciting as this week has been – we can only hope it's just as profitable!
Have a great weekend,
– Phil