

Down 5% already?
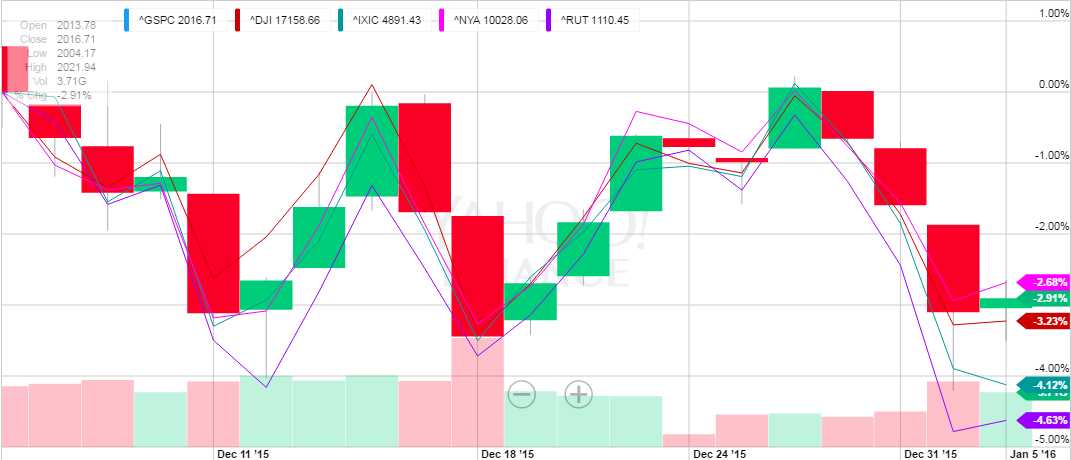
This has been one ugly week already and we're only at the beginning of day 3! Our Futures are, at the moment (8am), down almost 2% and, as you can see from the chart above, our major indexes were already down 3-4% so now we're testing our 5% lines across the board in the 5th session since 12/29, when I warned you that:
What you should, however, be concerned about is how FAKE the action was as it drove the McClellan Oscillator well into overbought territory. The McClellan Oscillator is a breadth indicator derived from Net Advances, which is the number of advancing issues less the number of declining issues. It's a momentum indicator, similar to MACD that gives us an idea of whether or not a rally is broad-based enough to be sustained and, clearly, this one isn't.

What we have going on at the moment is good, old-fashioned window-dressing – aimed at painting a picture of 2015 that will be sold to potential investors in 2016. The brokers need you to put your money in the market so they can charge you fees – that's how the game is played and it really helps their sales pitch if the market wasn't negative the year before so all stops are pulled out to get us green at the end of the year…
There's a whole lot of chasing going on as we close out 2015 – we're not chasing anything until we see how 2016 comes out of the gate. For now, we remain "Cashy and Cautious" into the New Year.
THIS (what is happening now) is exactly the kind of thing I am worried about when THAT (what happened last week) is going on. Unfortunately, I will have to suggest that you also read last Wednesday's "Black Swan Preview" now that we are, in fact, plunging to our doom and perhaps take some of my 2016 concerns more seriously.
One date we were watching was Jan 8th, which was the day large shareholders were to begin to be able to sell stocks again over in China. That date has been extended by 6-12 months in 30+ major firms this morning with more to follow in the next two days – that should help a bit…
Another major swan we were watching that morning that's gotten blacker already is Germany (and all of Europe), where the DAX has fallen from the 11,000 line back to 10,100 already, which is down 8% for the week. Watch the 9,900 line very closely – that's the -10% line and, if that fails – the rest of Europe will likely go down the drain too! Our 5% Rule™ says 11,000 to 9,900 is 2,100 so we expect 420-point bounces to 10,320 and 10,740. Failing 10,320 (the weak bounce line) on the way down is a pretty strong indication we will be testing the 9,900 line before the DAX is done falling this week.
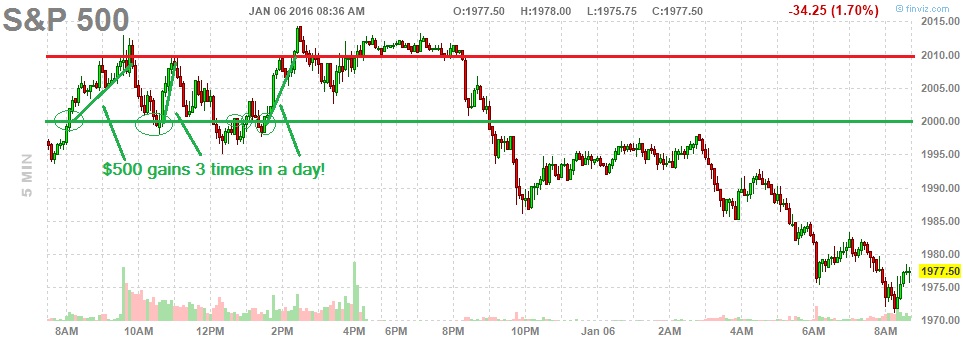
Nonetheless, this does not stop us from playing for the bounces when we can! Yesterday we called out in the morning post (enjoy these free trading samples while you can – they end soon!) long trade ideas on the Futures at S&P (/ES) 2,000, Russell (/TF) 1,100, Nikkei (/NKD) 18,200 as well as reiterating our short stance on Amazon (AMZN) and Netflix (NFLX) – both of whom are hitting our targets this morning.
AAPL is also hitting our goal this morning to step in long at the $100 line (initial entry, happy to double down if they go lower). We were too early flipping bullish on QQQ by turning our short SQQQ hedge into a short play as SQQQ should be up to $21 this morning but we did take $5.44 off the table so paying back $1 or even $2 at $22 won't ruin the trade (and we'll adjust, of course).
Meanwhile, back to the Futures: As you can see from the S&P chart, we got 5 swings at our long idea at /ES 2,000 and caught 3 10-point runs for $500 each (+$1,500) and a couple of small misses in the afternoon for $100 losses (-$200) if you stopped out quickly (as you should when you are learning). The Russell was choppier but held 1,100 better so no stop-outs with 4 chances to gain $500-$1,000 on it's runs but the Nikkei only gave us that one $750 run though now it's down at 18,000 and an interesting long above that line (/NKD) with TIGHT stops below.
We have a little more conviction playing for at least weak bounces off our 5% lines so, using the Futures, let's plan for a little bouncing action today as long as /NKD does hold 18,000 and the Dollar is under 100 and AAPL holds $100 (yes, it is the most important stock in the World!):
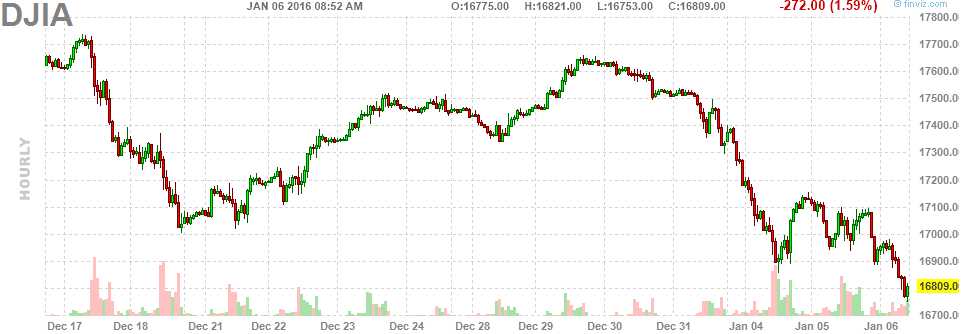
Dow (/YM) 17,600 is our Must Hold Line so let's call that significant and we failed it on Thursday and 5% down is 16,720, which we're testing this morning but figure 16,750 should hold (bots love 5s) so good long spot there and the weak bounce off the 880-point drop (to 16,720) should be 16,900 (rounding) and a strong bounce would be 17,100. Now, consider that's a calculation based on our 5% Rule™ and that 17,600 has been our predicted Dow line since 2013 and now look at what actually happened on the way down:
When you see an index almost perfectly following our 5% Rule™ on the way down, it can give you confidence in our bounce lines since, clearly, the Bots are in control of this market movement and Bots are far easier to predict than foolish humans. So we're looking for AT LEAST a weak bounce back to 17,900 and, if that fails and then 17,720 fails – that would indicate we're more likely in the middle of a 10% correction – something the market hasn't had since the 8/24 flash crash, when the Dow hit 15,500 (and lower intra-day) – a 12% drop from 17,600 which the 5% Rule calls a standard 10% drop with a 20% overshoot that quickly corrects to -10% (15,840).
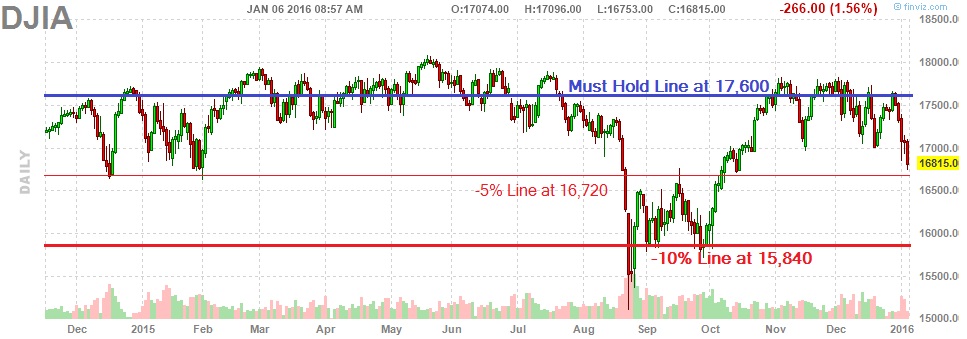
Frankly, I don't know how anyone looked at this chart all year and concluded they should be bullish. Don't forget they put AAPL into the Dow to make it look better – without AAPL, the Dow would have had a very sad year and now it's AAPL that has helped to bring the Dow back down as it's 30-point drop has cost the Dow over 250-points since August.
This is our great secret to making all those fantastic market calls we occasionally share with you – we KNOW what's going to happen because we have charts that actually work. There's no mumbo-jumbo – just math that we apply to a manipulated system that takes into account the fact that 85% of all market trading is done by robots, not humans – and robots have their own special way of trading that's quite predictable.
- On the S&P (/ES), we're looking for 1,960 to hold and the weak bounce would be 1,980 and strong back to 2,000.
- On the Nasdaq (/NQ) we'll expect the 4,400 line to hold up (not that it won't break, but a recovery to there) and that will be a good spot to go long, looking for 50-points to 4,450 (weak) and 4,500 (strong) but actually 4,525 before we are impressed (sorry, out of time so summary only).
- Russell (/TF) 1,140 is the -5% line and 1,080 is the -10% line so, if that fails, we are all DOOMED!!!! Keep that in mind but from 1,080 we can expect at least a 10-point bounce back to 1,090 and 1,100 will really tell the tale as to whether or not this market is recovering. Anything below 1,180 on /TF and it's time to go short on whatever hasn't failed yet!
We have a Live Trading Webinar for our Members at 1pm, EST today where we'll can hopefully find some nice money-makers in the afternoon but, for now, long /ES at 1,970 with tight stops is a good play along with /NKD 18,000+ and /YM (Dow) 16,750 but best way to play is wait for 2 to go over and then long the laggard with VERY tight stops.
Be careful out there!