

 Generally Accepted Accounted Principles (GAAP).
According to Investopedia: "GAAP are imposed on companies so that investors have a minimum level of consistency in the financial statements they use when analyzing companies for investment purposes. GAAP cover such things as revenue recognition, balance sheet item classification and outstanding share measurements. Companies are expected to follow GAAP rules when reporting their financial data via financial statements. If a financial statement is not prepared using GAAP principles, be very wary!"
Let's keep those guidlines in mind as we discuss Microsoft's (MSFT) earnings last night as they are a fine expample of the kind of BULLSHIT that is permeating the market these days. MSFT's GAAP Revenue was $20.6Bn and GAAP Earnings were 0.39 per share, missing by a mile but, after adding back "Windows 10 deferrals to revenue" and "impairment, integration and restructuring charges", they are able to boost their non-GAAP reported earnings to $22.6Bn and that extra $2Bn of revenues, which were actual expenses but have been erasted from the report, drops straight to the non-GAAP bottom line and almost doubled non-GAAP earnings to 0.69/share – a nice beat!

And that's not the end of it as MSFT also made non-GAAP (non-Generally Accepted) adjustments to their taxes and reports that they will only pay $225M on $3.3Bn in earnings (7%). We can be outraged about this on many levels but the earnings weren't real so it's really not fair to expect them to pay taxes on their fake earnings, is it? It is, however, "fair" to expect invesors to pay $55 for the stock this morning, up from $53 yesterday based on all these fake earnings. After all, the investors are just suckers, born every minute and growing up to hold the bags.
 Microsoft is part of the Big Con, which is moving the whole market to all-time highs. It's a significant stock on all the indexes so it will lead us higher this morning – even as the broad market continues to sell off as the big boys run for the exits during this "rally". By holding up just a few large-cap stocks, the Fund Managers and Banksters can cover their tracks as they sell off the rest of their holdings – all the while enticing Retail Suckers to BUYBUYBUY at the top of the market.
Yesterday's S&P volume was even lower (47.7M) than Monday's record low so, if you are trading, you may as well get to be on a first name basis with your counter-parties – there's only a few of them left and, of course, most of them are either HFT trading programs or Central Banks propping up the markets in order to convince people that "all is well" when it clearly is not.
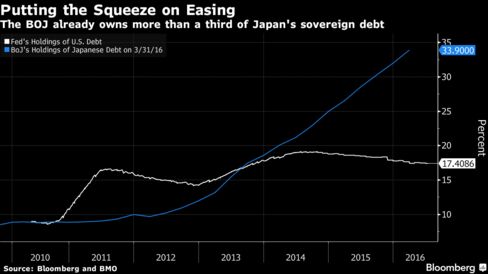 Speaking of Central Bank buying frenzies, the Bank of Japan now owns 1/3 of Japan's Sovereign Debt. That would be like the Fed owning $7Tn worth of our debt! That would be crazy, right? Fortunately, our Fed "only" owns $3.4Tn of our debt, so nothing to worry about – yet.
But, over in the Land of the Rising Sum, the sums are getting staggering. When you wonder what sort of idiots are buying bonds that have negative rates of returns, keep in mind those idiots are our own Central Banksters, who are papering over low demand for bonds at these prices by buying the bulk of all notes that are put up for auction. They can do that because the losses they incur, down the road, are simply charged back to the people – a stealth tax on your wealth in the form of Future debt (and here's the ECBs list of bond purchases).
Don't worry though, you'll have moved to a tax exile long before then, right? I know that you, like those other 214,488 offshorte entities that were exposed in the Panama papers on April 3rd that we've all already forgotten about, are well prepared for your own personal Brexit or wherever it is that you will be exiting when the bill comes through for all this financial engineering. Don't forget, those real estate and bank earnings looked great in mid-2008 – until it was discovered they were all BS – based on the same non-GAAP BS we're seeing again today (because, in the end, no significant regulations were ever passed to stop the madness).
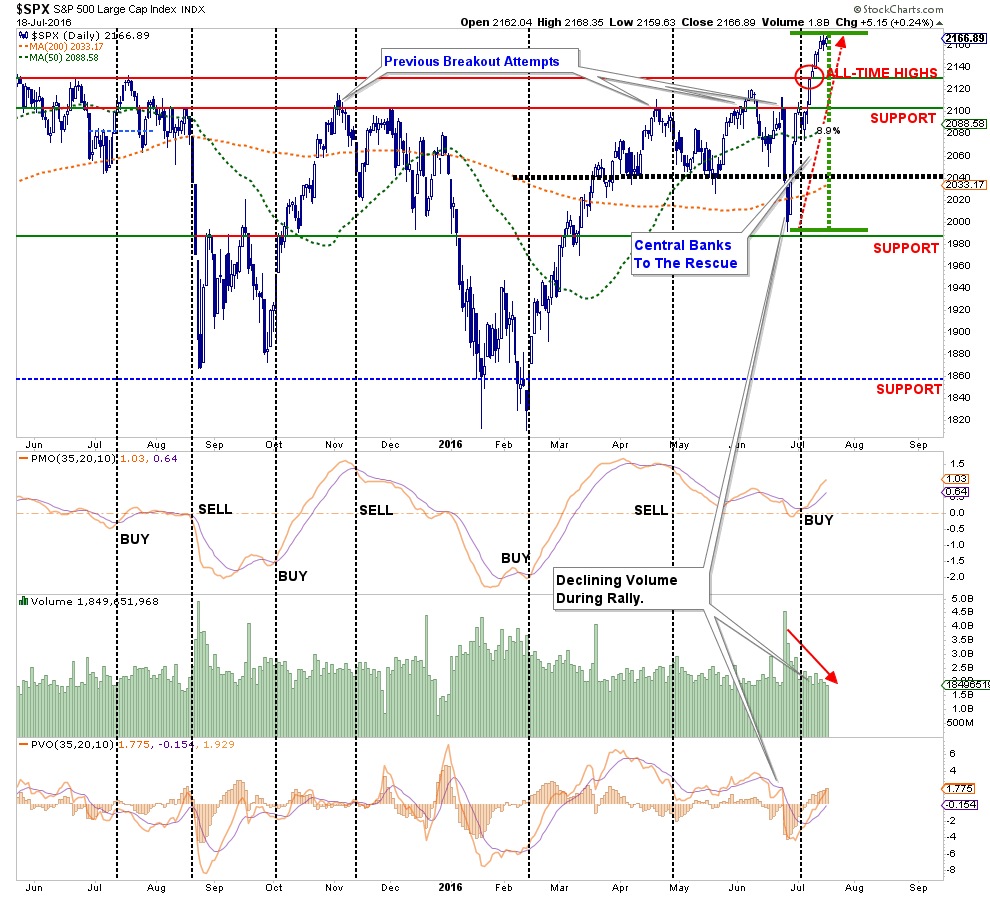
Meanwhile, everything continues to come up roses on the S&P as the volume dwindles away to zero. We can watch these support lines, illustrated by Lance Roberts, who also has some good notes on technical levels to watch:
Like stretching a “rubber band” as far as you can in one direction, the band must be relaxed before it can be stretched again.
However, as noted in the chart above, there is a difference in pullbacks.
- A pullback to 2135, the previous all-time high, that holds that level will allow for an increase in equity allocations to the new targets.
- A pullback that breaks 2135 will keep equity allocation increases on “HOLD” until support has been tested.
- A pullback that breaks 2080 will trigger “stop losses” in portfolios and confirm the recent breakout was a short-term “head fake.”
The magnitude of the current extension of the market above its 50-day moving average can be seen if put into context of a long market cycle. The chart below shows the number of times the market has reached 3-standard deviations of the 50-dma. In the vast majority of cases, it was not long until the market experienced a pullback, correction or worse.
As you know, we are "Cashy and Cautious," leaning bearish into this weekend with no chance of changing our mind until next week's earnings. If they are better than expected, we might start nibbling at discount stocks again but, for now, it's a "watch and wait" kind of week.