

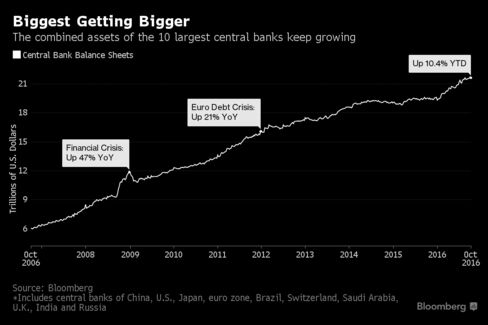 $3 Trillion Dollars!
That's how much QE stimulus has been added by the World's Central Banksters in the last year and the headlines say it's "only" a 10% increase (in 2016, not 12 months) but it's 10% of a MUCH BIGGER NUMBER than when we had a 20% increase in 2012 ($2.4Tn from $12Tn) or a 47% increase in 2009 ($2.4 Tn from $9.5Tn). This is in fact, the most stimulus EVER pushed into the markets and the S&P is at 2,132, after starting the year at 2,050 so up 82 points is 4% for $3Tn.
 So it costs about $1Tn to buy 1% of S&P growth these days – that's not much bang for the buck. From Jan 2012 (1,250) to Dec (1,425) $2.5Tn bought us 175 points, which was 14% so now we're spending 30% more to get 70% less now. How long will this madness continue? Will we spend $4Tn to buy another 1% growth or will the Central Banskters finally admit their policies are a dismal failure and, at this point, doing far more harm than good?
In China (and it always comes back to China), Beijing has quietly launched the biggest fiscal stimulus in history, one that is even bigger than 2009-10, following the global meltdown. According to Evercore ISI, the size of the stimulus is a whopping 4.5 %- 5.0% of GDP in 2016 or, to put it simply, 2/3 of China's GDP growth is nothing more than fiscal stimulus!
 This terrifying chart shows you just how far off the rails the Chinese Government has driven the stimulus train, driving the Government's fiscal balance from +400Bn in 2008 to – 3,000Bn in 2016 adding 429Bn more debt in August alone!
THAT is how China avoided our predicted August melt-down and all the demand numbers you are seeing from China that are being treated as good news are completely stimulus-driven and are simply not a sustainable reality. For example, the dramatic surge in car purchases is not due to organic demand, but is the result of a tax cut (by half) on small engine cars implemented by the government in September, 2015. Since the cut, China’s auto sales have increased by 33%.
China’s total debt was more than double its gross domestic product in 2015, a government economist has said, warning that debt linkages between the state and industry could be “fatal” for the world’s second largest economy. The country’s debt has ballooned to almost 250% of GDP, thanks to Beijing’s repeated use of cheap credit to stimulate slowing growth, unleashing a massive, debt-fuelled spending binge.
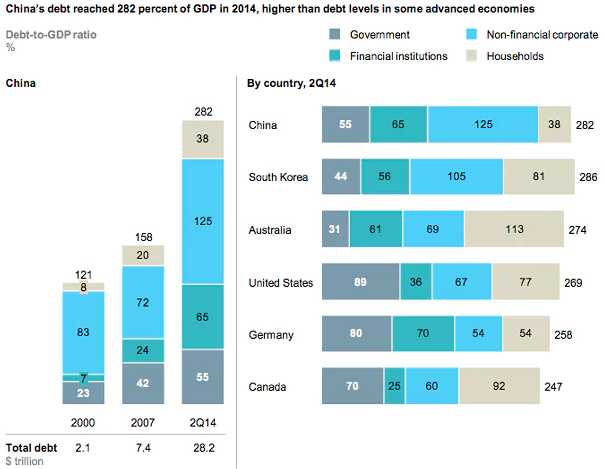
China’s borrowings hit 168.48 trillion yuan ($25.6 trillion) at the end of last year, equivalent to 249% of economic output, Li Yang, a senior researcher with the leading government think-tank the China Academy of Social Sciences (CASS), has told reporters. The consulting firm McKinsey Group said earlier this year that the country’s total debt had quadrupled since 2007 and was likely as high as $28 trillion by mid-2014.
As you can see from the chart, the big differentiator in China's debt is the massive amount of Corporate Debt and, since this 2014 chart, that's the portion of China's debt that has risen most rapidly. Corporate Debt in China is far bigger than their entire GDP, making the very concept of a bailout impossible if we have another 2008-type of meltdown. There simply isn't enough money in all of China to rescue the system if things start to fall apart.
 I know – you are probably cynically thinking "that's all right, they'll just print more" but that's why I led off discussing the rapidly diminishing returns of QE – we've been there and done that and we can't go back to the money-printing well – it's no longer effective and printing more money will simply render it less effective and THAT is how countries like Zimbabwe end up printing Trillion Dollar Bank Notes – it gets that ridiculous pretty quickly!
That's what's going wrong now around the World, long-term rates are suddenly ticking up as bond buyers have lost faith that the Central Banksters will be able to keep a lid on inflation. It doesn't matter how low the Central Banks set the rates if the actual people and institutions involved in the transactions refuse to lend at those rates. All it does is increase the level of wealth transfer from the bottom to the top (0.1%).
So that's what's keeping me bearish this week. Oil is still clinging to the last 150M barrels worth of fake, Fake, FAKE, orders at the NYMEX and the rest have been rolled (as we predicted) to longer months, in order to fake demand further down the line as they have faked demand for December deliveries until the last moment.
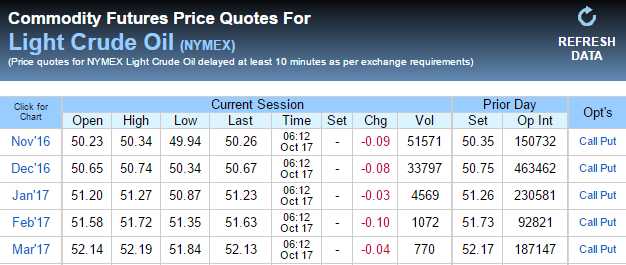 November contracts don't expire until Monday yet already – EXACTLY AS WE SAID THEY WOULD 10 DAYS AGO – the same 333,000 FAKE contracts have simply been moved to Dec (up 120,000, Jan (up 58,000) Feb (up 30,000), March (up 92,000) and longer months. As noted by Elaine, this happens ALL the time, so it's easy to bet on and this morning they have the nerve to have Oil Futures (/CL) at $50.50 so, of course, we're shorting it again.
We still haven't gotten a really big drop – our best call was our first one where we fell from $50.50 to $49.25 for a $1,250 per contract gain. The trick is to short each 0.50 and 0.00 line above $50.50 with 0.05 stops ($50 per contract losses) and ride out the gains, which usually come in $250 to $500 chunks ($50 is our primary goal) but, sometimes, nice bonuses like we had on the 7th.
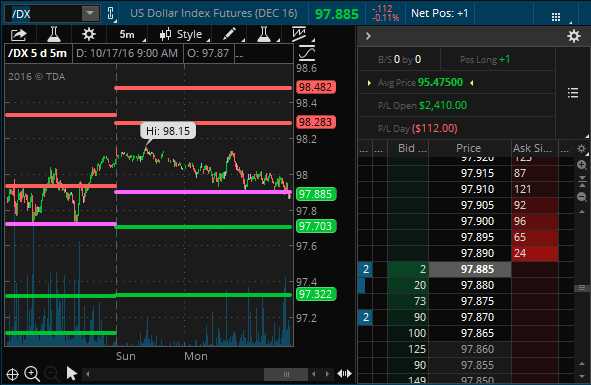 We had a rising Dollar helping us out earlier in the month and now it's at 98 so not as much upside (100 is our target) from here. Our Dollar Futures (/DX) are up $2,410 per contract (you're welcome) from our 95.47 entries. At our 100 goal, we should be well over $4,000 per contract so call that our goal, which means you can still make $1,600 per contract picking up our Members' table scraps if you want to play along (we already took some off the table at 98 on Friday and will be buying back in on a dip).
Anyway, getting back to oil – I'm not going to waste time making the same case over and over again. The demand is fake, the trading is fake, it's a gigantic scam but we can make money trading it nonetheless. As I often say to our Members, we don't care IF a game is rigged as long as we understand HOW it is rigged and are able to play along on the winning side.
 In the case of oil, however, I prefer to go with my Robin Hood tendencies and take the money from the manipulators by agreeing to sell them oil (as they pretend they wish it) at stupidly high prices and then when the price of oil falls – we buy our own to cover it and make a profit on the sale spread. Essentially, we trap the fake orders before they have a chance to cancel them and then it's just a waiting game as we get closer to expiration when the contract holders HAVE to take delivery of the oil they never really wanted.
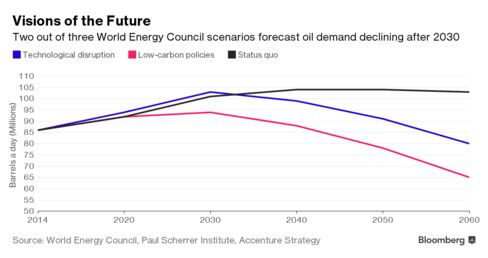 As noted in Bloomberg, what's really concerning OPEC is peak DEMAND for oil and the Paris Climate Accords, if President Trump fails to pull the US out of them, will cause global consumption of oil to drop off by 33% over the next 40 years – dropping almost 1% a year after flatlining for 10 years but that's assuming no major breakthroughs in alternate fuels.
That's going to strand hundreds of Billions of barrels of unwanted OPEC oil in the ground, a squandered resource and that's why none of them want to stop pumping and selling whatever they can at whatever price they can while they still can. THAT is the overriding driver of global oil prices and it's NOT going away. OPEC needs to agree to cut 1Mb/d EVERY YEAR to keep supply in-line with demand and again, that's a very conservative chart because a $7,500 Elio gets 89 miles a gallon and my 16-year old daughter and her friends want one for their first cars.
 You don't need electric cars to knock fuel consumption down 50% – you simply need cheaper, more efficient alternatives to the gas-guzzlers we have now. It is already mandated that the US fleet of new cars go from an average of 35Mpg now to 55Mpg by 2025 and that's less than 9 years away. That's another 1/3 cut in fuel consumption and those same cars will be sold in Europe and Asia and even in 3rd World countries – that's just the change we're already on track for in 10 years so, as I said, the WEC projections are very conservative.
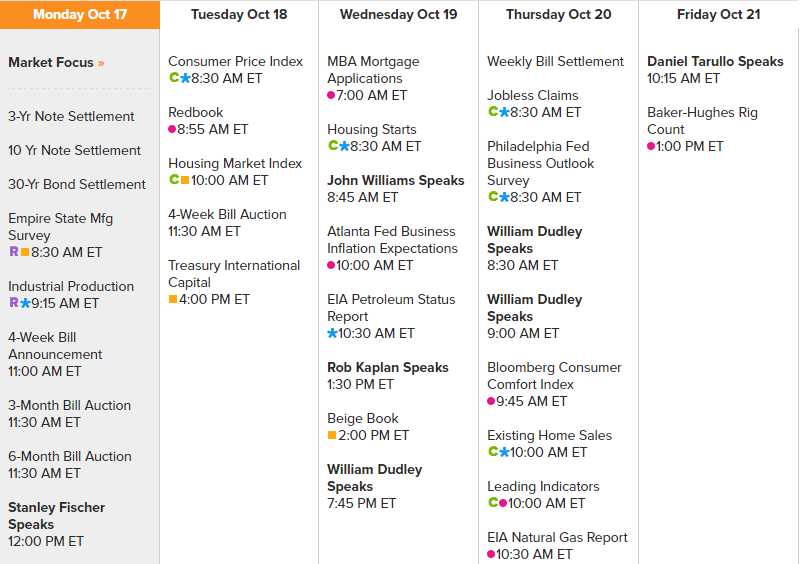
We have 7 Fed speakers this week but 4 of them are Dudley (dove). Fisher is a HAWK and leads things off at noon today. Williams is neutral, Kaplan is a dove, as is Dudley and Tarullo is a DOVE so we're book-ending the week with a major hawk and a major dove with not much else going on in-between.
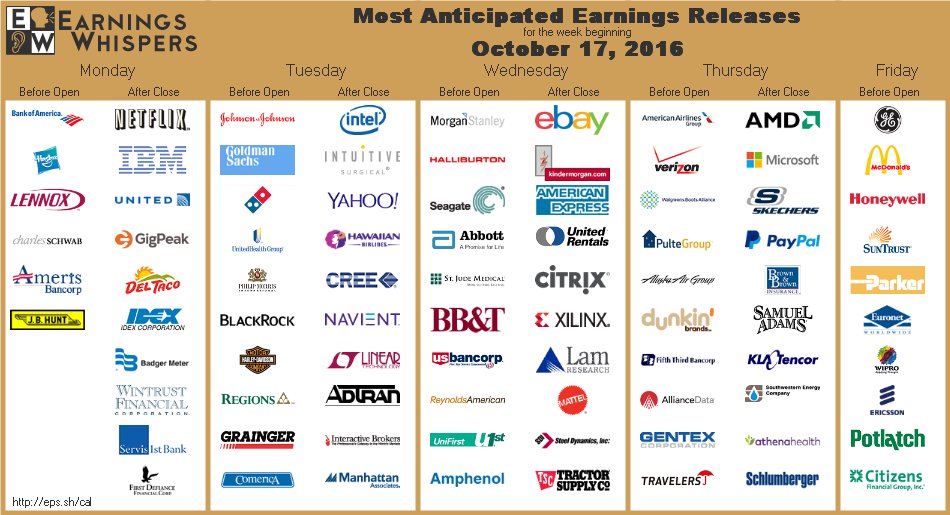
That then puts the emphasis on early earnings reports and we're not too optimistic but we'll keep and open mind and see how things unfold. After all, expectations are very low – so companies won't need to do very much to impress investors.
This being Monday (and only about 70 Mondays left before we stop working Mondays!), the volume will be low and they can pump the indexes up a bit (see early morning Member Chat for long lines) but watch out for Fisher into lunch. Empire State Manufacturing (-6.8 vs + 2 expected by leading economorons), Industrial Production (0.1% vs 0.2% expected) and prior revised down from -0.4% to -0.5% and Capacity Utilization (75.4% vs 75.6% expected) were all lame this morning but a hot CPI tomorrow (yes, it will be) forces the Fed's hand anyway so any rally this morning is nothing but another shorting opportunity at our bounce lines.
Be careful out there!