

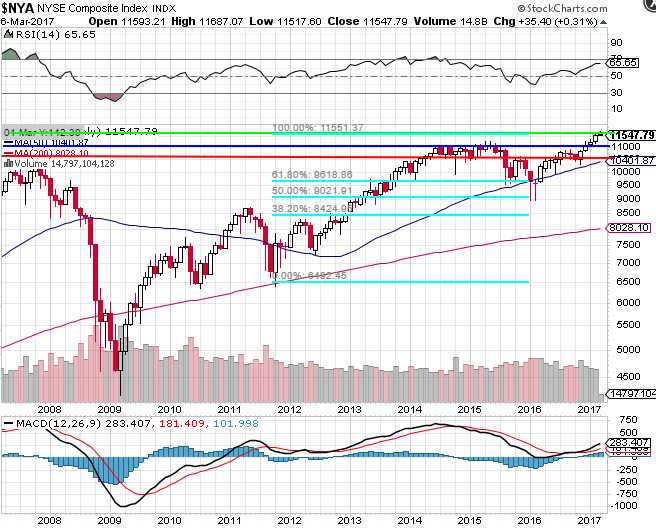 11,550.
That's the last 5% line on the Big Chart that will give us a sign that it's time to raise our Must Hold levels – raising the trading floor on the markets 10-15% (still TBD) to S&P 2,100ish. That would then become the bottom of our trading range and will influence where we begin to put our CASH!!! to work – at much higher levels.
As you can see from the chart, the NYSE (our broadest index and the hardest to manipulate) has been in a very tight range, between 9,500 and 11,000 since late 2013, which is when we drew up the lines on the Big Chart, predicting 11,000 would be fair value for our Must Hold floor by the end of 2014. Since then, though tempted, we have not had reason to change our market valuation and we do currently think the market is OVER-valued – so we've been reluctant to move the needle, even as the NYSE has punched over on the Trump Rally.
Those of you who follow PSW know that our Big Chart has been all green on the Must Hold lines for quite a while and the NYSE is the lagging indicator and EITHER it is going to start catching up and that will signal a broad-based, sustained bullish change in the markets or (more likely) it indicates that the Dow, S&P, Nasdaq and Russell are all easily manipulated and show a picture of a market that simply isn't reflected in the reality of the action of 2,800 stock NYSE, which trades twice as many shares per day (3.2Bn) as the Nasdaq (1.7Bn).
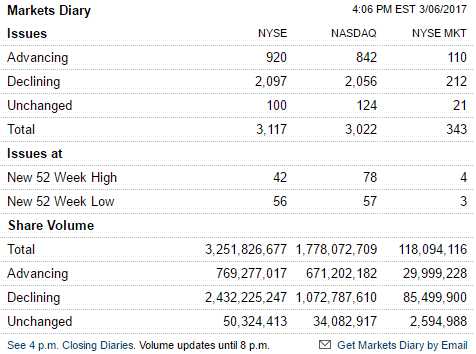 In fact, yesterday's action was a good example of how manipulated the market is as there were 2,100 declining stocks and only 920 advancing stocks and the declining volume was 2.4Bn while advancing was 769M yet the indexes were essentially flat. How is that possible? Because, in the junior indexes, there are certain key stocks like Apple (AAPL), for example, that have ridiculously outsized weighting and you can keep that one stock afloat while selling 100 others and you can still give the Nasdaq a positive spin on the day.
By buying the "right" 920 stocks that most affect the index market manipulators keep the indexes looking strong while actually selling most of the stocks in the index and that forces more ETF money to come in at the end of the day and buy up their crappy stocks.
That's the game and that's why it's called dumb money – the real reason Wall Street designed IRAs, 401Ks and ETFs was so they could take money right out of your paycheck and use it to buy stocks in a way that the people who understand the function and formula know EXACTLY what stocks will be bought and in what quantity every day. Think that gives them an advantage?
Here's a simple example of what I mean. Apple (AAPL) is 15% of the Nasdaq's value so a 10% rise in AAPL would move the Nasdaq up 1.5% – all else being equal. That means then, that a fund with a lot of Nasdaq stocks they want to get rid of can calculate how much ETF, IRA, 401K money is coming into the Nasdaq this week and match it to what they want to sell of anything but AAPL and then they can sell 99 stocks while offsetting it with buys on the one stock.
Since AAPL keeps the Nasdaq at the same price, the Dumb Money the flows in then buys all 100 stocks in the same proportions – effectively taking the fund's 99 stocks off their hands at full price while the Fund cashes out their holdings. The Dumb Money investors have no idea the Smart Money is pulling out because the index doesn't show any strain so they keep pouring it in and that's the tremendous value of manipulating the indexes.
AAPL is also on the Dow and the Dow is price-weighted so the more expensive stocks move the index more than the cheap stocks (yes, it's very stupid, which is why we generally ignore the Dow). A $1 move in a Dow component is generally 8.5 points for the index and again, AAPL is the leader of the Dow, moving up 18% ($25) in 2017 so far, followed by Boeing (BA) at14%,($25), IBM (IBM) at 9% ($14) and Home Depot (HD) at 9% ($13). Those 4 stocks alone added $77 or 654 points to the Dow or more than half of the indexes 1,150-point rally.
When you can move a whole index with just 4 stocks – you can manipulate the markets. After that, all it takes is money and a lack of morals – essentially the prerequisites for Wall Street Banksters. "Making" the Dow index move up 5% MAKES the dumb money buy all the components, proportionately, for +5% so, if you buy those components first and THEN buy the 4 index-movers, you guarantee not only your profit on the other 26 stocks but you also guarantee your buyers as the IRA, 401K and ETF people are forced to buy the whole index – not just the best stocks and you get to dump your overpriced shares right in their laps in exchange for their hard-earned CASH!!!
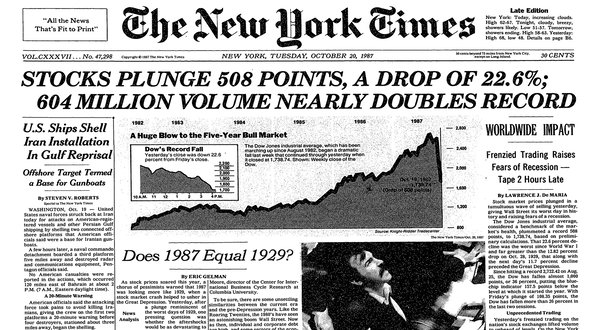
In one day the market plunged 22.6% and, very suddenly, investors found out what all those shares they had been buying were really worth. The good news is, they were worth about 25% of the top and, less than two years later, the market was back at the highs but it REALLY sucks to get caught in one of those corrections. It's not just about waiting to get your money back – it's about foregoing two years of trading profits while you wait!
I discussed our overall hedging strategy yesterday morning at the Nasdaq and yesterday, in our Live Member Chat Room, we reviewed the hedges in our Short-Term Portfolio, which are pretty aggressive into the Fed (see Friday Morning's Report for a hedging idea using TZA and GILD) next week.
Aside from the NYSE, 21,120 is the 20% line on the Dow. That's 20% over our Must Hold and generally our trading ranges are 20% wide so, logically, even if we think this is toppy, we can still move the bands up 10% (making 19,360 the Must Hold line) and that would just put 21,120 at the top of our expected range for the year – which it is. The real question is whether or not then, we believe 19,360 is a strong floor and, as you can see – we didn't spend enough time there to really find out. We punched right through it in Early December and never looked back but that, in itself, is a sign of strength.

The purpose of the Must Hold lines is to tell us when to flip bearish. A 10% market correction would not make us become bearish – at this point, it would simply be a healthy correction we'd be happy to ride out. Should, for example, 1,200 fail on the Russell (down 13%), however, THEN we would become fairly bearish and begin looking for another 7% downside from there (1,100ish). That's why we have been so slow to change the Big Chart – it's certainly not unrealistic that the Russell can fall 13% and the NYSE can EASILY topple 5% and those are our two broadest market indexes.
We're not out of the woods yet!