

 Behold the Big Chart!
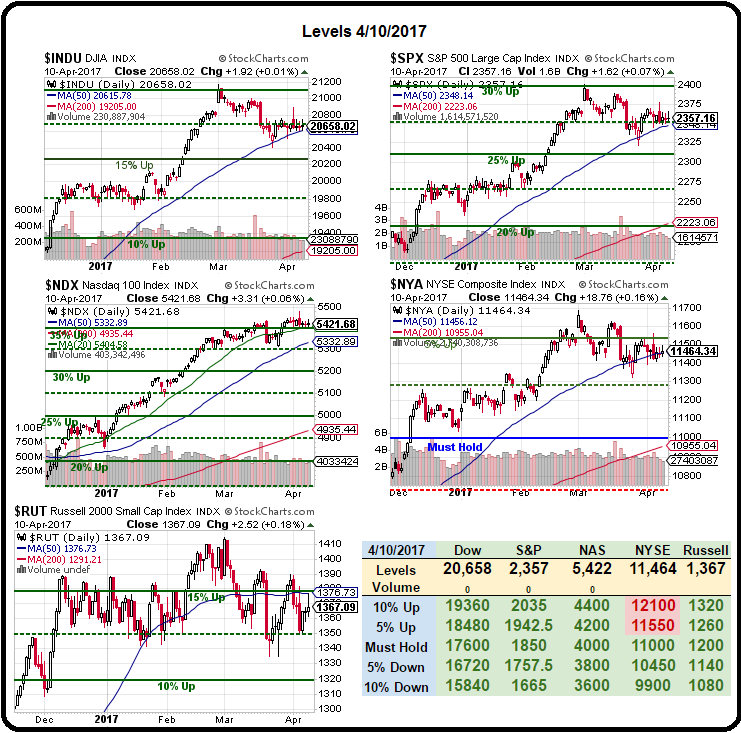
Those lines you see are our 5% Rule™ illustrated on the charts (thanks StJ!) and the little chart on the right is showing us that the NYSE is our last hold-out which is keeping us from raising our targets on the rest by about 10%, though that would still be below the 15-30% gains we are seeing on the indexes over our old fair value lines.
These are still the same lines we were using in 2013 to predict where we'd be in 2015 and we nailed those but, since then (end of 2015), we haven't had a good enough reason to raise the bar. I do not expect the Nasdaq (QQQ) to fall 30%, back to 4,000 but half the move is Apple (AAPL) so I kind of ignore them. It's the NYSE that's bothering me the most as they can't close the deal on a 5% gain and the Russell flat-out failed their 15% line, which is also the 50 DMA at 1,380 so VERY SIGNIFICANT and a great shorting line in the Futures (/TF).
 Remember, we are Fundamental investors. We don't care what the PRICE of stocks are, we care what the VALUE of stocks is and will be. As you can see from the EPS and GDP chart – the S&P has completely disconnected with reality and a solid 5% ahead of where it should be – unless earnings give us some sort of upside surprise.
Investors are simply not smart shoppers. They decide to buy a stock and then they look at a list and pick one. When the prices are high it's like going to a bad restaurant and having to pick SOMETHING from the menu or, more to the point, it's like a ski shop I was in at Aspen which had nothing but $2,000+ jackets and there was no way I would pay $2,000 for a jacket but a woman in a mink coat waltzed in, grabbed 5 jackets in short order, paid and left.
Could she have saved a few thousand Dollars by doing even the tiniest bit of shopping around? Absolutely. Could she have saved 50-70% off by waiting until April? Again, yes she could have. But she didn't. My theory is she was a stepmother who would not be seen with children who had ratty jackets but, whatever the case, she waltzed in an paid a huge premium for something she easily could have gotten cheaper. That goes on in the market all the time.
 Check out this chart that shows how many hours the average American has to work to buy the S&P 500 ($2,350 per share). It's up over 100 hours for the first time since late 1999 – just before the market spectacularly collapsed. If the average American can no longer afford to buy a stock, you run out of bag-holders very quickly and there's only so many $2,000 jacket-buyers in this World – we're on the edge of a cliff yet no one seems to see it.
The markets are sort of on hold at the moment, ahead of TOMORROW's (not Friday, we're closed) earnings reports from Citigroup (C), Commerce (CBSH), First Horizon (FHN), First Republic (FRC), Infosys (INFY), JP Morgan (JPM), PacWest (PACW), PNC (PNC), Taiwan Semi (TSM) and Wells Fargo (WFC). Usually we do this on Friday but Friday is Good Friday so the markets are closed.
We're also getting Michigan Consumer Sentiment, Producer Prices, Consumer Prices and Retail Sales – all ahead of the bell tomorrow so expect not much to happen to day and maybe a lot tomorrow.
We have a Live Trading Webinar at 1pm, EST and you can sign up here. Last week we made thousands on our Futures trades and who knows what will catch our eye in the afternoon.
We also have our Q1 Portfolio Review up for your reading pleasure!