
Here we go again:
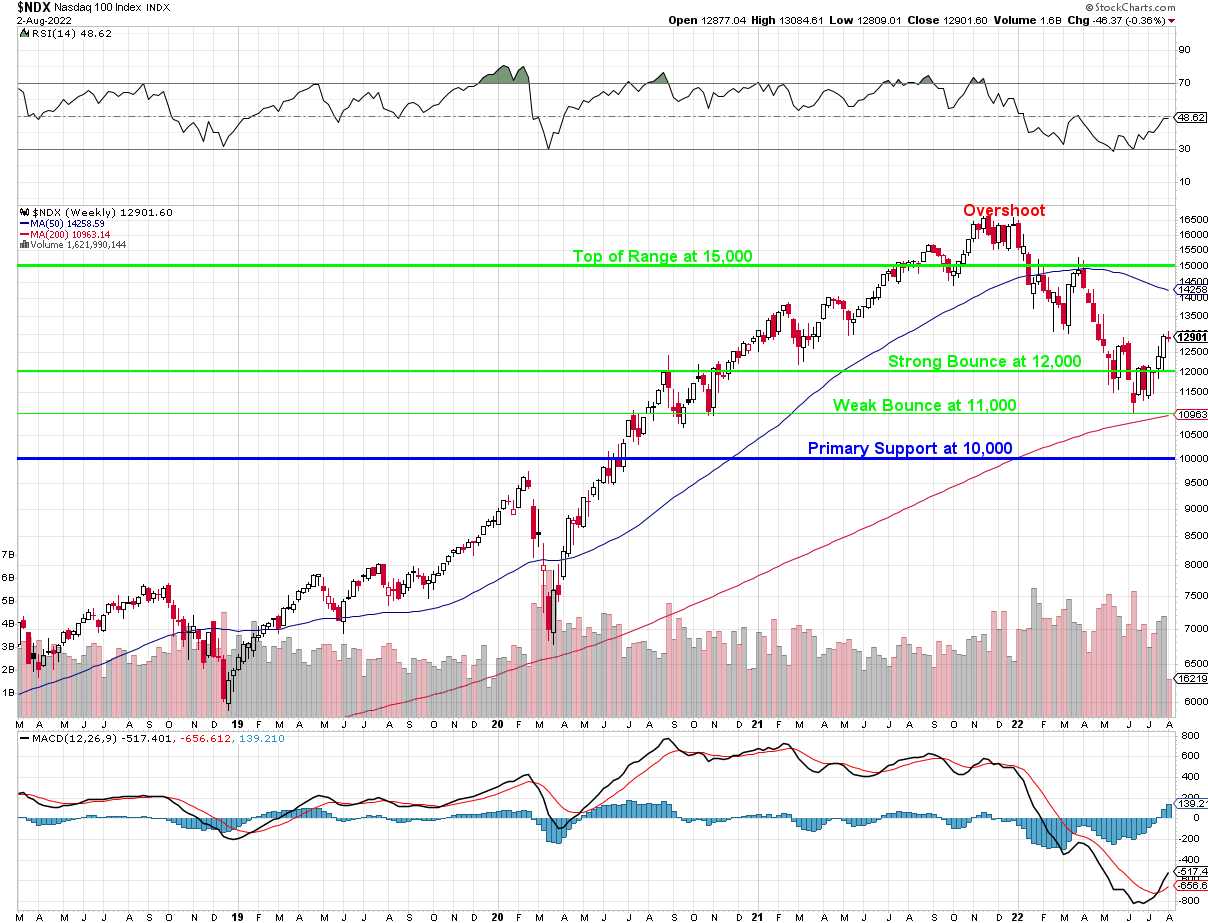
Say after me, w-W-Weekly Chart – each candle is a week and that rising red line is the 200 WEEK Moving Average (1,400 days) and the blue line is the 50 WEEK Moving Average (350 days) which is about the same as the 200-Day Moving Average since it does not count weekends. In fact, on the Daily NDX chart, the 200 DMA is at 14,141 – just a bit lower than 14,250 above but it’s FLAT and the 50 DMA is RISING, at 12,082:
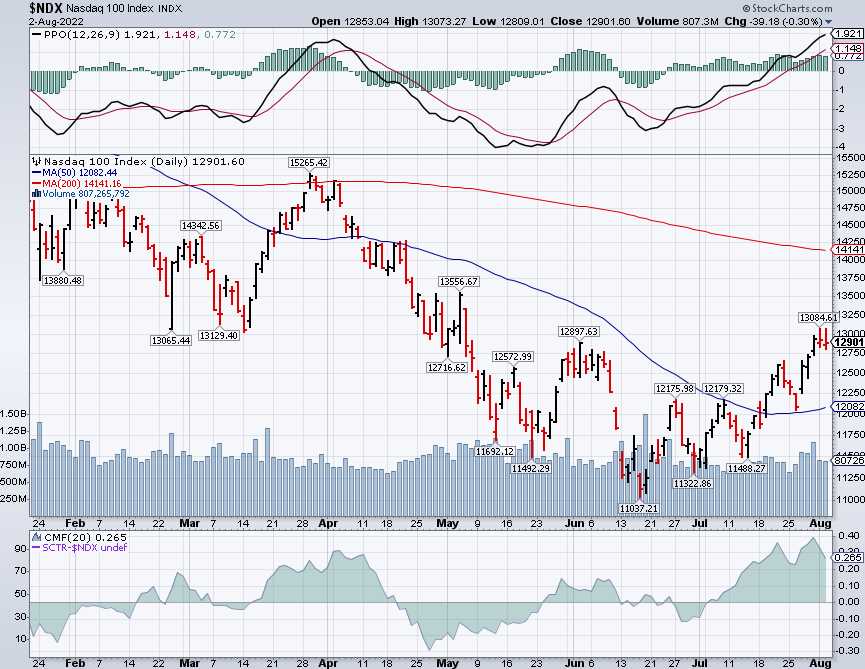
We have a bit of short-term exhaustion but most of the Nasdaq (from a market cap perspective) has reported and it’s unlikely that the rest will shift the momentum lower so the positive tailwind provided by the MACD on the weekly chart along with that rising 50-Day Moving Average and the rising 200-Day Moving Average should be enough to keep us moving back over 13,000 towards our 14,000 goal by September, which is what we predicted in June so everything is “on track” at the halfway point.
Of course, our predictions were based on what we considered the fair value for the trading range we’d fall into and, using our 5% Rule™, we simply chose the range that fit, which was from the Strong Bounce Line at 12,000 to the Top of our Range at 15,000 – though we didn’t think we’d see 15,000 again for a while as the market adjusts to higher rates (the rest of the crap was pretty much factored in by June).
That doesn’t mean we get complacent – if new data comes in that’s outside of our model – we’ll have to make adjustments but, so far, earnings were just what we expected, so we’re THRILLED with our positions.
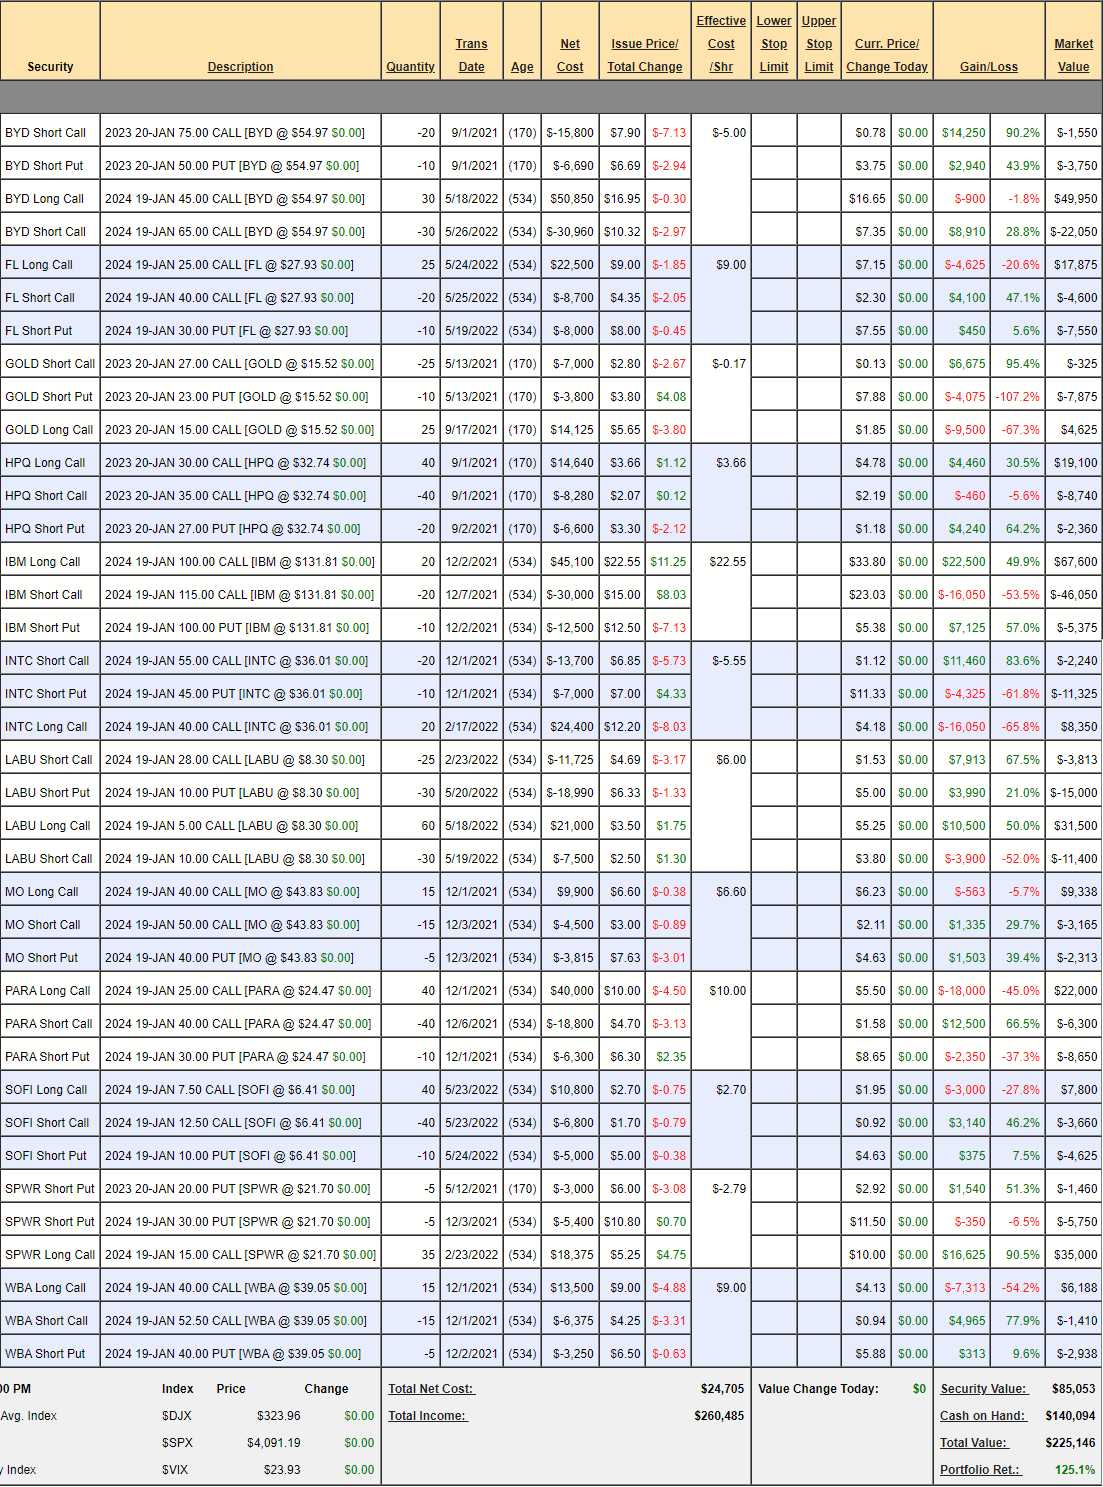
We reviewed our Money Talk Portfolio on July 13th and it was at $194,331 at the time and now, less than a month later, those untouched positions are at $225,146 – up $30,815 (31.7%) – not bad for a month’s “work”. Overall, the portfolio is up 125.1% from our 11/13/19 inception date:
After making our BRILLIANTLY AGGRESSIVE suggested adjustments and adding our new trade ideas for LOGI and JPM, the portfolio looks like this:
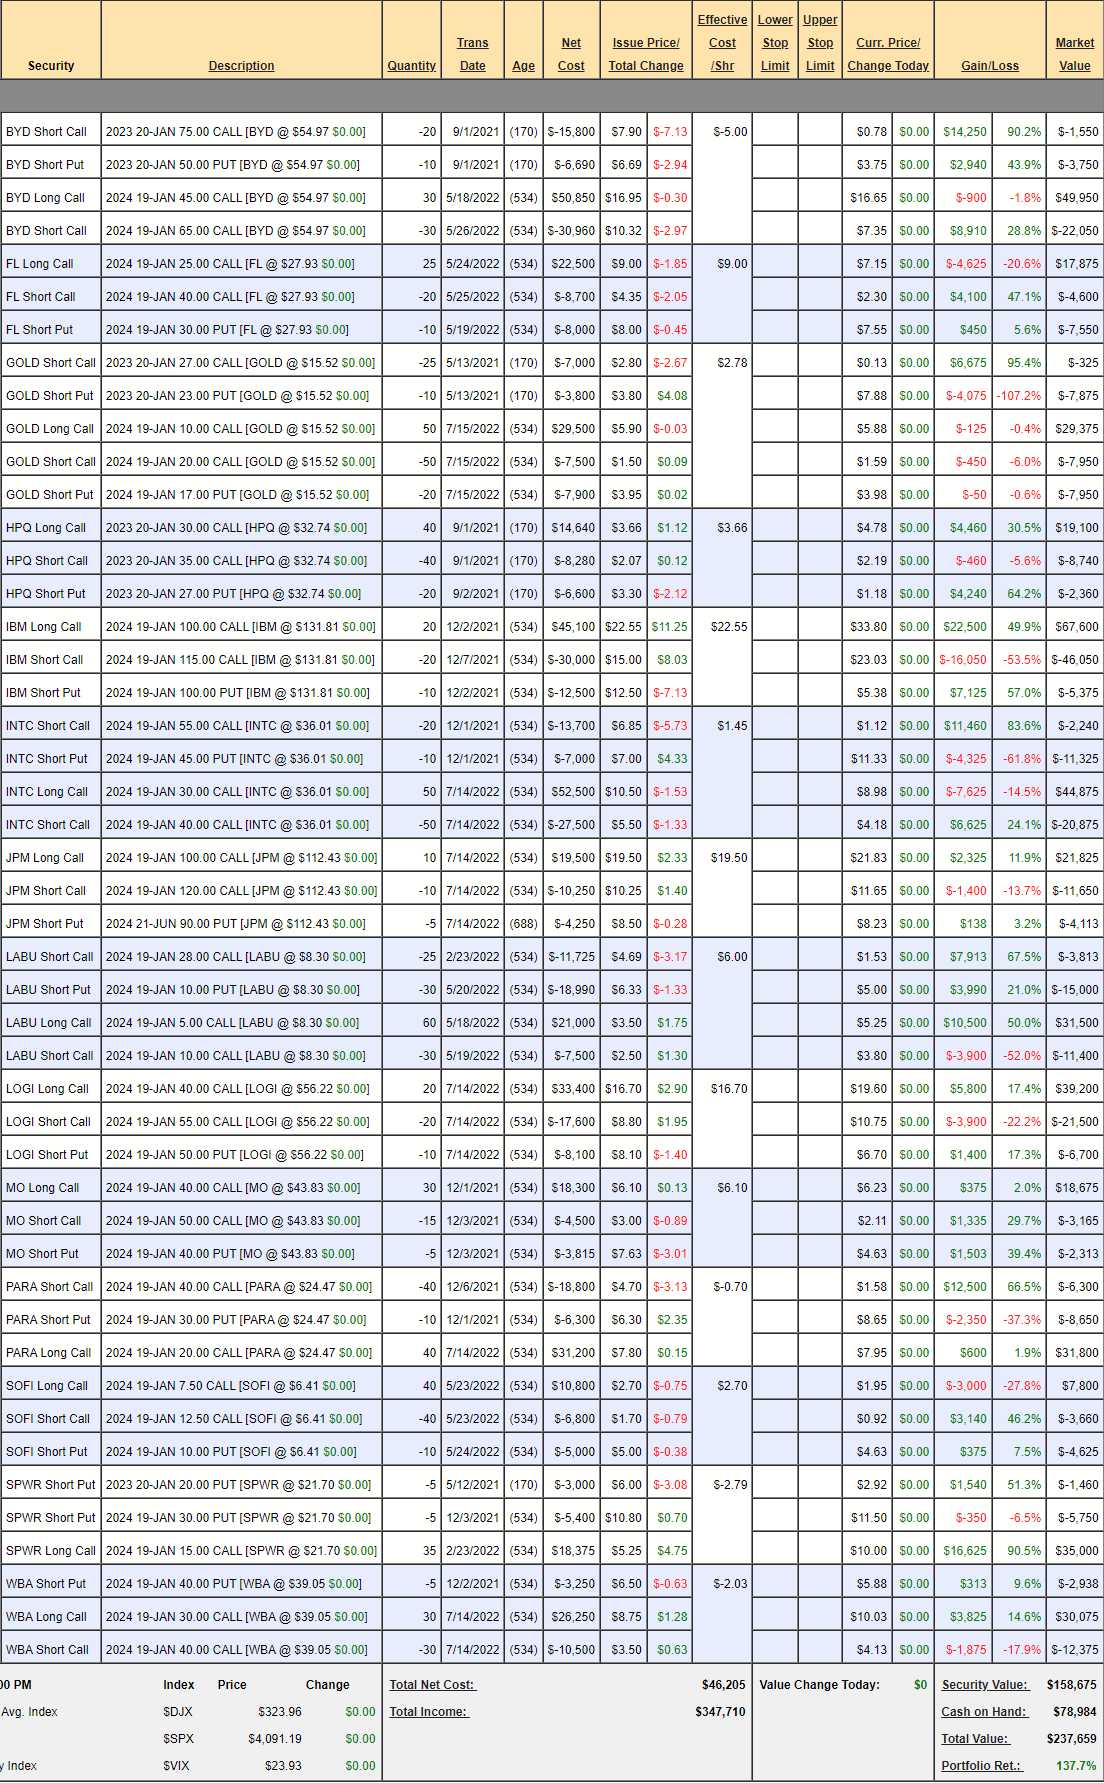
The success of our new trades and adjustments made a $12,000 difference and that’s all on-track as the current positions had $263,208 (135%) of upside potential as of the review and we added JPM with $13,875 potential and LOGI with $22,500 potential so the upside potential as of July 13th was $299,583 through Jan, 2024, which is 14 months so we’re SUPPOSED to make $21,399 per month and we made $43,328 in a month where we called the turn perfectly.
As I was saying to Mitch in yesterday’s chat room – “Plan the Trade and Trade the Plan” – each of our positions has a defined goal of how much money it will make and we monitor them each month to make sure they are on track and, if not, we adjust them if it’s appropriate.
Our rule of thumb is to do something if we are 2 deviations off track so, this month, we are one deviation ahead – we expected $21,399 and got $43,328 but next month, if we get $0 – we are simply back on track, right? It is just as bad to be off track to the top as it is to the bottom – that’s why we hedge. BUT, in the Money Talk Portfolio, we can only trade when we’re on the show, each quarter – so we tend to steer our errors to the upside when possible.
As noted in the charts above, we’re back in the range we expected and, as long as that range behaves itself – time will be on our side for the rest so NO SUDDEN MOVEMENTS – please…


")

