

Reminder: Sabrient is available to chat with Members, comments are found below each post.
Courtesy of Ron Rutherford, Sabrient Systems and Gradient Analytics
The most recent ISM manufacturing report has left much to be pessimistic about, not that the markets or the media seemed to notice.
First, the headline PMI dropped below 50 (marginally to 49.7) with a drop of 3.8, indicating contraction in the manufacturing sector for the first time since July 2009. It also missed the consensus by 2.3 and was outside the consensus range from Econoday.
Second, new orders dropped a surprising -12.3% to end also up in negative territory at 47.8%.
Third, exports also dropped into negative territory by 6% to 47.5%. This is troubling as it was one possible avenue for increased aggregate demand, although it was expected because of the weakness in China and the financial crisis in Europe.
Fourthly, the most important indicators showed weakness in production, down 4.6% to 51%; employment, down slightly to 56.6%; inventories, down 2% to 44%; and a backlog of orders, down 2.5% to 44.5%.
Lastly, even the price index's fall is not much solace considering its dramatic drop of 10.5% to a low of 37%. This was the lowest reading since April 2009 when the reading was 32%. The most recent high was February 2012 at a high of 61.5% which signifies a drop in the index of 24.5% over a 5-month period. Price volatility of inputs creates even more uncertainty in various markets.
Price drops could indicate overall weakness in the aggregate demand functions, actually leading to decreases in input demands, and making long term planning for commodities and extraction businesses more difficult. And, of course, this all could increase the likelihood that deflation will appear soon. The only commodities going up in price are Natural Gas and Guar (gum), but commodities with dropping prices numbered 14. This lop-sided skewness of the numbers is also evident in the percentage of respondents reporting higher versus lower prices, at 7% and 33% respectively. Normally, it would be tilted more toward rising prices to reflect the base-line inflation levels.
All this could be just an anomaly, especially the drop in new orders, but Markit's PMI and the ISM non-manufacturing report (NMI) both showed a downward trend in business activity that is and soon will be approaching the contraction/expansion inflection point of 50. The PMI slid 1.5% to 52.5%, and NMI dropped 1.6% to 52.1%, which was below the consensus of 53% but within the consensus range of 51.5-54%. Other sub-indexes in the Markit report also showed considerable weakness. Input prices dropped for the first time since June 2009 by 7 points to 48.8%. New export orders also showed change in direction to contraction with a drop of 2.2% to 48.3%. Declines were noted in employment of -1.5% to 52.8% and new orders of -0.9% to 53.7% and output of -1.1% to 53.4%. The analysis was upbeat about easing in inflationary pressures and considered this a signal for the Fed and central banks to increase policy stimulus. That is the signal, but the US and the world need help now – and not the slow moving tools of central banks that take up to 18 months for most of the effects to take hold.
The ISM non-manufacturing report confirmed what the other two reports showed: new export orders contracted -3.5% to 49.5%; new orders fell-2.2% to 53.3%; business activity was down -3.9% to 51.7%; and prices were down -0.9% to 48.9%. The only bright spot in the reports was that employment in the services sectors showed some strength by gaining +1.5% to 52.3%, thus bucking the downward trend since January 2012's high of 57.4%. Good, but not nearly good enough to cure our unemployment malaise. Below is the non-manufacturing unemployment index since December 2009. (Click to enlarge images.)

Are these the Signs of a Recession?
It appears safe to say from this datum that there is little to no chance of inflation taking hold soon, but it does appear that there are possibilities of another recession or even deflation. Mish confirms some of the pessimism in this post but doesn't think that we should take the drop in the ISM as the definitive sign of a coming recession
(Mish's Global Economic Trend Analysis: US Manufacturing ISM Contracts for First Time in Three Years; New Orders and Prices Plunge; Perfect Miss: 0 of 70 Economists Polled By Bloomberg Expected Contraction). Below is a copy of the chart that shows the ISM falsely predicted a recession six times and failed to predict a recession four times based on the most recent PMI release percentage.
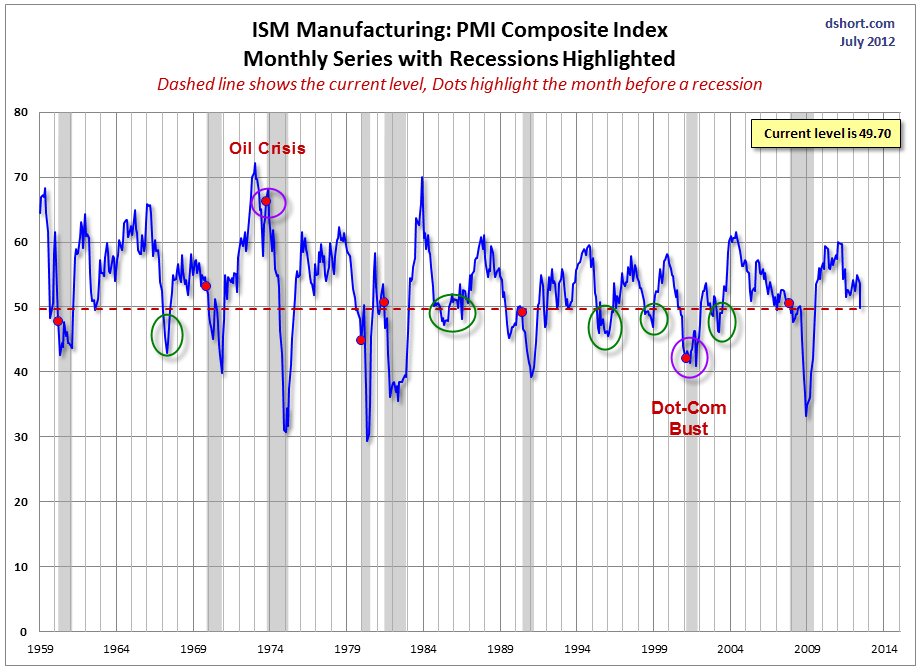
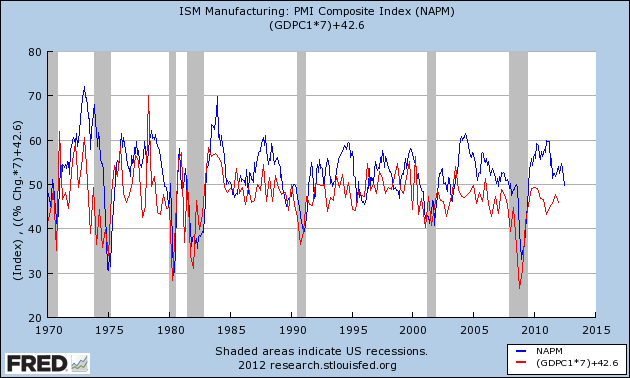
Even though the 50 mark signifies the break even point between expansion or contraction for the manufacturing economy, the reports states that "A PMI in excess of 42.6%, over a period of time, generally shows an expansion of the overall economy." Supposedly, the current level of the PMI at 49.7% corresponds to a 2.4% rate of real GDP growth. For most of this recession, these rates of GDP growth have been widely overstated. The chart below shows a rough approximation of the correlation between the real rate of growth of the GDP and the PMI index levels. Without further statistical analysis, it looks like, since the most recent recession, that the degree of differences is greater than would be expected. Thus, the ISM would be over-predicting the rate of growth of the GDP for this decade and especially since 2010.
Stock picks of Lovers and Haters based on ISM business reports
This month, like normal, I changed part of the algorithm in an effort to explore different combinations of factors and to overcome any biases in the data. This time I used the Fama-French three factor model along with four additional factors. The independent variables were PMI, a modified NMI based on the four subindexes used before, and the inflation indexes from both reports. Selection of stocks was based on R square and the highest absolute coefficient was used to determine whether the stock selection was a Hater with a negative coefficient or a Lover with a strong positive coefficient. Lovers refer to stocks that statistically perform well when the independent indicators are rising and haters refer to stocks that statistically perform well when the independent indicators are going down. Presumably because of the changes, the backtest results also changed. Both portfolios surpassed the flat weighted S&P 1500 index, which was the universe of stocks these portfolios were selected from, by 2% for the Lovers and around 0.5% for the Haters (annualized rates since August 2000). Both sets are long portfolios and are not suitable for shorting. Below are some of the results grouped by Lovers and Haters with their respective ratings from Sabrient Systems.
Lovers:
Ford Motor Company (F) STRONGBUY
Henry Schein, Inc. (HSIC) STRONGBUY
Commercial Metals Company (CMC) BUY
Cash America International, Inc. (CSH) BUY
Discover Financial Services (DFS) BUY
Dycom Industries, Inc. (DY) BUY
F5 Networks, Inc. (FFIV) BUY
Life Technologies Corporation (LIFE) BUY
NewMarket Corporation (NEU) BUY
World Acceptance Corporation (WRLD) BUY
Wynn Resorts, Limited (WYNN) BUY
Haters:
Chesapeake Energy Corporation (CHK) STRONGBUY
Macy's, Inc. (M) STRONGBUY
United Therapeutics Corporation (UTHR) STRONGBUY
Valassis Communications, Inc. (VCI)STRONGBUY
Valero Energy Corporation (VLO) STRONGBUY
American Public Education, Inc. (APEI) BUY
CoreLogic, Inc. (CLGX) BUY
FARO Technologies, Inc. (FARO) BUY
First Horizon National Corporation (FHN) BUY
Genworth Financial, Inc. (GNW) BUY
Myers Industries, Inc. (MYE) BUY
National Penn Bancshares, Inc. (NPBC) BUY
Protective Life Corporation (PL) BUY
United Fire Group, Inc., (UFCS) BUY
USA Mobility, Inc. (USMO) BUY
Disclaimer: This article is published solely for informational purposes and is not to be construed as advice or a recommendation to specific individuals. Individuals should take into account their personal financial circumstances in acting on any rankings or stock selections provided by Sabrient. Sabrient makes no representations that the techniques used in its rankings or selections will result in or guarantee profits in trading. Trading involves risk, including possible loss of principal and other losses, and past performance is no indication of future results.
Disclosure: I have no positions in any stocks mentioned, and no plans to initiate any positions within the next 72 hours.