

 Look at this!
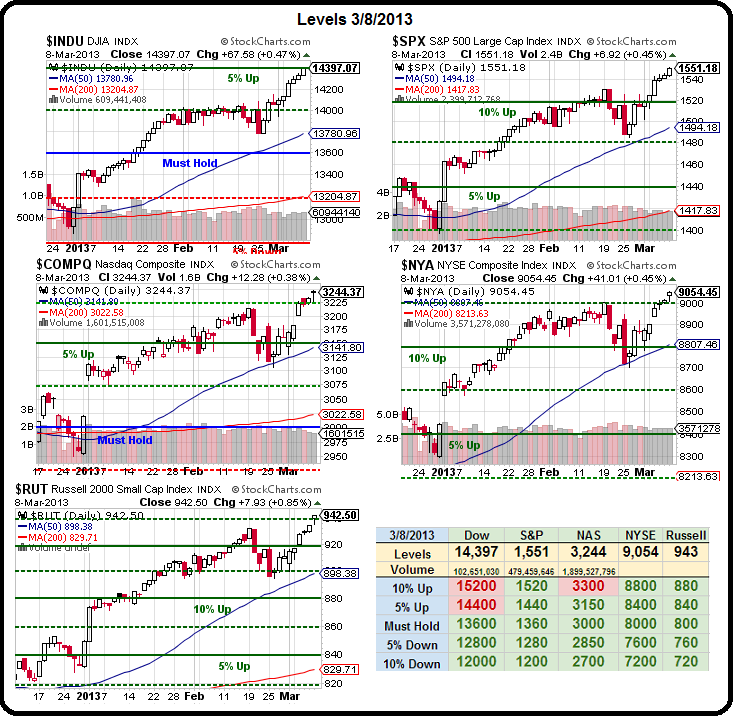
Our Big chart covers a 3-month period and our first quarter is already winding down and look how ridiculously UP it has been so far. First it went up, then it went up some more, then we paused in February and then we went up and up again so far in March. For the bears, this is like looking at a roulette wheel that has come up black 6 times in a row and they bet red because it HAS to go red sooner or later.
That's called the "gambler's fallacy," the belief that if deviations from expected behaviour are observed in repeated independent trials of some random process, future deviations in the opposite direction are then more likely.
The reality is, in a random outcome (which the stock market generally is on a short-term basis), the odds of any single day or week being up or down are going to be 50:50, irregardless of what happened the week or weeks or months or years before.
 But, even worse for the bears, the market is not completely random. It can be affected by outside factors. In this particular case, we have the Fed pouring $85Bn a month into the economy and that drives a demand for equities and rates are low so bonds are out of favor (driving a demand for equities) and the Global Economic Outlook is iffy so commodities are not strong (driving the demand for equities) and neither Asia nor Europe look as strong as the US (driving the demand for US equities – especially the Russell, which does less business with Europe and Asia).
So, rather than a roulette wheel, what the bears are doing is watching a pool fill up with water and the Fed has an $85Bn hose feeding it and bonds are transferring to stocks for another $11Bn a month and money is moving from commodities to stocks at about $3Bn a month and more people are working and 401K money is pouring in and sideline money is pouring in and corporations are buying back their own stocks… Well, you get the picture.
 The bears are standing around the pool and watching the water rise and essentially betting it will start to sink – simply because it's risen a lot recently. If YOU were betting water in a pool would stop rising then you'd probably want a better premise than "just because" so you'd ask: "Did someone turn off the hose?" And, even if someone DID turn off the hose – that's not enough to then drain the pool is it? No, you have to suppose there is a leak somewhere, right?
And you can see the bears desperately looking for leaks. They cry LEAK! every chance they get, don't they? The fact of the matter is the leaks are in no way big enough to counter-balance the MASSIVE amount of cash that is filling our market pool. Waves in the water may cause the levels to rise and fall slightly at any given moment and the more people getting in and out of the water – the harder it is to tell what the steady state is (and that's what the Big Chart is designed to measure!) but reacting to the short-term up and down movements at the edge of the pool to make bets on which way the water is going is MADNESS!
 We remain fundamentally bullish until we see clear evidence that macro factors are changing. The major assumption made by the bears that may turn out to be false (and we'll find our in April), is that the market pool can't hold more cash/water than it's holding now.
If we consider that we were already at these levels(ish) in 2007 and we factor in 6 years of inflation, even at the Fed's 2% annual claim – that's still room for 12.62% more at the top than we had then. If you start to assume we also build a few bricks to support a bigger economy (and market that measures it), then 20% would not be out of the question.
This is not to say we expect to go straight up 20%. In fact, we shifted to a more market-neutral stance last week as we headed for the final test of our current Big Chart levels and we've got some juicy short plays lined up if our own technical indicators break – BUT – we are determined to keep an open mind about it and, if we get past our EXPECTED pullback into the close of this week and into the end of the month, we will likely be very bullish again as we head back into earnings – especially with the signs we're getting from real estate.
 As we calculated last Thursday, when we analyzed the Dow components to see how much room they had left to rally, 12.62% is certainly within reach but we'd need some solid evidence from April earnings before we are able to believe that 20% is doable (and we missed our long predicted Dow target for Friday of 14,400 by 3 points, thank you very much!). Still, 12.62% over the current 1,550 level on the S&P takes us all the way to 1,745 – that's a long way up from here, isn't it?
As Barry Ritholtz pointed out this weekend, this rally, though impressive, of S&P 676 to 1,541 (as of March 6th) is "only" up 127% while in August 1982, the S&P was at 102.42 and rose to 336.77 5 years later (up 228%) and then we had a pullback to 223.92 on Dec 4th of 1987 (down 33.5%) but THEN we took off again and flew to 1,527.45 on March 24th of 2000 – up a very nice 582% on that 12-year leg of the rally.
I'm very sure that at 336.77 in April of 1990, the bears were saying it would all end in tears and we did, in fact, fall back to 300 – down about 10% – but then we went up, and up some more, and up some more and up even more and then, in 1995, with the S&P at 450 – we REALLY started to move, tripling over the next 5 years. If the conditions were ever ripe for another "rally of the Century" – these are them. Can Europe get worse? Can Japan get worse? Really, only if you believe debt matters and, CLEARLY, it has been demonstrated that – over the short run – it does not.
Over the long run, as Keynes reminds us – we're all dead anyway – so let's try to enjoy the ride while we can…