

.jpg) Oh Trump, you crazy bastard!
Oh Trump, you crazy bastard!
"Trump Threatens Iran in Tweet, Warning of Dire ‘Consequences’" is the headline in the Wall Street Journal this morning. Apparently (and we don't know for sure what's in this guy's head, which is attached to the arm that's got a finger on the button), Trump was "responding" to a speech by Rouhani over the weekend that was the usual rhetoric in which Iran's President said:
"Peace with Iran would be the mother of all peace and war with Iran would be the mother of all wars"
I guess we now know which path our President is going to choose! Of course oil prices flew back up to $69 a barrel from lows of $65 last week after Trump announced he may open up the Strategic Petroluem Reserve to keep prices low. People who have foreknowledge of Trump's announcements could make Billions of Dollars betting on the price swings very much the way Vladimir Putin and his Russian cronies did when they manipulated oil prices. I wonder where Trump would have gotten that idea?
Mr. Trump’s warning to Iran came hours after a speech by Secretary of State Mike Pompeo that was harshly critical of Iran’s leadership. Mr. Pompeo accused Iran’s leadership of widespread corruption at the expense of its citizens’ welfare. “Governments around the world worry that confronting the Islamic Republic harms the cause of moderates, but these so-called moderates within the regime are still violent Islamic revolutionaries with an anti-America, anti-West agenda.”
Well, if they didn't have one before, they sure have one now, especially after Trump unilaterally withdrew from the Iran Nuclear Treaty of 2015 that was negotiated over many years by Obama and Trump is not only imposing sacntions against Iran for no apparent reason but is also trying to force our allies to go along with the sancitions. These are all moves that have driven the price of oil from $45 to 75 (66.6%) since Trump has been in office – maybe that's a sign?
It's certainly a sign for the average American who has to fill up his gas tank as every $10 rise in oil (22%) is a $200M/day tax on the American people so we're now talking $500M/day, $3.5Bn/week, $15Bn/month, $180Bn/year – more than the entirety of the Tax Break that trickled its way down to the lower class (cut-off is $126,000 year in family income just to make Middle Class – IF you live in a cheap part of the country – on the coasts it's more like $188,000).
Of course, you can always "fake it 'till you make it" and that's what most of the consumers are doing as politicians tell them how GREAT things are and how they're going to get GREATER is we stay the course. It's the Bottom 60% consumers that have fueled this growth cycle while the Top 40% has been cutting their bills down. Filtering data on household finances and wages by income brackets, the Reuters analysis reveals growing financial stress among lower-income households even as their contribution to consumption and the broad economy grows.
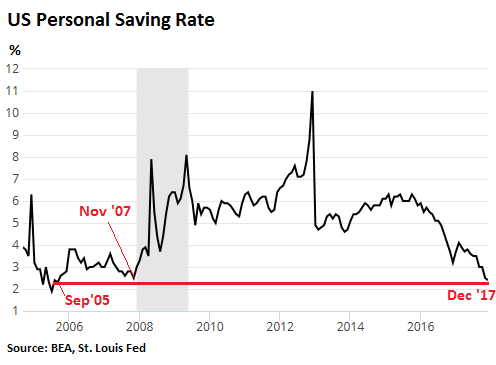 The data shows the rise in median expenditures has outpaced before-tax income for the lower 40 percent of earners in the five years to mid-2017 while the upper half has increased its financial cushion, deepening income disparities. Over the past year signs of financial fragility for the bottom 60% have been multiplying, with credit card and auto loan delinquencies on the rise and savings plumbing their lowest since 2005.
Stephen Gallagher, economist at Societe Generale, says stretched finances of those in the middle dimmed the economy’s otherwise positive outlook. “They are taking on debt that they can’t repay. A drop in savings and rise in delinquencies means you can’t support the (overall) spending,” he said. An oil or trade shock could lead to “a rather dramatic scaling back of consumption,” he added.
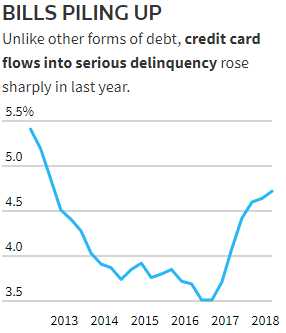 Economists say one symptom of financial strain was last year’s spike in serious delinquencies on U.S. credit card debt, which many poorer households use as a stop-gap measure. The $815-billion market is not big enough to rattle Wall Street, but could be an early sign of stress that might spread to other debt as the Fed continues its gradual policy tightening. More borrowers have also been falling behind on auto loans, which helped bring leverage on non-mortgage household debt to a record high in the first quarter of this year.
As I noted when we reviewed the Beige Book in last Wednesday's Live Trading Webinar, these are not the kind of reports you expect to be reading while being asked to pay record-high multiples for stocks. Everything should be AWESOME and, even then, you should be a little cautious – just in case things stop being awesome down the road but, other than for the Top 10%, things are not that awesome in America and, for the bottom 60% – they are downright terrible.
So we don't expect $69 oil to last and shorting /CL with tights stops above is a good play, as is shorting Gasoline (/RB) at the $2.10 line – also with tight stops above.
This week's Economic Calendar will give us a first look at Q2 GDP, which seems to me like it will miss 4% but we'll get a clue on that from the Chicago Fed this morning and Durable Goods on Wednesday, which better be up 3% or there's no way we make a 4% gain in GDP!
| TIME (ET) | REPORT | PERIOD | ACTUAL |
MEDIAN FORECAST |
PREVIOUS |
|---|---|---|---|---|---|
| MONDAY, JULY 23 | |||||
| 8:30 am | Chicago Fed national activity index | June | 0.43 | — | -0.45 |
| 10 am | Existing home sales | June | 5.45 mln | 5.43 mln | |
| TUESDAY, JULY 24 | |||||
| 9:45 am | Markit manufacturing PMI flash | July | — | 55.4 | |
| 9:45 am | Markit services PMI flash | July | — | 56.5 | |
| WEDNESDAY, JULY 25 | |||||
| 10 am | New home sales | June | 670,000 | 689,000 | |
| THURSDAY, JULY 26 | |||||
| 8:30 am | Weekly jobless claims | 7/21 | 215,000 | 207,000 | |
| 8:30 am | Durable goods orders | June | 2.9% | -0.4% | |
| 8:30 am | Core capital equipment orders | June | — | 0.3% | |
| 8:30 am | Advance trade in goods | June | -$69.1 bln | -$64.8bln | |
| 10 am | Housing vacancies | Q2 | |||
| FRIDAY, JULY 27 | |||||
| 8:30 am | Gross domestic product | Q2 | 4.0% | 2.0% | |
| 10 am | Consumer sentiment | July | 97.0 | 97.1 | |
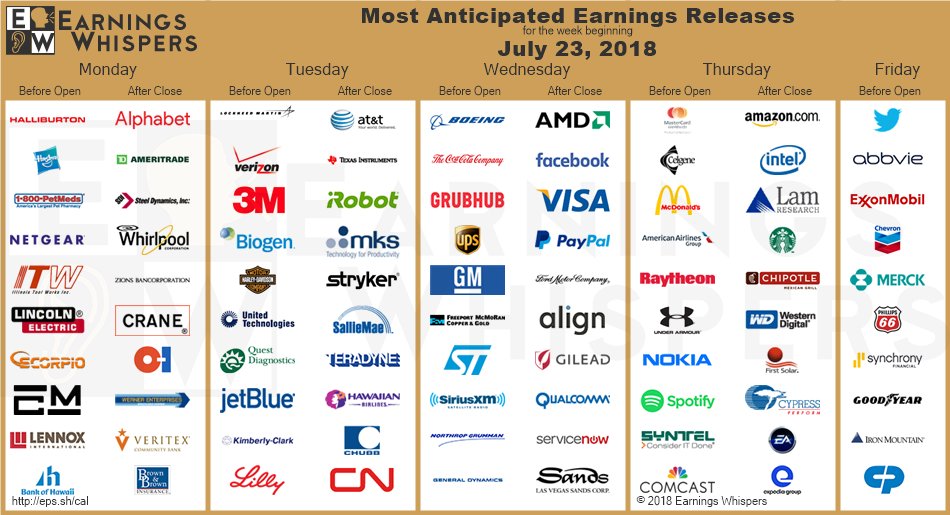
Other than that, it's all about earnings as we move into the meat of the season with about 1/3 of the S&P 500 reporting this week, notably:
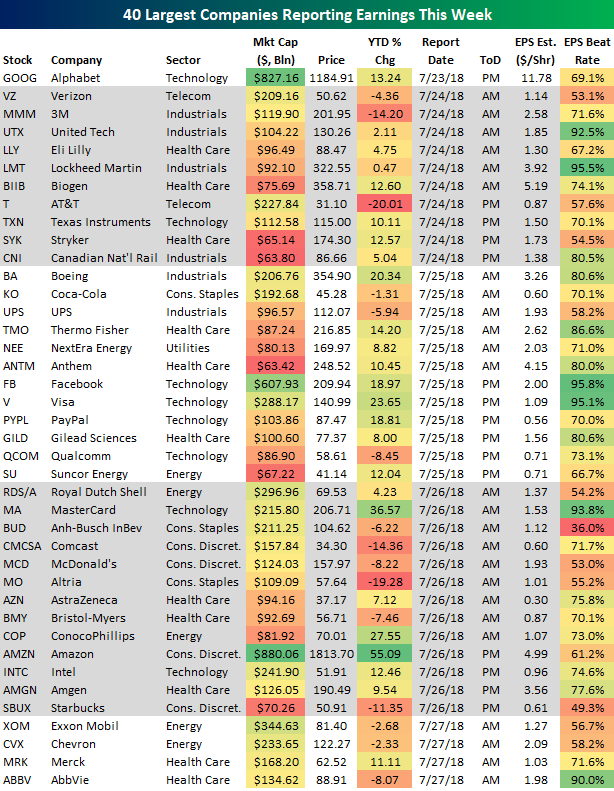
Stocks are heading into this earnings period with their highest price to sales ratios EVER so forgive us for sitting this one out with PLENTY of CASH!!! (over 80%) on the sidelines in our Member Portfolios:

And, while Corporate Earnings may be improving, the earnings for employees has actually turned negative again – that hardly seems awesome, does it?

We're 50/50 on our earnings plays so far so it's prudent to wait a bit and gather more data before getting back into the prediction game.
Be careful out there,
– Phil