

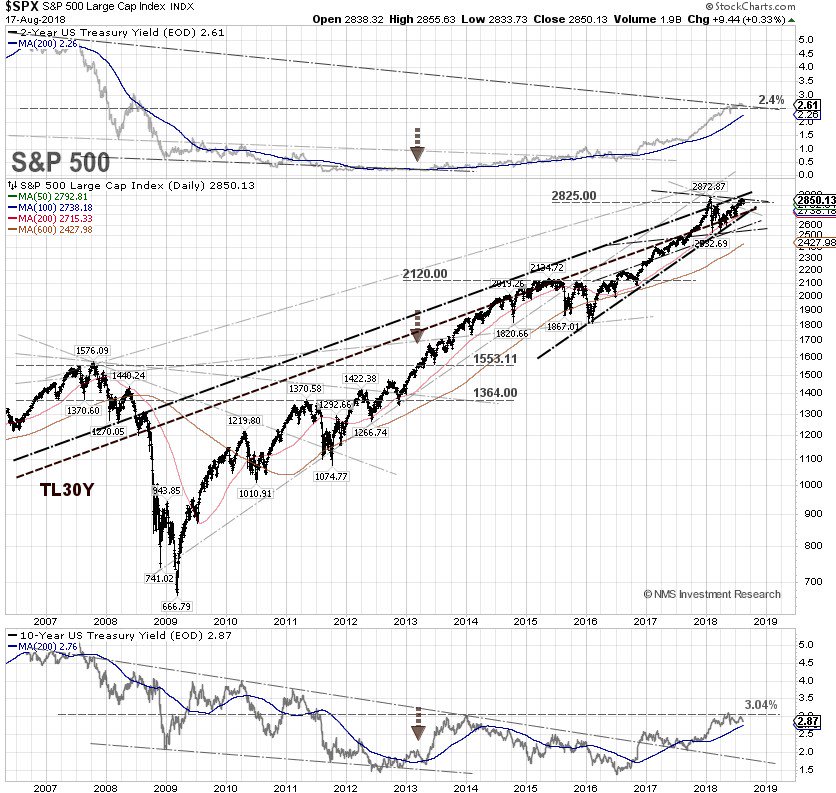 3,500 days.
That's how long the bull market has lasted as of today since the BIG CRASH on March 9th, 2009. If you've forgotten how much fun that was, take a moment to read our 2010 reviews, written while the whole thing was a fresh wound:
As of tomorrow, this will officially be the longest bull market in US history but it is VITALLY important to Trump and the Republicans that it continue until November, when the GOP can ill-afford to have you pulling levers while seeing red in your portfolios. There's only so many votes a Russian hacker can change in one day, you know!
To that end, Trump has now called for a weaker Dollar, publicly complaining about the Fed's tighter monetary policy and saying the Fed should help him do more to boost the economy – never mind that that's not at all what the Fed is supposed to be doing. So far, Trump has the Atlanta Fed's Bostic in his court and Bostic has now said he will dissent against further rate hikes to prevent the yield curve from inverting.
Trump has also accused China and the EU of manipulating their currency to make it weaker – giving them unfair trade advantages (it makes their exports to the US cheaper – as if the US is the only person they trade with) and all that has combined to take the Dollar down over 1% in the past week, which then reprices the market up 1% (since we buy stocks in Dollars) giving Trump the same "unfair" advantage he accuses Europe of when measuring HIS rally (the one he's been here for the last 585 out of 2,200 points of).
That's right, Trump got on this S&P 500 ride at 2,275 and the index has gained 26% in two years for an average of 13% a year, quite a bit better than the market's 8% average returns, so he must be doing a good job but, by that logic, Obama was sworn in with the S&P at 850 and handed it over to trump at 2,275, which was a gain of 167% in 8 years or 21% a year on average – more than 50% better than Trump is doing so Trump is, in fact, presiding over a tremendous deceleration in equity gains and is acting like he's done you a tremendous service.
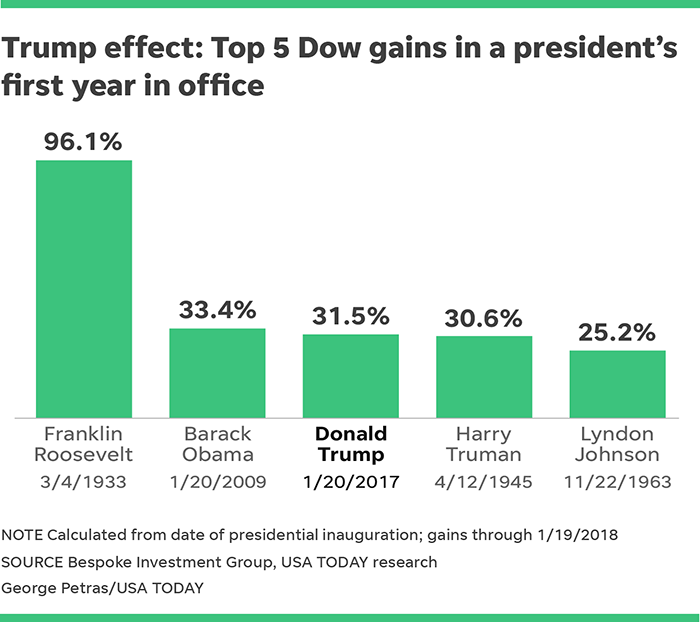 In fact, after Trump's very nice first year performance (before his budget and policies went into effect), year two has been a disaster as the S&P was at 2,872 in January of this year and now it's at 2,862 which is, if I am handling the math correctly, 10 points lower in Trump's 2nd year of office, so far. If Trump can't figure out some way to goose the S&P to new highs in the next 77 days – he's going to make it very hard for the GOP to hold both houses of Congress on November 6th.
It may even be too late to start a war, which was how Bush II managed to stay in office despite having an approval rating almost as low as Trump's. "Don't change horses during a war" sounded good at the time but no one is attacking us an nobody votes the school bully to be the class President – unless they do away with secret ballots – which Trump is, of course, considering with a provision in the Homeland Security Bill that would allow him to dispatch Secret Service Agents to polling places in order to "make sure votes are handled correctly." And yes, that bill passed but it was lost in the storm of other BS that's going on and it won't really seem to matter until it goes into effect – on election day, when it's too late to stop.
 Of course, this is good for the markets as 4 more years of Trump, even if he is averaging just 13% vs Obama's 21% – that's still big enough (that's what she said!) to make voters happy, right? But what happens if next year is flat, then it's 26% divided by 3 (8.666%) and if we're still at 2,850 or lower into the next election, Trump's market gains will be as tiny as his fingers and, once again, the President's performance will become an issue as his
measurements fall far short of Obama.
Yesterday we were very successful shorting the Futures below their lines and we can take another crack at it this morning as we're at 25,800 on the Dow (/YM), 2,860 on the S&P (/ES), 7,400 on the Nasdaq (/NQ) and 1,700 on the Russell (/TF) and it's the same drill – wait for at least 2 to cross below and then short the laggards and, if any cross back over – stop out quickly. I think the Dollar (/DX) should bounce around 95.30 and that should push the indexes lower or, more accurately, stop supporting them and they will drift a bit lower on their own.
You're welcome on Gasoline (/RBV8) which hit $1.93 this morning which is up another 0.04 per contract at $420 per penny, per contract for a $1,680 gain just from reading yesterday's $3 PSW Report in the morning. That's the same price as the "failing" New York Times but I bet the New York Times doesn't give you trade ideas that make $1,680 in a day, do they?
We're out of gasoline now but still liking Coffee as next July's contracts (/KCN9) hit a decade-low $109 ($101 on the front-month /KC contracts), where we last bottomed in late 2013. There are many coffee-growing regions and we're simply betting that, at some point over the next 10 months, there will be some disruption somewhere on Earth that causes a temporary supply issue that boosts prices back to $120 and coffee contracts pay $375 per dollar move so that would be $4,125 on an 0.11 move back up.
Obviously, you want to stop out below $100, so risking a loss of $400 to potentially gain $4,000 is just the kind of risk/reward profile we like to play in the Futures. Note, at the bottom of the chart that it's Large Traders who are heading for the exits while Commercial Hedgers are picking up the longs – it's going to be interesting to see how this resolves.
For the Futures-challenged, BJO is the Coffee ETF and it's new and in serious trouble as it's collapsed from $50 at the March open down to $38 yesterday. As people bail on the ETF, it forces them to liquidate their Futures positions and exacerbates the decline so we'll look for signs of a bottom there as well and you can limit your exposure by simply picking up the following trade, which we can add to our Options Opportunity Portfolio:

- Buy 20 BJO March $38 calls at $3.20 ($6,400)
- Sell 20 BJO March $41 calls at $2.10 ($4,200)
That's net $2,200 on the $6,000 spread so the upside potential is $3,800 (172%) in 7 months if BJO manages to get back over $41. So the upside is very nice, there is no margin requirement and your loss is limited to $2,200 but, if you follow the same rule and get out if /KC fails to hold $100 – then the maximum loss should be minimal against a pretty exciting potential gain.
That is how we teach our Members at PSW to use options for both leverage and hedging at the same time!