Courtesy of ZeroHedge View original post here.
One week ago, when we laid out the purely technical, gamma-driven cause behind the latest market meltup, we warned that should the violent move higher reverse, we are at risk of an accelerated slump to the downside due to the increasingly narrow bearish-bullish range for CTAs and other pattern-following (better known as trend-chasing) funds.
Fast forward to today, when the edge of this “box” has finally caught up with spot spoos. The lower edge.
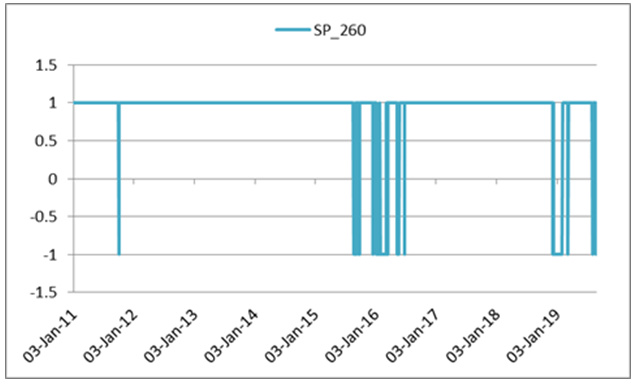
As Nomura Charlie McElligott writes in a quick market alert this morning, the Nomura quant CTA model technically triggered from +100% Long to -23% Short on the close yday below 2875, “as the 1Y lookback window (most heavily weighted across model tenors at ~62%) itself flipped “short” for the first time since the Dec 14th 2018 / Feb 1st 2019 stretch (a 1d ‘false trigger’ in March as well).” Readers can see how rare it has been for Nomura’s SPX model’s 1Y lookback window to trigger “Short” (2011-present):
The silver lining is that this doesn’t necessarily mean a puke is inevitable, as the S&P model would flip back “Long” on a close above 2890 back to +100%. Whether or not that happens will depend entirely on what the buyback bid does. According to Goldman’s buyback desk, last week there was a +20% increase in buyback flows vs the 2018 avg daily trading volume and +15% vs 2019 ADTV on market-draw down days. As such, the desk saw a spike in buybacks as corporates stepped aggressively in on Friday’s 300bp sell-off, as flows soared +30% that day.
In this “new abnormal”, stock buybacks have become the new plunge protection team.
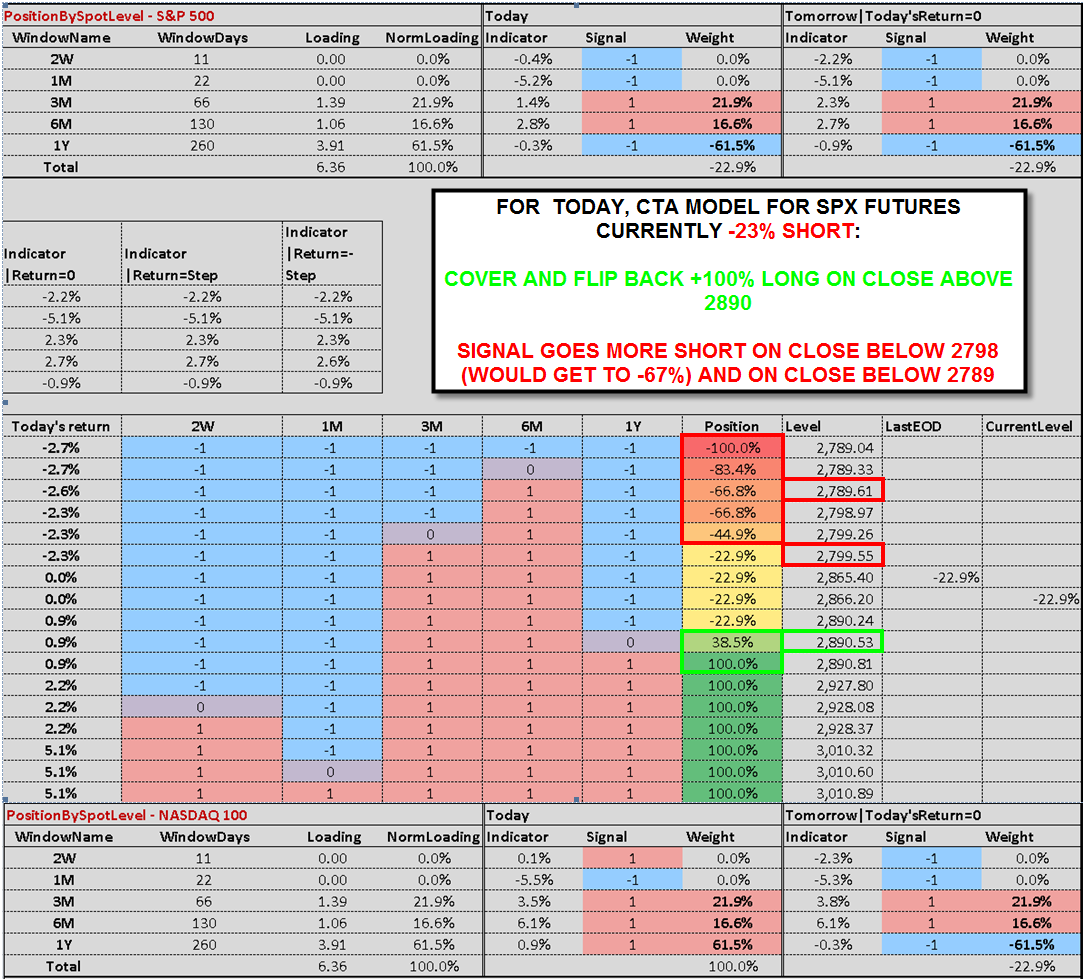
The problem is that the buyback window is rapidly closing as we approach September and Q3 earnings season, which brings us to the not so good news, namely that as McElligott warns, “the model’s next sell level from here would be a close below 2798, where the signal would drop to -67% Short; from there, a small additional decline & close below 2789 would see the model go all the way down to -100% Short.”
In other words, as the next table shows, the CTA model is now a modest, 23% net short, and firmly in the “chop” zone as signal “triggers” narrowing in a tight band, and any concerted moves lower will only lead to an acceleration to the downside.
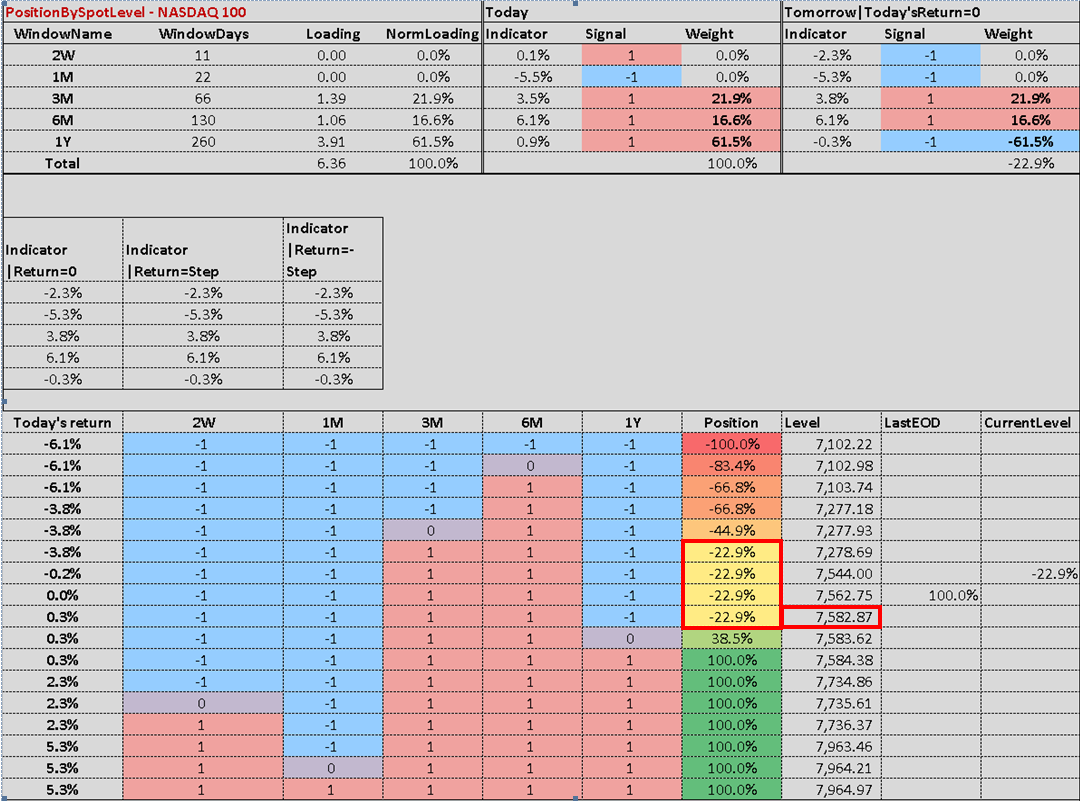
Stepping away from the S&P and looking at the market-leading tech sector, the Nomura quant warns that the next shoe to drop in US stocks is the heavily-owned Nasdaq, “with the model still technically +100% as of yday’s close, but as per this morning’s futures price-action, would also be flipping to -23% Short if we held lower and closed below 7582 (7526 spot ref last)”, in other words unless there is a burst of tech sector buybacks today, watch out below.