

Here's the weekly S&P 500 ETF (SPY) Volume Chart since we topped out at S&P 3,390 back in February:
| Date | Open | High | Low | Close* | Adj Close** | Volume |
|---|---|---|---|---|---|---|
| May 28, 2020 | 304.65 | 306.84 | 302.24 | 303.07 | 303.07 | 90,767,807 |
| May 25, 2020 | 301.93 | 306.84 | 295.46 | 302.97 | 302.97 | 284,174,000 |
| May 18, 2020 | 293.05 | 297.87 | 291.95 | 295.44 | 295.44 | 443,623,300 |
| May 11, 2020 | 290.34 | 294.24 | 272.99 | 286.28 | 286.28 | 552,746,300 |
| May 04, 2020 | 280.74 | 292.95 | 279.13 | 292.44 | 292.44 | 385,948,200 |
| Apr 27, 2020 | 285.12 | 294.88 | 281.52 | 282.79 | 282.79 | 548,933,400 |
| Apr 20, 2020 | 282.61 | 286.79 | 272.02 | 282.97 | 282.97 | 509,895,300 |
| Apr 13, 2020 | 277.14 | 287.30 | 271.41 | 286.64 | 286.64 | 649,240,600 |
| Apr 06, 2020 | 257.84 | 281.20 | 248.17 | 278.20 | 278.20 | 733,545,600 |
| Mar 30, 2020 | 255.70 | 263.33 | 243.90 | 248.19 | 248.19 | 869,026,800 |
| Mar 23, 2020 | 228.19 | 262.80 | 218.26 | 253.42 | 253.42 | 1,342,924,000 |
| Mar 20, 2020 | 1.406 Dividend | |||||
| Mar 16, 2020 | 241.18 | 256.90 | 228.02 | 228.80 | 227.46 | 1,523,388,400 |
| Mar 09, 2020 | 275.30 | 288.52 | 247.68 | 269.32 | 267.75 | 1,562,964,500 |
| Mar 02, 2020 | 298.21 | 313.84 | 290.23 | 297.46 | 295.72 | 1,130,490,100 |
| Feb 24, 2020 | 323.14 | 333.56 | 285.54 | 296.26 | 294.53 | 1,243,284,200 |
| Feb 17, 2020 | 336.51 | 339.08 | 332.58 | 333.48 | 331.53 | 293,992,500 |
| Feb 10, 2020 | 331.23 | 338.12 | 331.19 | 337.60 | 335.63 | 260,011,300 |
This week is not over but we're trending tthe same, lame 500 Million(ish) volume we have since we bottomed and it's not a good thing for there to be heavy, heavy selling followed by weak buying. Let's say we're bulding a house of cards and our first attempt had all 52 cards in a deck holding it up and it got all the way to 3,390 but then it got knocked down by a virus so we rebuild it and we get all the way back to 3,040 – but we only used 26 cards…
 Is the 2nd house of cards we built likely to be stronger than the first or is it going to be much more flimsy and ready to collapse at the slightest breeze? THAT is the market we have bought ourselves with this very speedy and sloppy recovery in which we re-captured the HEIGHT of the previous rally – but without building any kind of base to support it.
Remember, the market is an auction and the price of the last share of stock sold at the bell determines the IMPLIED value of ALL the other shares of stock – no matter how ridiculous that last price paid happens to be. If, right at the close, I pay $350 for the last share of Apple (AAPL) then AAPL will carry a $350 price tag overnight and I will have added $120Bn worth of IMPLIED "value" to the company by spending $350 on the last share of stock.
We've seen this happen plenty of times as stocks fly up at the close or overnight, only to be sold right back down the next day and it works the other way as well. This goes to that great market axiom that you can fool some of the traders all of the time but not all of the investors all of the time – that's why the 50-day moving averages are more volatile than the 200-day moving averages – there is some wisdom to the larger crowds.
As I pointed out to our Members this week we have to consider, in the bigger picture, that the over-reaction to the virus was a blip in the long-term picture and should simply be ignored but what is very real is the 5% Rule, which tells us we've completed our run from S&P 1,600 to S&P 3,200 and, even in the most bullish conditions (and these may be with all this liquidity added) we can still expect to consolidate for quite a while (maybe years) before heading any higher.
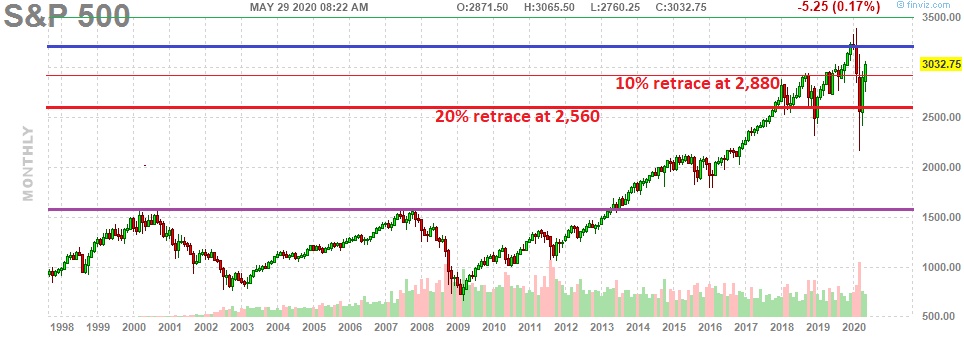
Very simply, all that's happened recently is that we've had a 20% retrace of a 100% run in the market over the past decade and that certainly makes sense since the Global GDP in 2007 was $58Tn and in 2000 it was 33Tn and clearly S&P 1,600 was not sustainable then but $58Tn did turn out to be enough to support it and, in 2013, the Global GDP was up to $77Tn – up 33% from 2007 and THAT was finally enough to send us up to the next level.
 That means, $58Tn is to low to justify 1,600 and $77Tn is too much and they are only 19 points apart so let's say $67Tn is certainly enough to justify 1,600 and higher on the S&P 500. That means we'd want to see $134Bn in Global GDP to justify a sustained move in Global Equities to 3,200 and above. Sadly, the current Global GDP is $87Tn as of last year and likely to be LOWER in 2020 and not likely to hit $134Bn until the end of this decade.
There are other factors like weaker currencies making stocks more expensive and lower taxes making the earnings more valuable – both of those have come into play but not enough so that they justify paying S&P 3,200 for $87Tn in GDP – that's simply an indicator that the market is grossly overpriced.
Is everything overpriced? Of course not, our portfolios are filled with bargain stocks that we think will do very well over the next decade as the S&P grows into it's valuation but it is very much a stock-picker's market and the indexes are still houses of cards at these levels – very easy to blow over in a crisis.
Today our crisis will be Trump placing new sanctions on China and next week the crisis will be 40M Americans out of work and, so far, there's no real plan to deal with that.
We can pretend the Nasdaq is a different animal and not bound by such issues as the Global Economy determining it's value but the S&P 500 IS the Global Economy and, eventually, tends to reflect that reality. As such, in our Short-Term Portfolio (which hedges our long portfolios) we recently added 100 Jan $20/30 bull call spreads at net $2 and they are now net $1.46 – so an even better deal now but we're going to make some adjustments into the weekend uncertainty to lock in the ridiculous gains we've made over the past two weeks on our longs:
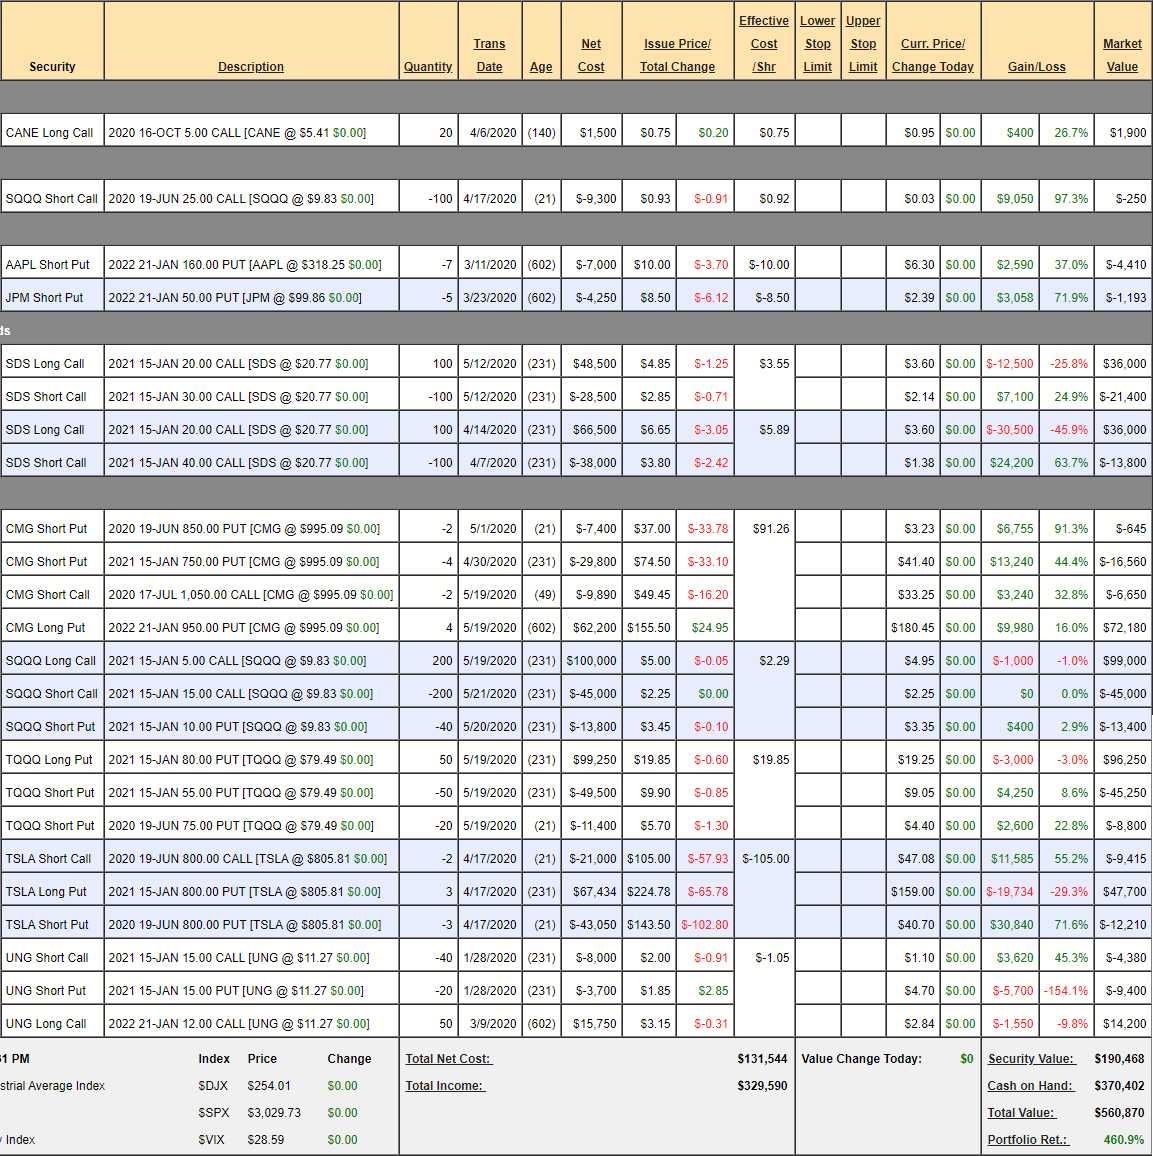
- Sugar ETF (CANE) – Sugar took another turn down this week but we expect it to pop into the summer. This is a small, speculative bet.
- Nasdaq Ultra-Short ETF (SQQQ) #1 – We are just waiting for those short June calls to expire.
- Apple (AAPL) – We sell short puts to offset the cost of our hedges. Not worried about these as our worst-case is being "forced" to by 700 shares of AAPL at net $150. PLEASE!!! Meanwhile, we put $7,000 in our pocket for promising to buy them – isn't that crazy?
- JP Morgan (JPM) – Here we collected $4,250 for promising to buy JPM for net $41.50 – also more than 50% off the current price. These are the kinds of things you can do all day with your sideline buying power.
- S&P Ultra-Short (SDS) – Here we have 2 hedges and SDS is now $20.77 and it's a 2x ETF so, if the S&P drops 20%, SDS will go up 40% to $28(ish) so the $20/30 bull call spread is a good range. The spread has gotten a lot cheaper since we initiated and the range is still good so let's double down on the $20/30 spread to add another $100,000 worth of protection for net $14,600 – I'd say that's a good insurance play! That will give us $300,000 worth of protection at $30 against our current net (including the new $14,600) of 51,400 for a net $248,600 total hedge.
- Chipolte (CMG) – Right in the center of our range and this spread is very profitable already.
- Nasdaq Ultra-Short (SQQQ) – The problem here is that SQQQ is so low now ($9.83) that, even though it's a 3x gainer, +60% is only $15.71. That is the range we are covering so this hedge is fine but, at net $2.75, it's not even a double so SDS is clearly a better hedge at the moment. Still it's a $200,000 spread currently valued at net $40,600 so $159,600 worth of protection.
- Nasdaq Ultra-Long (TQQQ) – Since we weren't happy with the pay-off potential of SQQQ anymore, we switched to shorting TQQQ instead. TQQQ at $80 can fall 60% on a 20% dip in the Nasdaq (see the March collapse) and that would take it down to $32 which would put the $80/55 bear put spred well in the money. We paid net $38,350 for the $125,000 spread which gives us $86,650 in protection and, so far, we've collected $3,850 in profits not because the Nasdaq went lower but because we sold an insane amount of premium to suckers who pay it instead of selling it!
- Tesla (TSLA) – Right on the button so far and I want to buy back the short June $800 puts as we're up 71.6% with 3 weeks left to go and I think that, now that Musk has qualified for his bonus, the extreme measures he's taken to prop up the stock all month may start to wear thin. That turns us very bearish in TSLA but it's a small unit bet.
- Natural Gas ETF (UNG) – We cashed out our oil play last week and UNG is in trouble but I don't think this will last so we'll take advantage of this down move and make adjustments: The 20 Jan $15 puts at $4.70 ($9,400) can be rolled to 30 of the 2022 $12 puts at $3.50 ($10,500) and the 2022 $12 calls at $2.84 ($14,200) can be rolled to the $8 calls at $4.25 ($21,250) and we'll buy back the 40 short Jan $15 calls at $1.10 ($4,400) and wait for a bounce to sell more. So, on the whole, we're spending net $12,550 to roll our 50 longs $4 deeper in the money ($20,000) but UNG is only at $11 so call it $15,000 in the money for $12,550 – NOT making those kinds of adjustments is a poor way to manage your positions!
On the whole, we have $494,850 worth of protection against another 20% S&P 500 drop and I will remind you that this is how we made $460,870 this year already so I think it's a great plan and we have our fun plays in this portfolio and our long plays in other portfolios to help offset any losses we may have in this set of hedges. Oh yes, and we also have $370,402 in CASH!!!
I feel good about the weekend now.
Have a great one,
– Phil