

 50%.
50%.
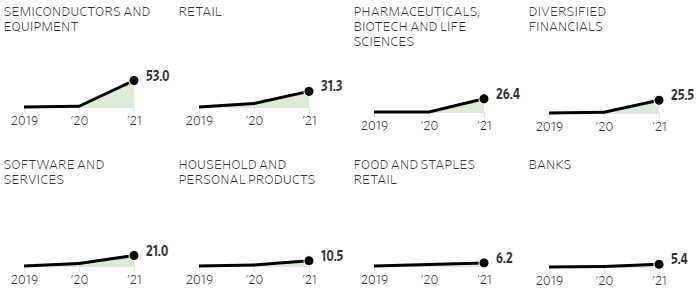
That's how much the indexes are up since 2019 yet only one sector in the S&P 500 has actually grown 50% (Semiconductors) – despite $10 TRILLION worth of stimulus being dumped into the economy during that time. Consumer Goods, Food and Banking (things the Bottom 80% actually use) have been pretty flat while Electronics, On-Line Retail, Drugs, Investment Banking and Software are all doing pretty well for their Top 20% clientele.
But what will happen when we remove the stimulus? Well, we may never know judging by Powell's speech last week, in which he indicated the Fed was in no particular hurry to stop dropping $120Bn per month into the economy and the Administration, for their part, are trying to finalize a $3.5Tn budget and a $1.1Tn stimulus package. That will be on top of the $2.2Tn stimulus we already spent in the first half, which is 22% of our $10Tn, 6-month GDP. After that spending spree (and $720Bn from the Fed), the economy grew 6.6% in Q2 – not even 1/2 of the stimulus levels.
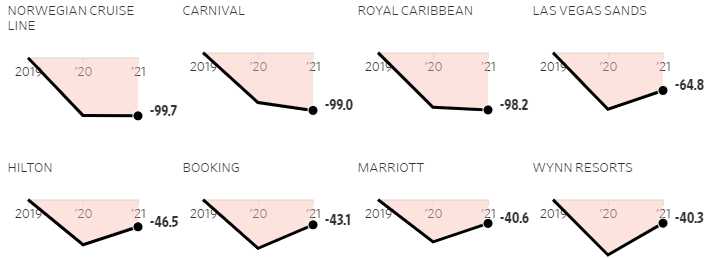
As you can see from the above chart, the travel and tourism sector is still in very rough shape (Q2 to Q2 comparisons) and, of course, Airlines are just as bad and oil companies are only just getting back to normal. Consumer Services are still down 31.3% but Consumer Service Stocks (IYC) are up 50% from their 2019 levels because neither sales nor profits seem to matter to traders these days.
Amazon (AMZN) is 10% of the IYC, then Home Depot (HD), Disney (DIS), Netflix (NFLX), Comcast (CMCSA), Walmart (WMT), Costco (COST), McDonald's (MCD), Lowe's (LOW) and Starbucks (SBUX) make up the Top 60% – so it's a mixed bag of stocks that benefitted from Covid and stocks that lost revenues but why the index is up 50% while overall revenues are down 31.3% is beyond all logic.
As long as Traders THINK we will get more stimulus, they are willing to ignore anything else that's going wrong with the recovery. We have noted before that China has a lot of over-leveraged lenders and Huarong Asset Management just reported a loss of $15.9Bn in a long-delayed 2020 filing after leverage was hitting their capital buffers 1,333 times in 365 days.
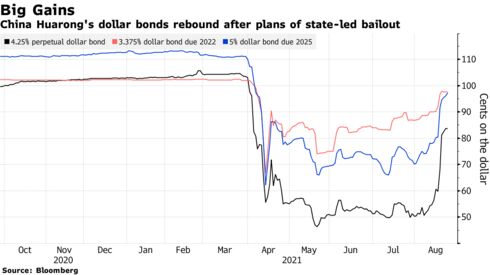 The firm’s shares, which will remain suspended from trading, have slid 67% since their debut. Before it went public in 2015, it was backed by heavyweights including Warburg Pincus and Goldman Sachs Group Inc. State-owned investors including Citic Group, China Insurance Investment Co. and China Life Asset Management Co. on Aug 18th agreed to put fresh capital in Huarong. The firm would receive $7.7 billion as part of an overhaul plan with control shifting to Citic from the Finance Ministry, though details were still being finalized and could change, people familiar with the matter have said.
While defaults at state-owned Chinese companies have become more common in recent years, none of the borrowers that missed payments have been as systemically important as Huarong, who are also one of the country’s biggest issuers of offshore bonds that sit in portfolios from Hong Kong to London and New York. If Huarong loses its investment-grade credit rating, 56% of surveyed fund managers that hold its Dollar Bonds would be forced to sell, according to a Bank of America report dated Aug. 17th.
Is Huarong a disaster we narrowly avoided or just the tip of the iceberg in the China melt-down? Too early to tell….
 To raise capital, China is selling 150,000 Tons of metal from State Reserves – their 3rd batch of the year and the biggest, by far. China's dumping metals on the market have stopped the metal rally this summer and Copper (/HG) may be a fun dip buy if it hits $4 again as China releases 30,000 tons on Sept 1st. There was no August sale due to Covid and you can see how fast copper came back in the past month.
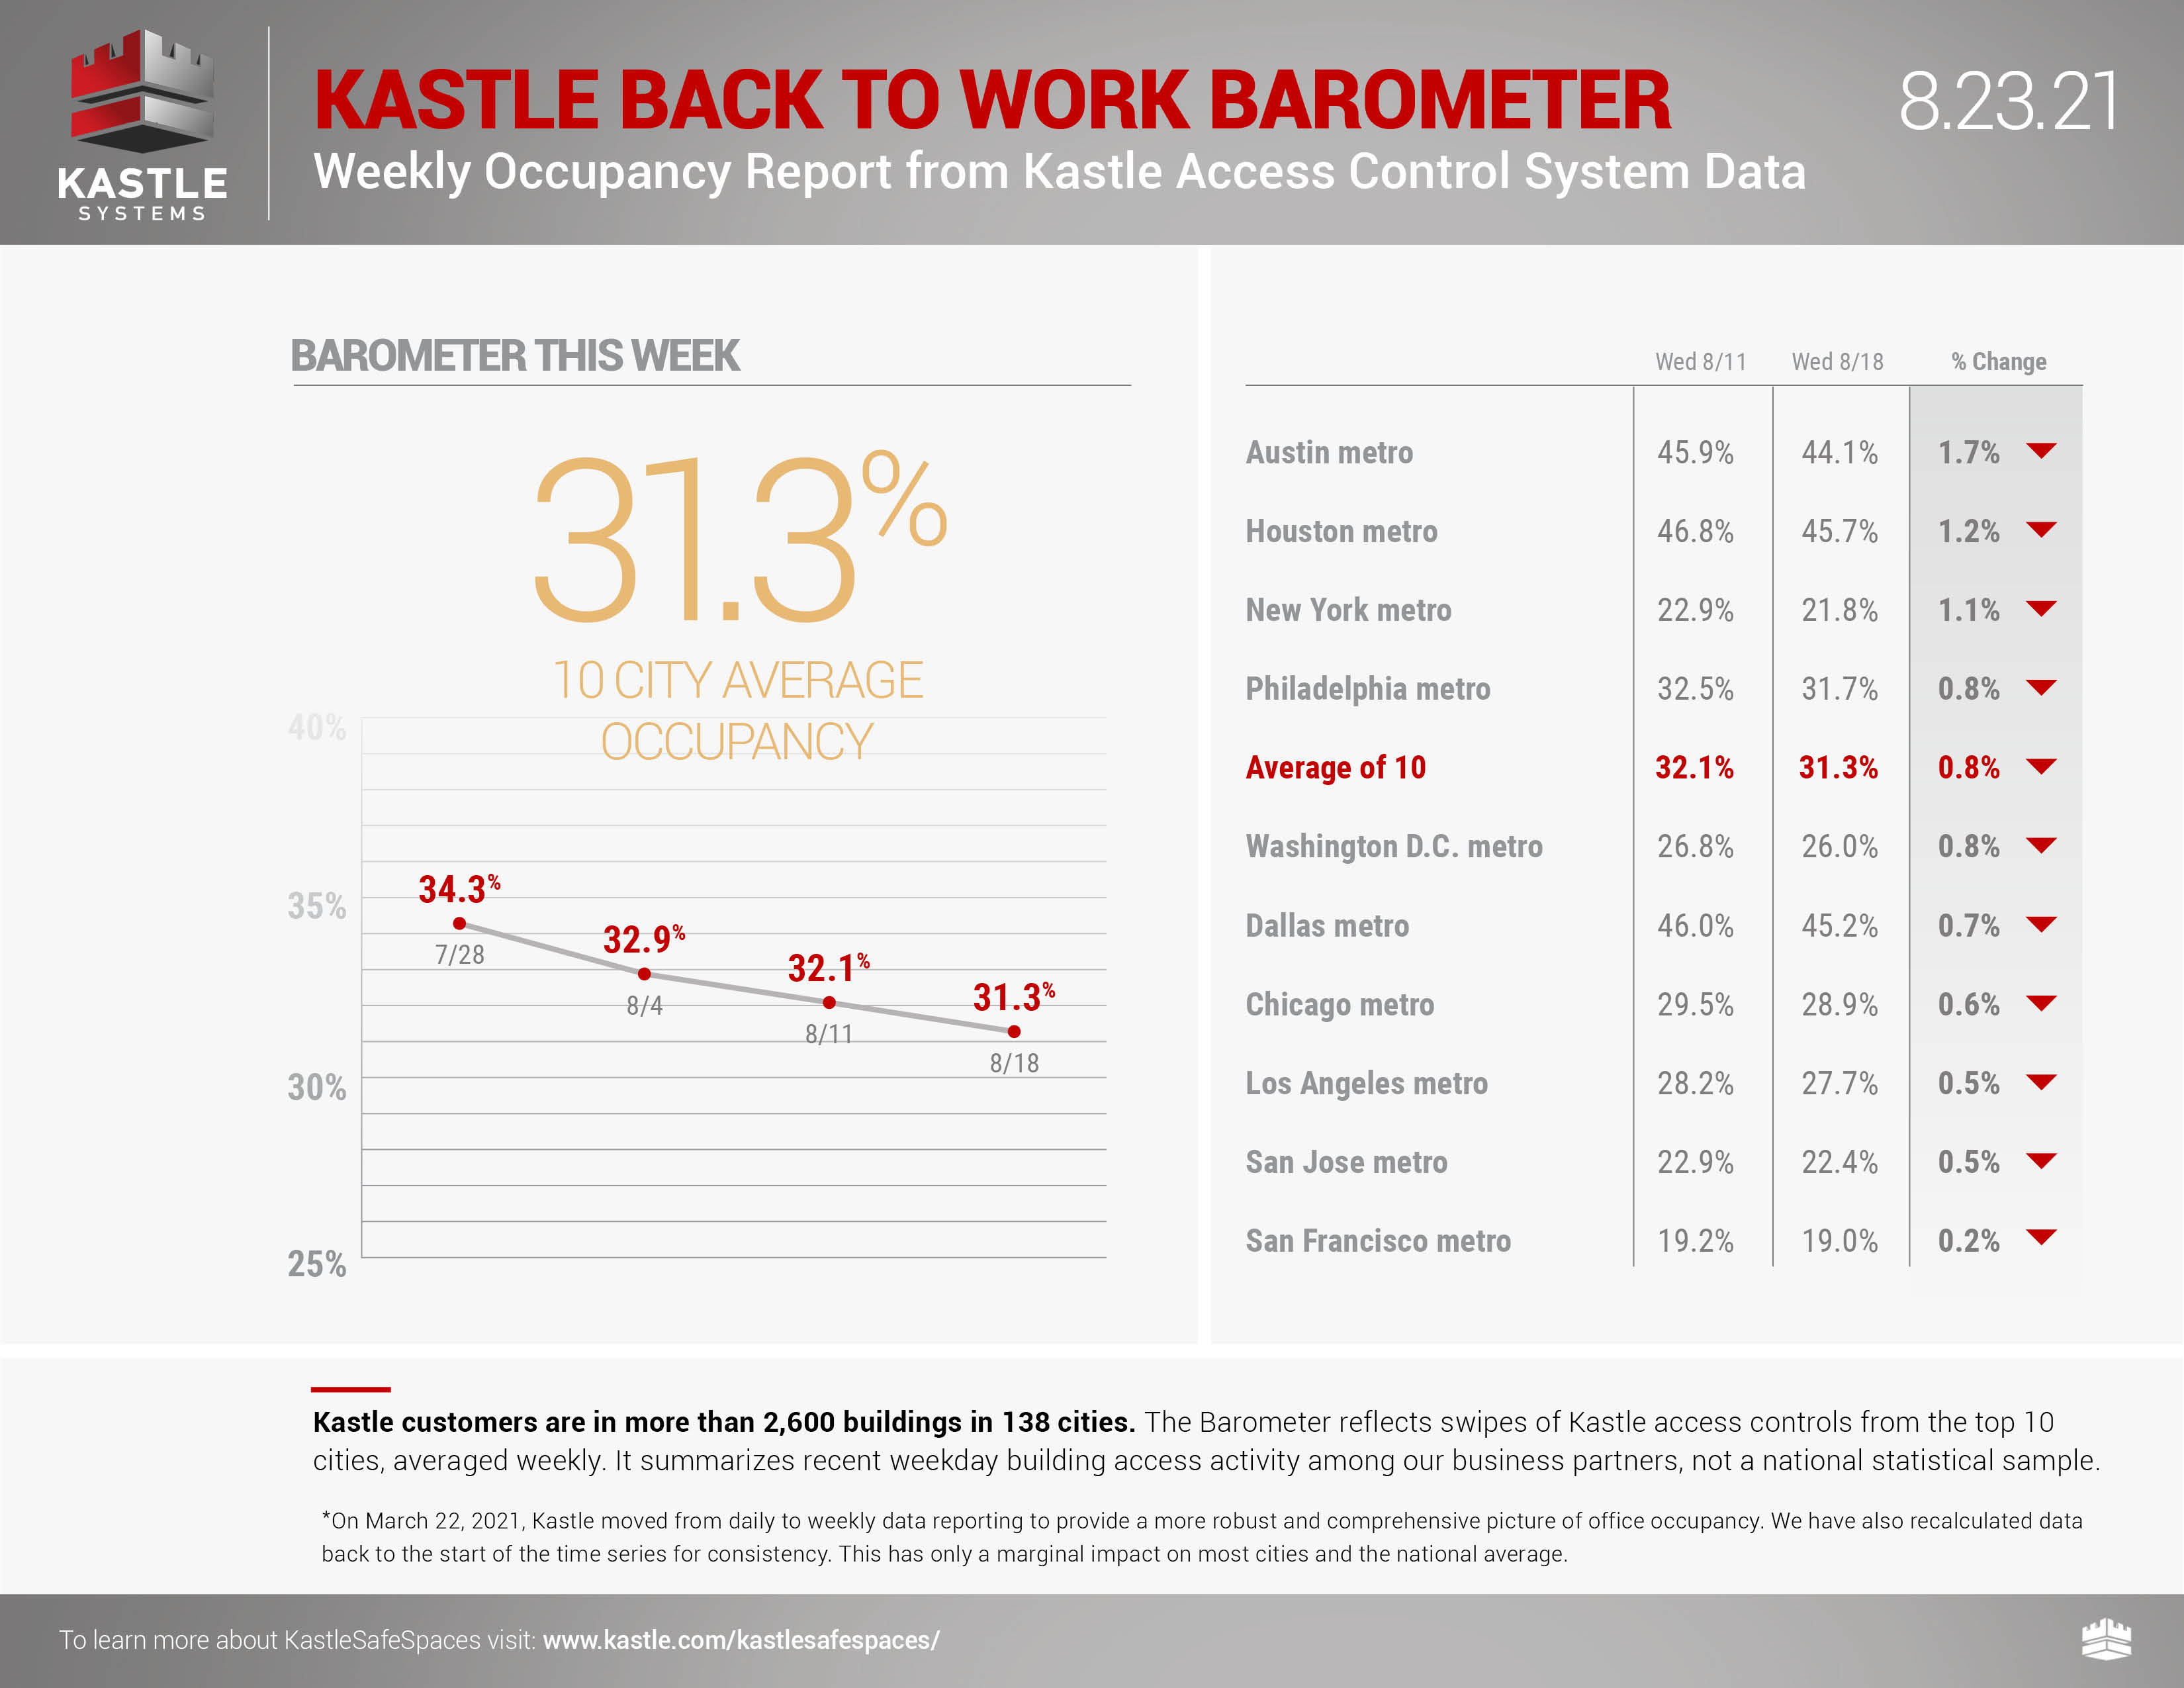
Meanwhile, we're certainly not back to work yet as Kastle Systems has been tracking the occupancy of 2,600 buildings in 10 cities and, as of Aug 18th, only 31.3% of the office space is being utilized, DOWN from 32.1% the week before and down from 34.3% on July 28th. How are things even close to "normal" if this is the situation downtown?
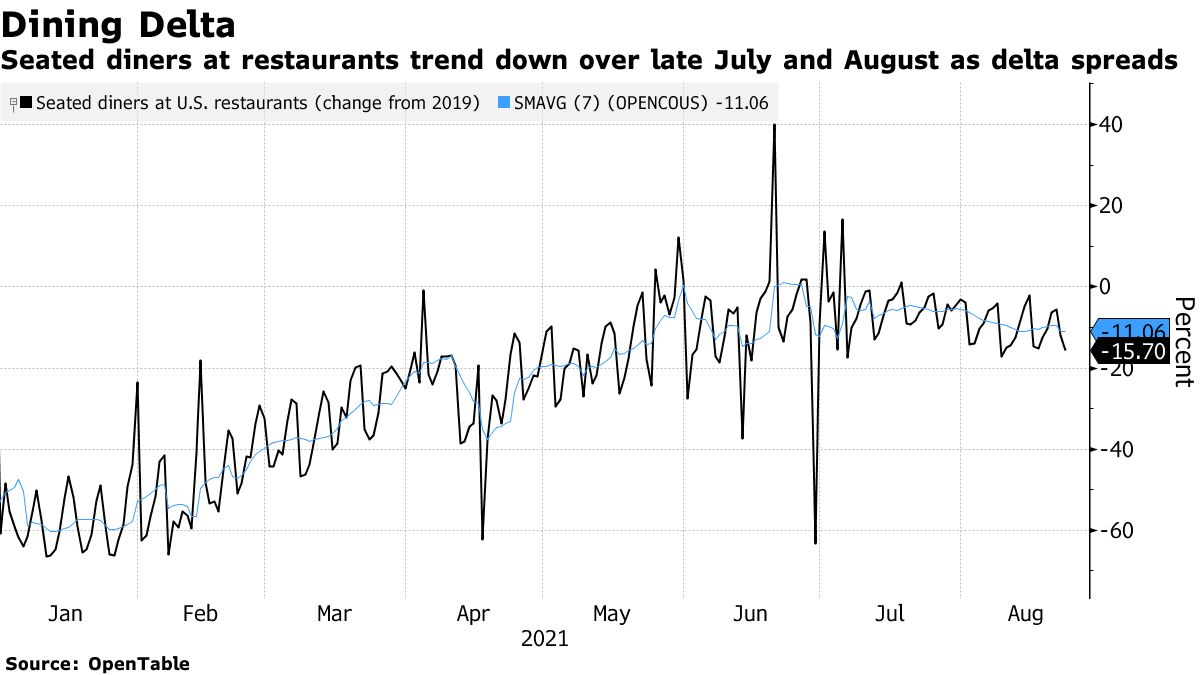
Dining out has trailed off again this summer:
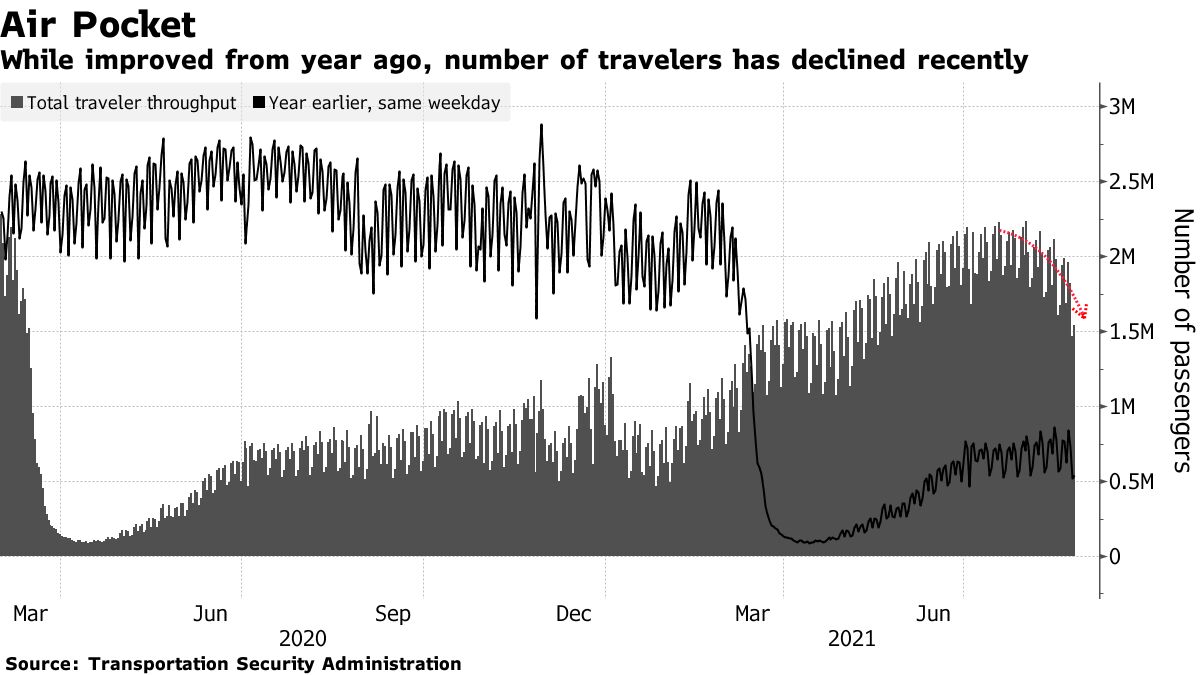
And air travel is down siginifcantly since June at just over 1/2 of pre-covid levels:
Keep this ACTUAL data in mind while the pundits tell you how well we are recovering…
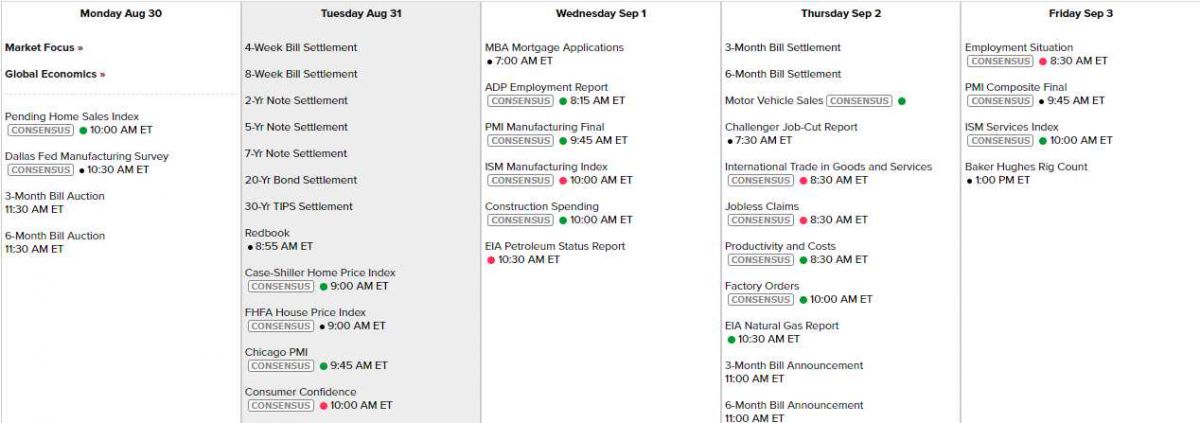
Meanwhile, it's a big data week. Dallas Fed today Case-Shiller, Chicago PMI and Consumer Confidence tomorrow, PMI, ISM & Construction Spending Wednesday. Thursday we have Productivity and Friday is PMI and ISM Services and, of course, the Non-Farm Payroll Report:
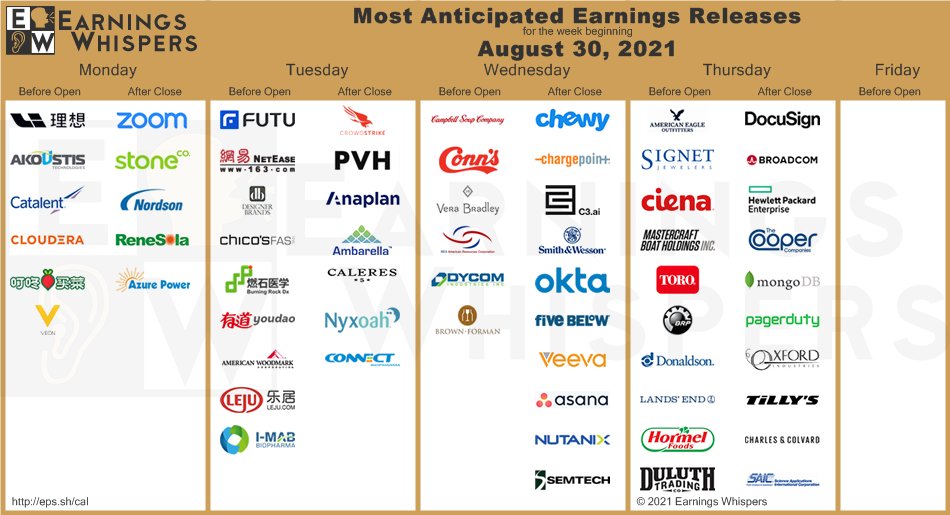
Earnings never stop these days – almost time for Q3 and Q2s are still rolling in:
We're still testing those record highs and we'll see how the week plays out.