

 4,577!
That's a new all-time high on the S&P 500 and it came on an exceptionally low-volume day but let's not quibble – people are buying whatever Corporate America is selling, whether it's a coin they just made up last week or a SPAC they made up yesterday – form eschews substance these days and the less you offer – the more they will pay.
Does that no make sense? Well, then you are playing the markets incorrectly, my friend! Aside from a few companies that have gotten trashed – earnings don't seem to matter, nor does guidance. Having a pulse seems to be enough to get investors excited and lifting stocks higher. Tesla (TSLA) sold 100,000 cars to Hertz (Bankrupt) for $420M and the stock jumped $120Bn in value. Even if each car was sold at a 250% profit – it would still have gained 100 times more than they could earn selling the cars — in a day.
 And, of course, logically, these are the same 100,000 cars that would have been sold to someone else had Hertz not bought them – or were we worried that TSLA wasn't going to sell out their production prior to this? No, that wasn't the case at Tesla's entire production for 2022 is projected to be 1.3M cars and it was going to be 1.3M before and after this deal.
This chart is from Barron's way back on October 21st, when TSLA was only trading at $865.80, which was roughly $860Bn in market cap. Since then, it has gained almost $200Bn – the entire market cap of Toyota Motors (TM) – without any of the fundamentals actually changing (it's only been a week!). Toyota makes 1.2M cars PER MONTH and they also make $1.6Bn PER MONTH – also as much as TSLA makes in a year.
Where is the logic to these valuations? There isn't any. The total global auto market is 80M cars per year – even if TSLA sold them all it would be a hell of a stretch to get to $1Tn but, currently, TSLA has 2% of the market yet their Market Cap is equal to the entire rest of the industry COMBINED. This is madness, folks! And TSLA is just an example – there are runaway valuations like this, as there are in all bubble markets.
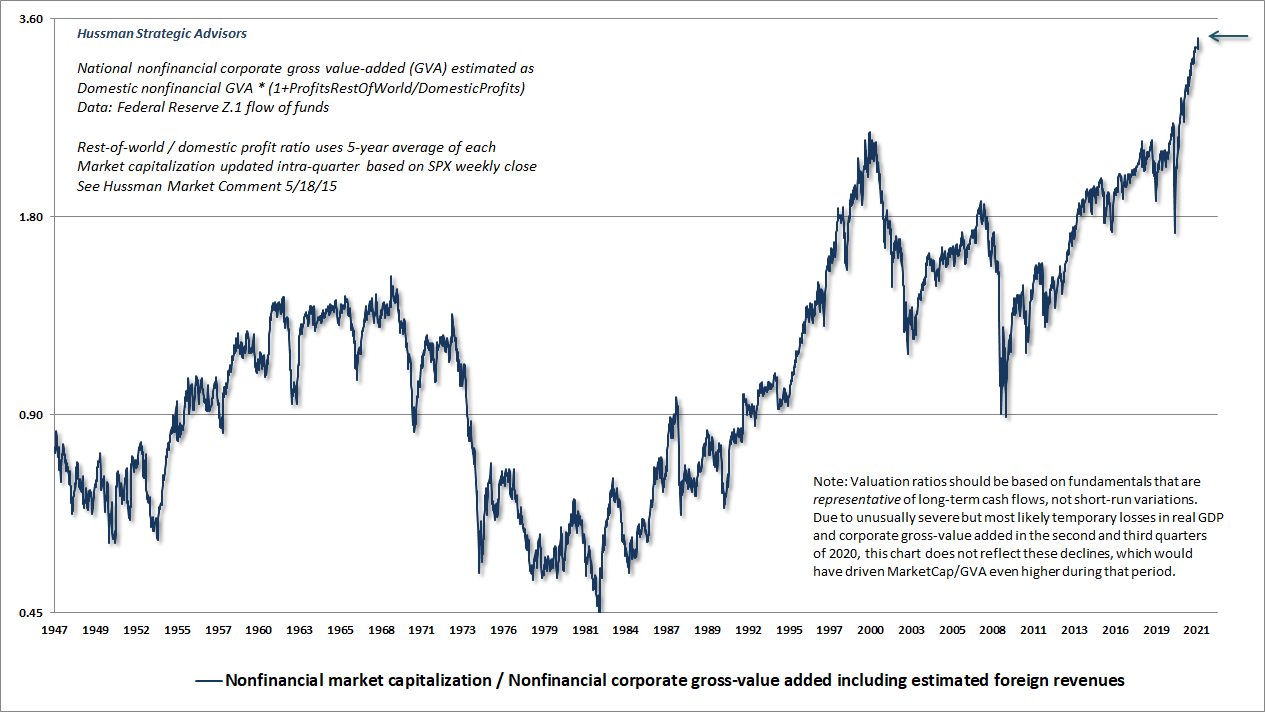
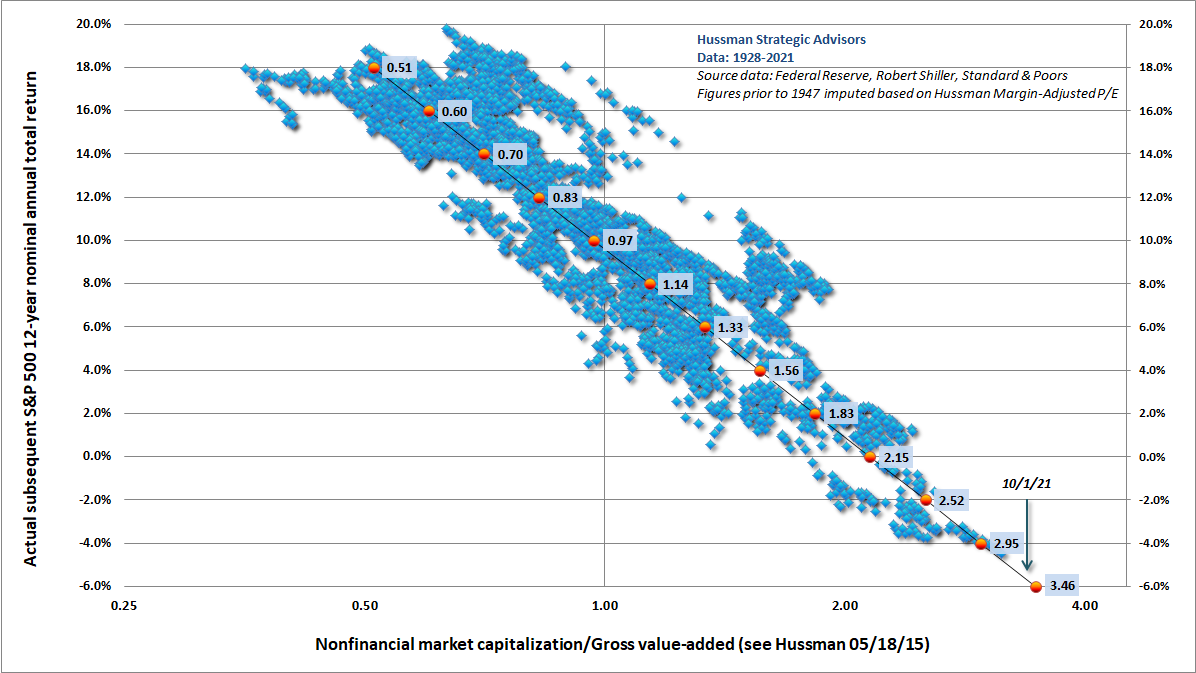
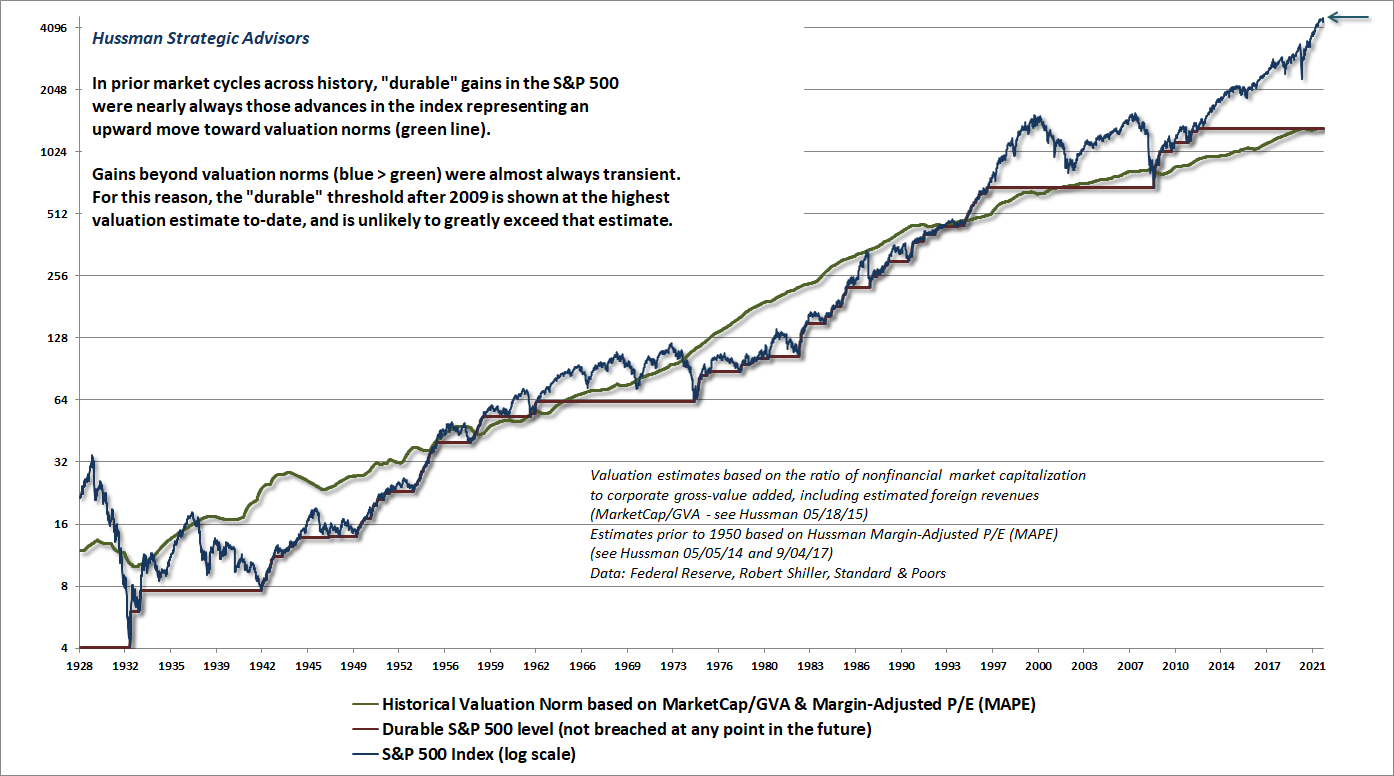
The above charts from Hussman Funds show how out of control things are getting. We are nearly 100% over the Dot Com level valuations and, from a historical perspective, the aniticipated annual returns are now firmly negative based on historical returns since the 1920s. This kind of thing is only important to long-term investors because, in the short run – there doesn't seem to be any rationale at all to the numbers people are willing to pay for stocks.
Today, if you take the U.S. equity market, the combination of the debt and the equity and say, ‘Well, how long would it take to pay off all the asset owners for their draw on future income?’ You’d have to work the family business for 25 years before you get a paycheck, right? And that is one of the four peaks in history. You had that peak in 1999/2000. You have that peak in 1929. You have that peak in 1965. You have that peak in 1905 in terms of the years of future income that are dedicated to paying back the wealth. That’s where you have the huge wealth divide problems and one way or the other, the cash flows, the willingness for people in the future to work to pay off old wealth holders is bounded in a democracy. And now, you’ve got to look at everybody that were losers in that whole game, and how do they benefit in society – or you risk the loss of society. So that’s this huge cycle, and when you look at the options, given where we’ve now pushed asset prices to, how do you reconcile asset prices with cash flows? – Greg Jensen, Co-CIO, Bridgewater Associates / The End Game with Grant Williams, 7/29/21
At valuations that presently stand at 3.4 times historical norms, the arithmetic here is daunting. Assuming the same 4% growth rate in S&P 500 revenues and nominal GDP that we’ve observed in the past two decades, a return to run-of-the-mill valuation norms would leave the S&P 500 index unchanged even [ln(3.4)/ln(1.04)=] 31 years from now, although the modest dividend yield of the S&P 500 would add something in the area of 2% annually. At a nominal growth rate of 10% annually, a return to historical valuation norms would still leave the S&P 500 index unchanged nearly 13 years from today – that's how far ahead of a reasonable valuation the market has gotten!
Even at all-time highs – be careful out there…