

 Dow 36,000!
We're finally here. Just a little late as this book was published in November of 2000 arguing that stocks in 1999 were signigicantly undervalued and traders did not understand the "new paradigm" and that the Dow would go up 4 TIMES in the next 4 years. Well, 22 years later they are finally "right" and the Dow closed last week at 36,327.
If we consider inflation to average 3% over 22 years, the Dow SHOULD be around 16,000 with inflation alone. Inflation, however, has an interesting effect on the market as it also inflates earnings – even though the earnings, in real-dollar terms, as no more than they were before the inflation.
In other words, if I sell you a hamburger I make for $1 for $1.50, I make 0.50 in profits but, if I price it in Pesos, which are 2 for a Dollar, then I sell you a hamburger for 3 Pesos that cost me 2 Pesos to make and I make 1 Peso. It's the same thing, we're just measuring it differently. That's where people get confused because we're comparing Dollars to Dollars and people can't get their head around the fact that a 2021 Dollar is not the same as a 1999 Dollar – but they are different as Pesos and Dollars are today!
So the stock making a profit of 0.50 selling hamburgers and getting a 20x multiple would be valued at $10 while the stock making a profit of 1 Peso and getting the same 20x multiple would be valued at 20 Pesos – much more, right? No, it's the exact same thing and so is a stock that was making 0.50 in 1999 but is now making $1 – the stock price may have gone from $10 to $20 but it's the exact same real value as it was back then – the "growth" is an illusion.
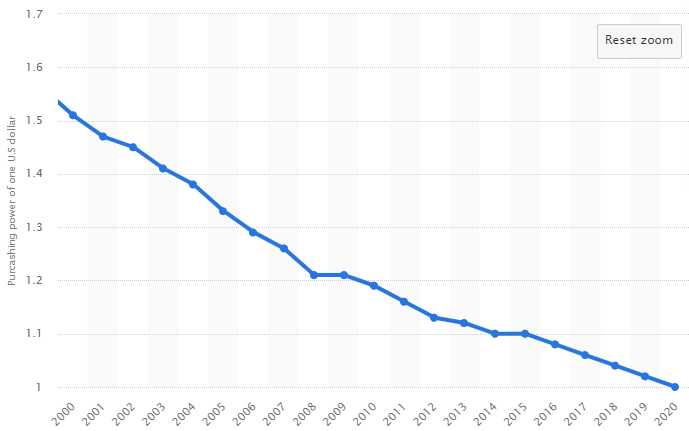
Then we take into account the declining purchasing power of those dollars, which also relates to inflation and that's down 35% since 2000. That means you need $1.6 today to buy whatever you could back in 2000 – including stocks. Now, look at the P/E Ratio of stocks over the past 10 years – it has DOUBLED! The average stock on the Dow and S&P 500 is trading at 38 TIMES their earnings – meaning it will take them 38 years to make back the money you invest, an interest rate of less than 2% taking inflation into account but think of what the buying power of your returned Dollars will be by then.

Of course interest rates are near zero so 2% is better than 0% you get for savings and that explains Dow 36,000 but, when you are starving on a deserted island you might eat bugs to survive – but that doesn't mean you are going to be craving bugs once the crisis has passed, does it? What will happen to investors and the decisions they make once this crisis is past? Will they still want to buy stocks at 38 times earnings?
 Just because someone will pay you $5 for a roasted cockroach today, doesn't mean they'll pay you even $1 tomorrow if the situation changes so picking the "best" of a bad batch of stocks is not the optimal strategy. At PSW, we have been sticking to stocks with much better P/E rations – generally below 20 – in the hopes that the companies who are actually making money will be able to withstand a correction better than those with runaway aspirations.
Speaking of the best of the worst, Chinese Junk Bond Rates popped to 25% this weekend as that Evergrande thing never did go away just because we stopped focusing on it. When the current rate of bonds goes to 25%, the old bonds, which pay less interest, lose value and the average Chinese bondholder has now lost 1/3 of their value on bonds held. That can lead to more panic and more selling and even higher rates
 What began early this summer as a confidence crisis around industry giant China Evergrande Group has spread to numerous real-estate firms that are now at much higher risk of reneging on their debt. At least four developers have defaulted on dollar bonds since September with rates already climbing near the peak they hit during the last financial crisis – when we also ignored the warning signs from China just before the whole World went off a cliff.
That last peak was March of 2009, when we were well into the crisis, which had been obvious to everyone since October. Oblivious is more the word I'd use to describe the current investor mindset.
The surging yields imply very high default risks, and are themselves adding to developers’ problems, by making it hard or impossible for companies to refinance by issuing new debt. “It is a surprise how much even high-quality companies are being impacted,” said Jim Veneau, head of fixed income for Asia at AXA Investment Managers. “There’s no doubt that market distress is starting to become a factor in and of itself for companies,” he added.
For example, Shunaio Group Holdings wrote in a note to clients, cutting targets to about 290 billion yuan, the equivalent of about $45.3 billion, from an earlier target of 330 billion yuan. Shimao’s $1 billion, 5.6% bond due 2026 was quickly quoted at less than 65 cents on the dollar on Monday afternoon in Hong Kong, according to Tradeweb, down from about 88 cents a week earlier. Recent company data has shown that a brutal downturn in sales, already evident in September, extended into October for many developers.
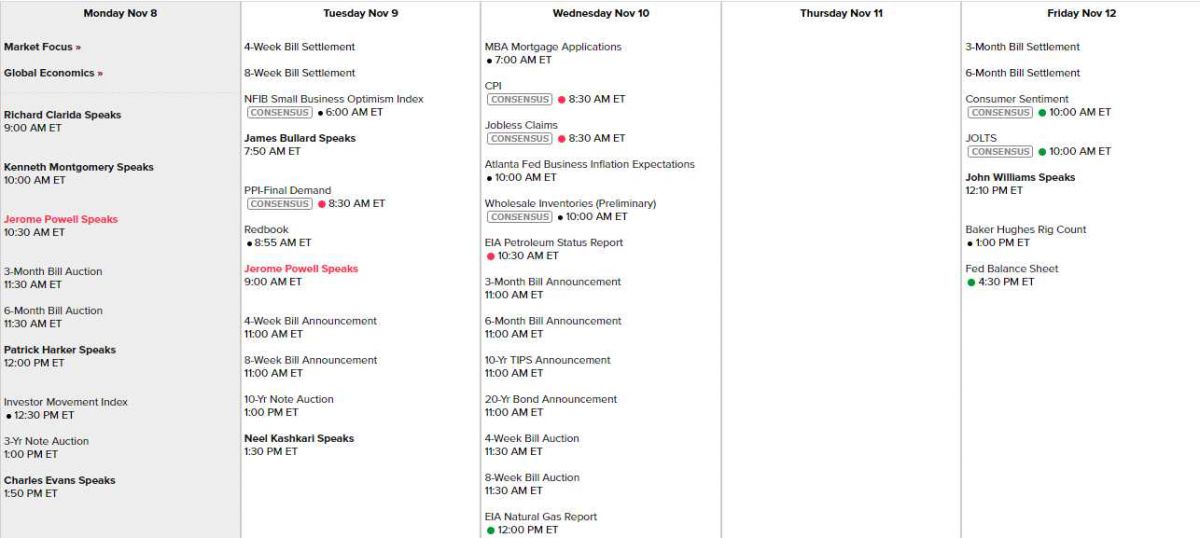
But fear not as Jerome Powell is speadking at 10:30 this morning but it's a conference on Gender and the Economy, so we don't expect anything shocking there. Clarida goes at 9, Montgomery at 10 on a timely titled "The Implications of High Leverage for Financial Instability Risk, Real Economic Activity, and Appropriate Policy Responses" and then Harker give Economic Outlook at noon with Evans speaking at 1:50. Only 4 more speeches the rest of the week and very little data with Thursday being a sort-of holiday (Veterans Day):
 And, of course, the earningspalooza continues:
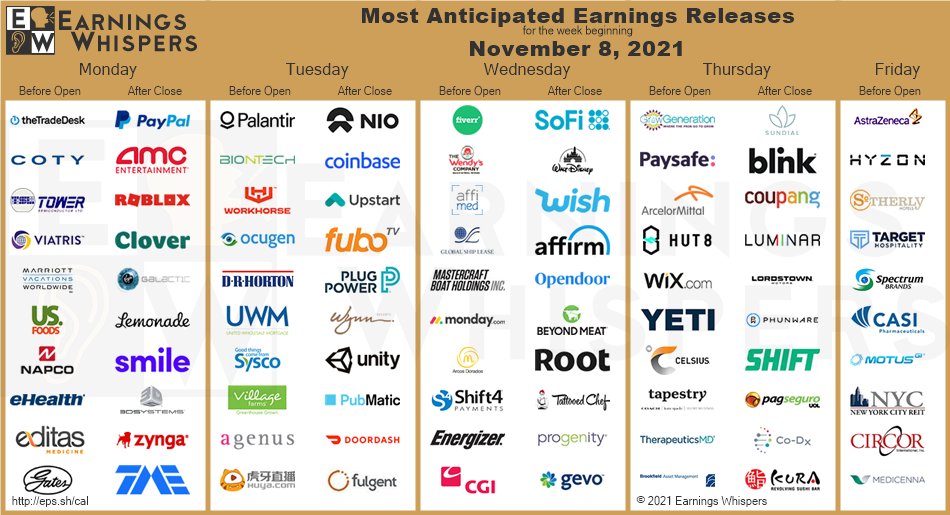
With 400 of the 500 S&P companies reporting so far, results are generally up about 40% from last year but those are easy comps when, in fact, we're barely back to the earnings we had in 2019, but the market is PRICED 30% higher than it was at the time. Like all inflation – we are simply paying more money for the same or less earnings and you'd better make sure that is one tasty-looking cockroach you are buying because, eventually – you are going to have to convince someone else to take it off your hands…
