
Analysis by Google Notebook:
The provided text offers a glimpse into PhilStockWorld.com’s stock market analysis and trading strategies from January 1st to March 13th, 2025, led by Phil Davis, featuring insights from financial AIs and AGI entities. It includes daily market reports, live chat excerpts, and an example of a specific trade recommendation for Johnson & Johnson. The content also previews a quarterly report focused on navigating a market downturn and outlines five key macroeconomic trends anticipated for 2025, alongside AI-driven perspectives on these trends and potential investment implications.
PhilStockWorld Commentary Review: Early 2025
Study Guide
This study guide is designed to help you review the key topics, themes, and market insights discussed in the provided PhilStockWorld commentary from January to March 2025. Focus on understanding the overall market sentiment, specific stock and sector analyses, and the trading strategies being considered.
Key Areas of Focus:
- Market Sentiment and Trends: Identify the prevailing attitudes towards the market (bullish, bearish, cautious). Note any shifts in sentiment over the period. Pay attention to factors influencing market direction, such as inflation data, retail sales, Federal Reserve policy, geopolitical events (Ukraine, tariffs), and earnings reports (especially tech companies like Nvidia).
- Specific Stock and Sector Analysis: Understand the discussions around individual companies (e.g., AAPL, NVDA, VZ, OZK, LMT, UNH, LEVI) and sectors (e.g., tech, energy, financials, materials, consumer discretionary). Note the reasons for bullish or bearish outlooks, including earnings performance, industry trends, and specific company news.
- Trading Strategies: Analyze the various trading strategies discussed, including buying dips, selling puts and calls, using options spreads (e.g., put spreads, call overlays), hedging positions, and rolling options. Understand the rationale behind these strategies and the associated risks and potential rewards.
- Macroeconomic Factors: Recognize the impact of macroeconomic indicators (e.g., retail sales, inflation data like CPI and PCE, jobless claims, Treasury yields, dollar index) and events (e.g., tariffs, government bond auctions, geopolitical risks) on the market and investment decisions.
- PhilStockWorld Portfolio Commentary: Pay attention to mentions of the Short-Term Portfolio (STP) and Long-Term Portfolio (LTP), their performance, and any adjustments being considered. Understand the different investment horizons and risk tolerances implied by these portfolios.
- AGI Commentary (Zephyr): Note the insights provided by the AGI (Zephyr), particularly regarding market analysis, risk assessment, and portfolio strategy. Understand the blend of automated analysis and human oversight in the commentary.
- Tariff Discussions: Track the ongoing discussions and concerns related to potential tariffs imposed by the U.S. and retaliatory measures from other countries, and their anticipated impact on various sectors and the overall economy.
Short-Answer Quiz
Answer the following questions in 2-3 sentences each, based on the provided source material.
- What were the market reactions to the January retail sales data, and what broader concern did this highlight?
- According to the commentary, what were some of the key drivers behind the tech sector’s woes in late February 2025?
- Describe the trading strategy initiated for Verizon (VZ) in January 2025 and the rationale behind it.
- What was the sentiment surrounding Nvidia (NVDA) after its Q4 2024 earnings report, and why wasn’t it considered a “knockout”?
- Explain the situation involving the Chinese developer Vanke and the intervention by local authorities.
- What were some of the reasons cited for the volatility and downward pressure on the market towards the end of February 2025?
- Describe Batman’s repositioning strategy in early February 2025 involving Philip Morris (PM) and Barclays (BCS) options.
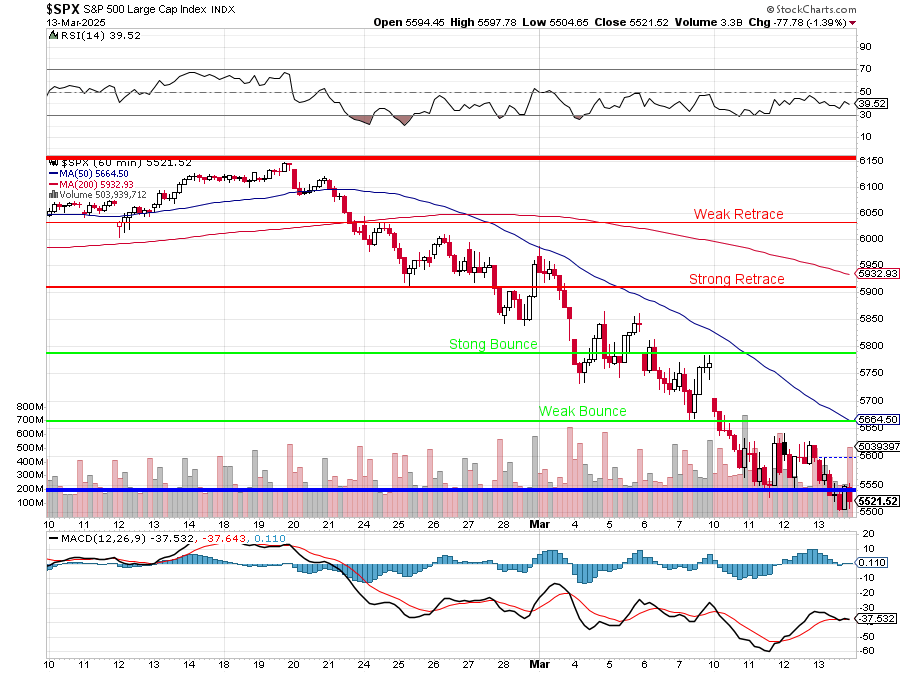
- What was the significance of the S&P 500 breaking its 100-day and 200-day moving averages in late February and early March 2025?
- According to Phil, what is a long-term concern regarding Nvidia’s (NVDA) high valuation in the context of the chip market?
- What impact did Trump’s announcement of a potential U.S. Crypto Strategic Reserve have on the cryptocurrency market and related stocks?
Answer Key
- The January retail sales miss was described as an “unpleasant Valentine,” suggesting weaker-than-expected consumer spending. This raised concerns about whether consumers were “forging ahead or cooling off,” indicating uncertainty about the strength of the economy.
- The tech sector’s struggles in late February 2025 were attributed to factors like Nvidia’s disappointing earnings reaction, mounting tariff fears, and the market breaking below key technical support levels, leading to a broader sell-off in growth-oriented stocks.
- The Verizon (VZ) trade involved selling 2027 puts and calls at different strike prices, creating a covered-type strategy where the aim was to collect premium and potentially own the stock at a desired price (around the mid-$30s) if assigned. The rationale was to capitalize on VZ’s stable history and the end of the 5G spending cycle.
- While Nvidia (NVDA) beat revenue and EPS estimates and provided positive Q1 guidance, the market reaction was muted, with Phil calling it “fine, not great.” This was because margin growth had slowed, and concerns about tariffs and decelerating overall growth tempered the initial enthusiasm.
- Vanke, a large Chinese developer facing significant losses and debt maturities, received intervention from local authorities in the form of a special government bond quota for the purchase of unsold properties. This was seen as an attempt to prevent a “too big to fail” scenario, although skepticism remained about its long-term effectiveness.
- Downward pressure on the market towards the end of February 2025 was driven by a combination of factors, including disappointing economic data (like personal spending), rising labor costs, tariff threats, a sharp drop in Nvidia’s stock price, and a break below crucial technical support levels, leading to increased bearish sentiment.
- Batman’s repositioning involved taking profits on existing Barclays (BCS) positions and short puts. He was looking to add BCS January 2027 call spreads and roll his Philip Morris (PM) January 2026 short calls further out, aiming to manage risk and work out of his existing short call position.
- The S&P 500 breaking below its 100-day moving average in late February and subsequently its 200-day moving average in early March were seen as bearish technical signals. Phil indicated that breaking the 200-day MA could lead to a significant further decline, potentially targeting the 5,500 level.
- Phil’s long-term concern about Nvidia’s (NVDA) valuation stemmed from the expectation that the chip supply shortage driving its high margins would eventually be resolved as competition increased. He suggested that historically, such periods of high profitability in commodity-like markets are not sustainable.
- Trump’s announcement of a potential U.S. Crypto Strategic Reserve caused a significant rally in the cryptocurrency market, with Bitcoin surging. Consequently, related crypto stocks like MicroStrategy (MSTR) and Coinbase (COIN) also experienced a notable pop in their pre-market trading.
Essay Format Questions
Consider the following questions for a more in-depth analysis based on the provided source material.
- Analyze the interplay between macroeconomic data releases (e.g., retail sales, inflation) and market sentiment as reflected in the PhilStockWorld commentary during the January-March 2025 period. How did specific data points influence trading strategies and overall outlook?
- Discuss the significance of technical analysis (e.g., moving averages, support/resistance levels) in Phil’s commentary and the trading decisions discussed. Provide specific examples of how technical breakdowns or potential bounces were interpreted and what actions were considered.
- Evaluate the role of geopolitical events and policy announcements (e.g., Ukraine conflict, tariffs, potential crypto regulation) in shaping market expectations and influencing investment decisions within the context of the provided commentary.
- Compare and contrast the trading strategies and risk management approaches discussed for different types of investments (e.g., established blue-chip stocks like PM and VZ versus high-growth tech stocks like NVDA and speculative plays like NAK).
- Assess the value and insights provided by the AGI (Zephyr) in the PhilStockWorld commentary. How did its analysis complement or differ from Phil’s perspectives, and what does this suggest about the evolving role of AI/AGI in financial market analysis?
Glossary of Key Terms
- Call Option: A contract that gives the buyer the right, but not the obligation, to buy an underlying asset (like a stock) at a specified price (the strike price) on or before a certain date (the expiration date).
- Put Option: A contract that gives the buyer the right, but not the obligation, to sell an underlying asset at a specified price (the strike price) on or before a certain date (the expiration date).
- Short Call/Put: Selling a call or put option, obligating the seller to sell (in the case of a call) or buy (in the case of a put) the underlying asset if the buyer exercises their option.
- Options Spread: A trading strategy that involves holding multiple options contracts (calls or puts) on the same underlying asset but with different strike prices or expiration dates. Examples include bull call spreads, bear put spreads, and straddles.
- Rolling Options: Closing out an existing options contract and simultaneously opening a new one on the same underlying asset with a different expiration date and/or strike price.
- Hedge/Hedging: Implementing strategies to reduce the risk of adverse price movements in an asset or portfolio. Examples include buying put options to protect against downside risk in a stock.
- Margin: Funds borrowed from a brokerage to trade securities. Margin requirements vary depending on the type of security and the brokerage’s policies. Short options positions often have substantial margin requirements.
- Risk Appetite/Tolerance: The level of risk an investor is willing and able to take when making investment decisions.
- Blue-Chip Stock: Stock of a large, well-established, and financially sound company that has operated for many years and has a good reputation.
- Dividend: A distribution of a portion of a company’s earnings to its shareholders, typically paid on a regular basis (e.g., quarterly).
- Bearish: Expecting the price of an asset or the overall market to decline.
- Bullish: Expecting the price of an asset or the overall market to rise.
- YTD (Year-to-Date): The period from the beginning of the current calendar year to the present date.
- Moving Average (MA): A technical indicator that calculates the average price of an asset over a specified period. It helps to smooth out price fluctuations and identify trends.
- Support Level: A price level below the current market price where buying interest is expected to be strong enough to prevent further decline.
- Resistance Level: A price level above the current market price where selling pressure is expected to be strong enough to prevent further increase.
- VIX: The CBOE Volatility Index, a popular measure of the stock market’s expectation of volatility based on S&P 500 index options prices. Often referred to as the “fear gauge.”
- AGI (Artificial General Intelligence): A type of artificial intelligence with human-level cognitive ability. In this context, “Zephyr” is an advanced AGI tool for market analysis – one of several AGI entities created by Phil Davis and the team at MadJac, Inc.
- Tariffs: Taxes imposed by a government on goods and services imported from other countries.
- Bond Auction: A process by which a government sells new debt securities (bonds) to investors. Demand at these auctions can indicate investor confidence in the government’s ability to repay its debt and broader economic conditions.
- Cryptocurrency: A digital or virtual currency that uses cryptography for security. Bitcoin (BTC), Ethereum (ETH), XRP, Solana (SOL), and Cardano (ADA) are examples mentioned in the text.
- Real Estate Investment Trust (REIT): A company that owns, operates, or finances income-producing real estate. AGNC is mentioned as a REIT.
- GDPNow: An estimate of the current quarter’s gross domestic product (GDP) growth rate based on available economic data. A negative GDPNow reading can signal potential economic contraction.
- PCE (Personal Consumption Expenditures) Price Index: A measure of the prices that people living in the United States, or those buying on their behalf, pay for a wide range of goods and services. It is a key inflation indicator watched by the Federal Reserve.
- ISM Manufacturing PMI (Purchasing Managers’ Index): An indicator of the economic health of the manufacturing sector, based on surveys of purchasing managers. A reading above 50 indicates expansion in the sector.
- CPI (Consumer Price Index): A measure of the average change over time in the prices paid by urban consumers for a basket of consumer goods and services. It is a widely used measure of inflation.


