
This morning, the Nasdaq is down 1.5% as NVDA announced they will be taking a MASSIVE $5.5Bn Quarterly charge relating to the cost of new EXPORT restrictions as the US Government (Boo! Hiss!) has implemented new licensing requirements for the export of GPUs to China and other nations – EVEN the older H2O units. This has sent NVDA down 6% pre-market, dragging the Nasdaq down with it as 6% of NVIDIA is $160Bn!
Face it, you can’t trust the Government, you can’t trust the media, you can’t trust the courts to enforce trade agreements, contracts – not even personal freedoms. Like I said – Russia!
The markets are a mess, and today’s line-up of data and earnings could either steady the ship or capsize it entirely. Tariffs are looming like a dark cloud, earnings season is revving up and global jitters are sending investors scrambling – we’ve got a front-row seat to a financial thriller!
Tax Day (today) swoops in like a liquidity-draining shark. As US taxpayers fork over their dues, the Treasury General Account balloons, and reserve balances shrink. History tells us this can rattle markets:
-
-
2022: The S&P 500 took a massive dive.
-
2023: Sideways choppiness ruled the day.
-
2024: S&P dropped 300 points in a week.
-
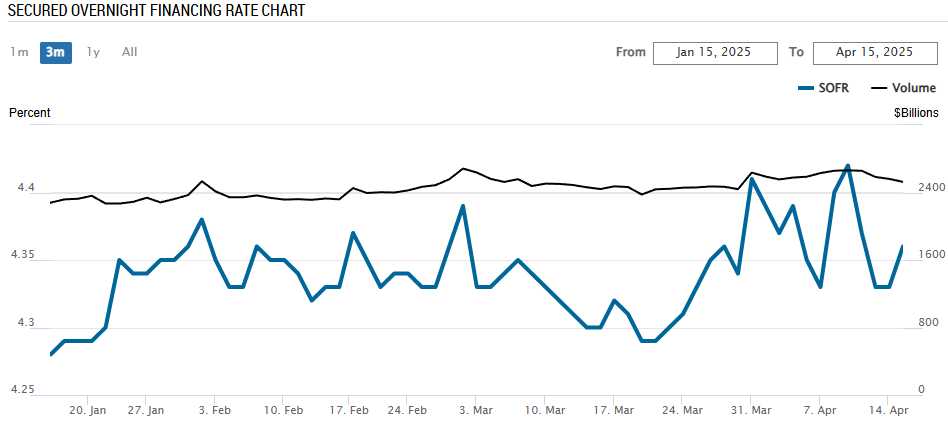
This year, with the Treasury General Account at its lowest since spring 2023, the Secured Overnight Financing Rate (SOFR) is our canary in the coal mine. A spike here could signal tighter conditions and more turbulence ahead so we’ll keep an eye on that as it’s already at an elevated level:
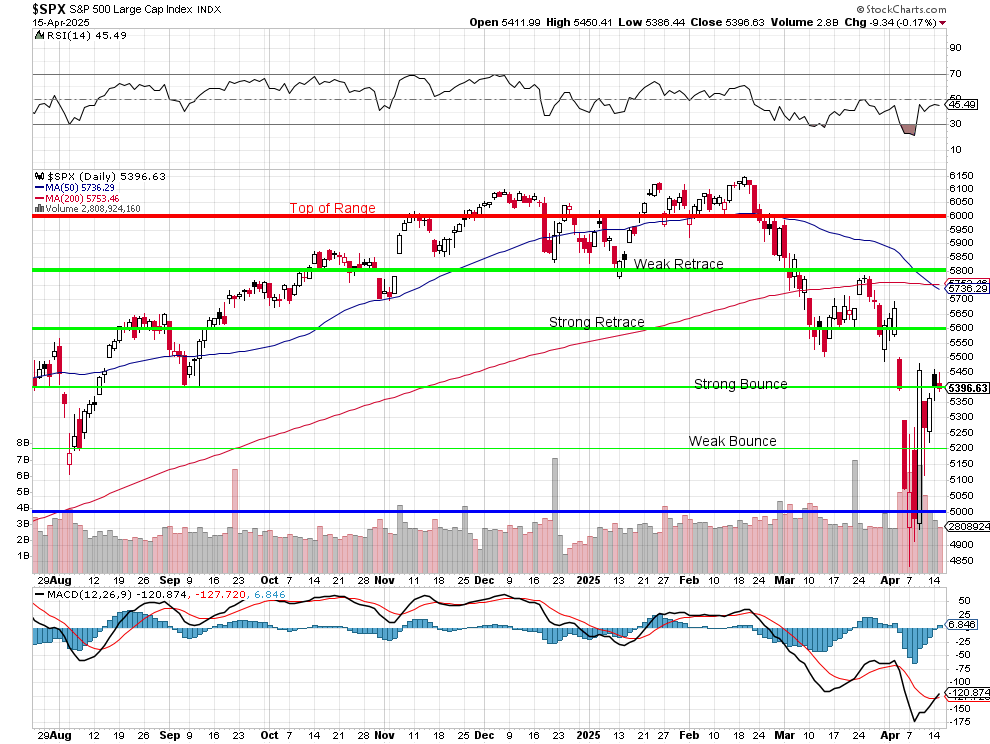
The S&P 500’s 50-day moving average slipped below its 200-day moving average yesterday, flashing the dreaded Death Cross signal. It’s a bearish signal that’s got technicians clutching their charts, but only 46% of these crosses have led to deeper losses, historically. It’s just another cliffhanger before the next market act as we get hung up at the Strong Bounce Line.
And, of course, Earnings Season is here, and it’s a high-stakes poker game where companies are forced to show their cards. The Big Banks kicked things off Friday, and this week’s lineup, with ASML, AA, USB and TSM today and Netflix, DHI and AXP tomorrow will set the tone. Estimates are sliding and uncertainty has been turned up to 11 and it won’t take much to re-panic the market.
Analysts still are STILL pegging 2025 Earnings Growth at 8-10% and those estimates will HAVE to come down BUT a real recession could flip that to a 10-15% drop – THAT is VERY SCARY!!!
 The rest of the world is hitting the eject button on U.S. assets, dumping Dollars and Treasuries. Where is the money going when America turns into Russia? Well, the Russian ruble is this year’s top currency at the moment (up 38%). Putin wins again! (that’s right, Lent is over)
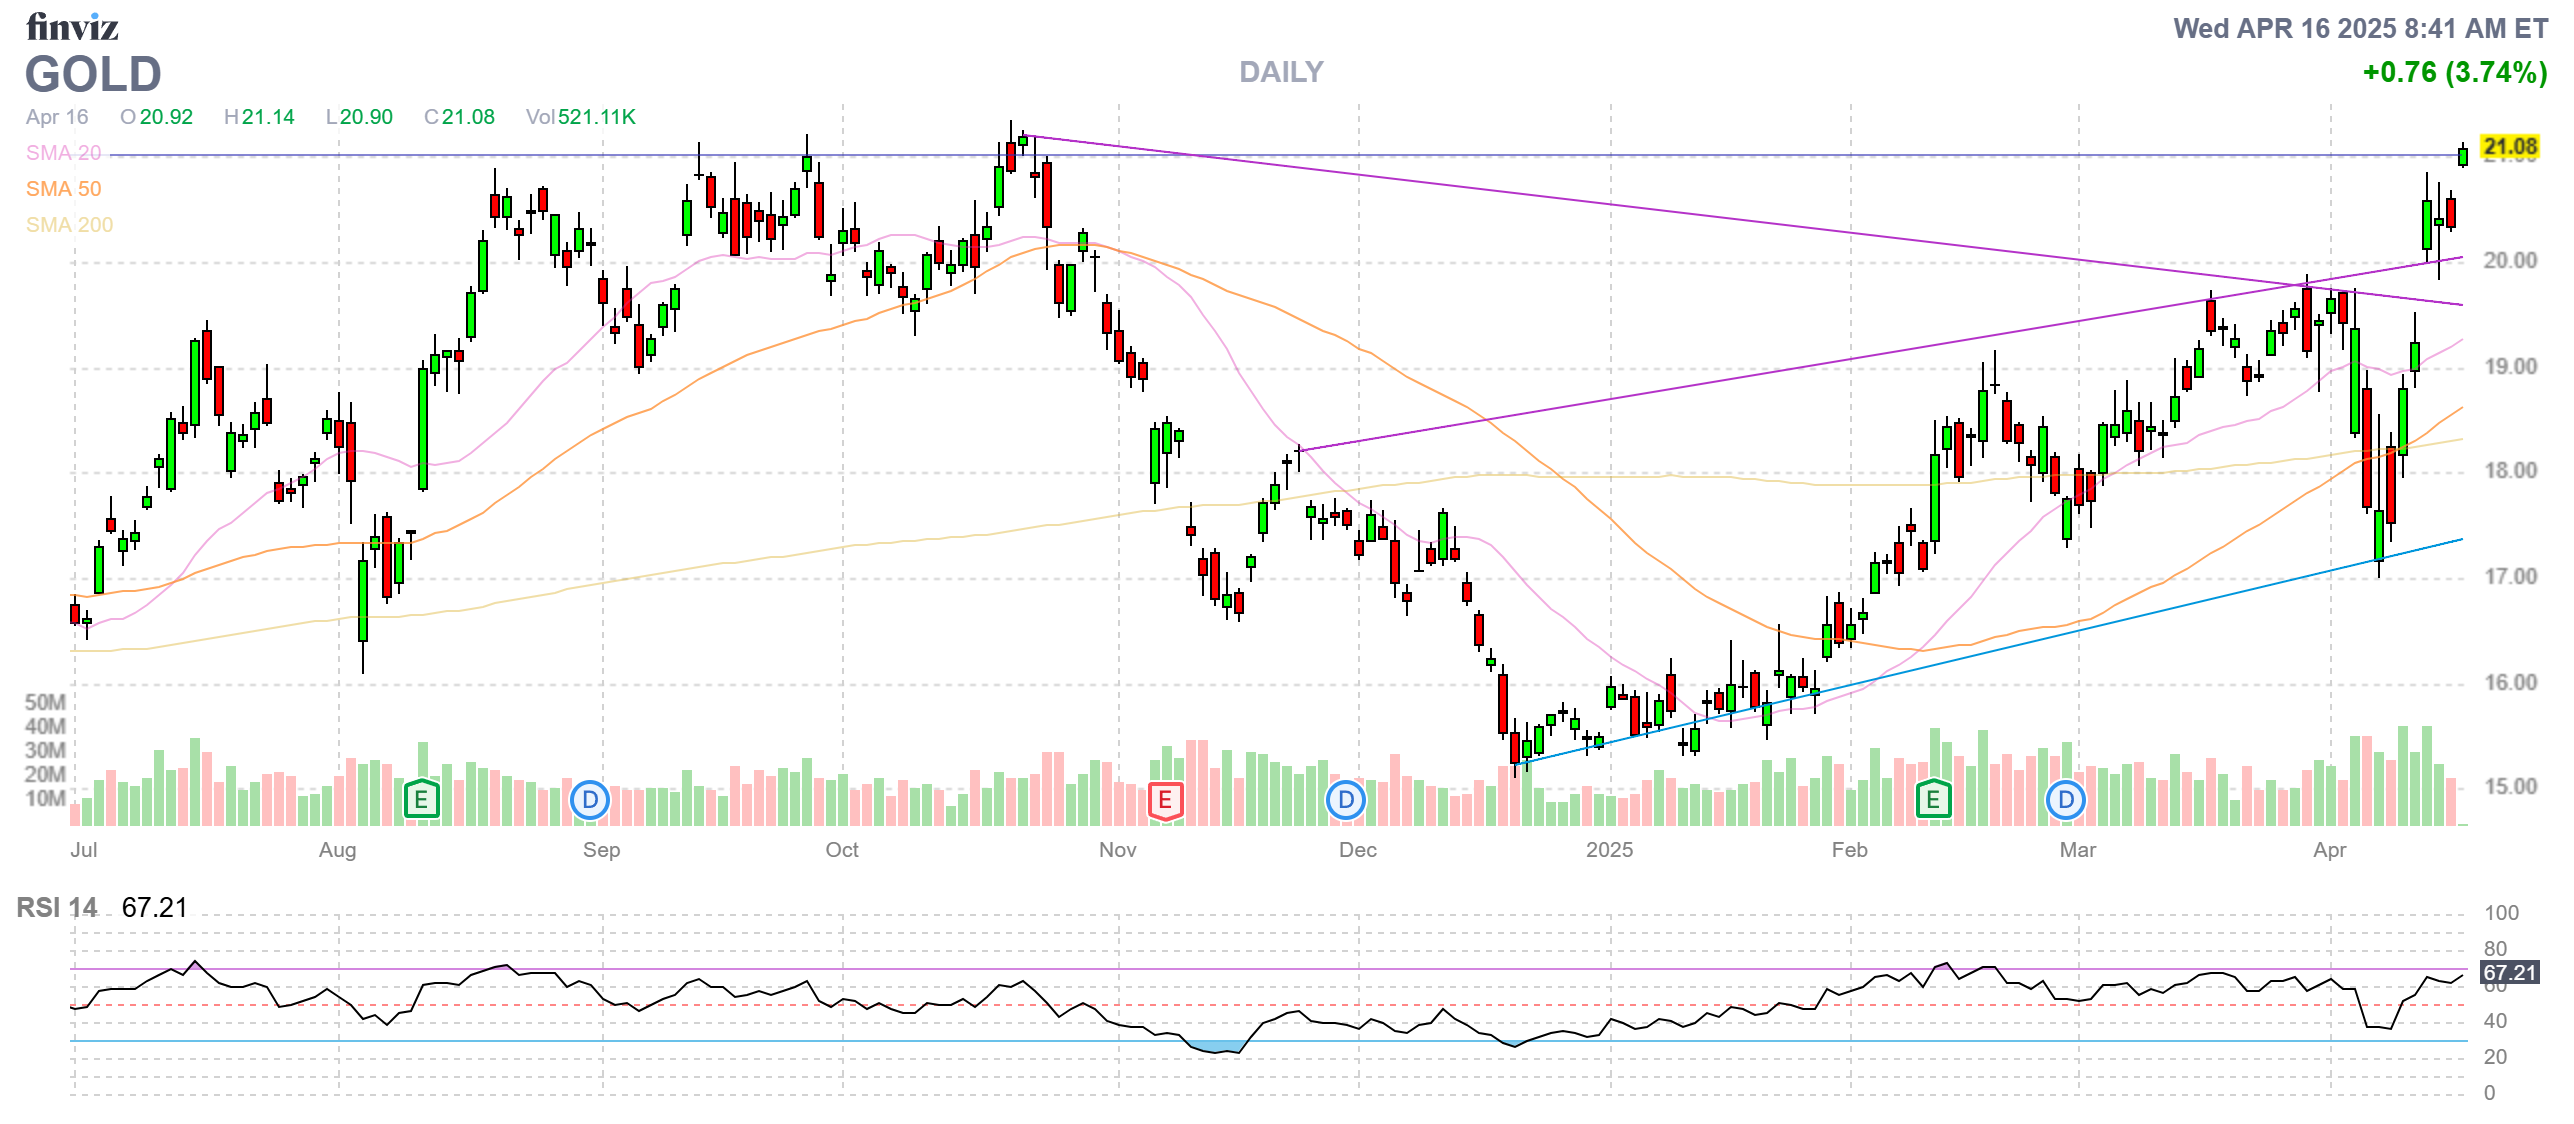
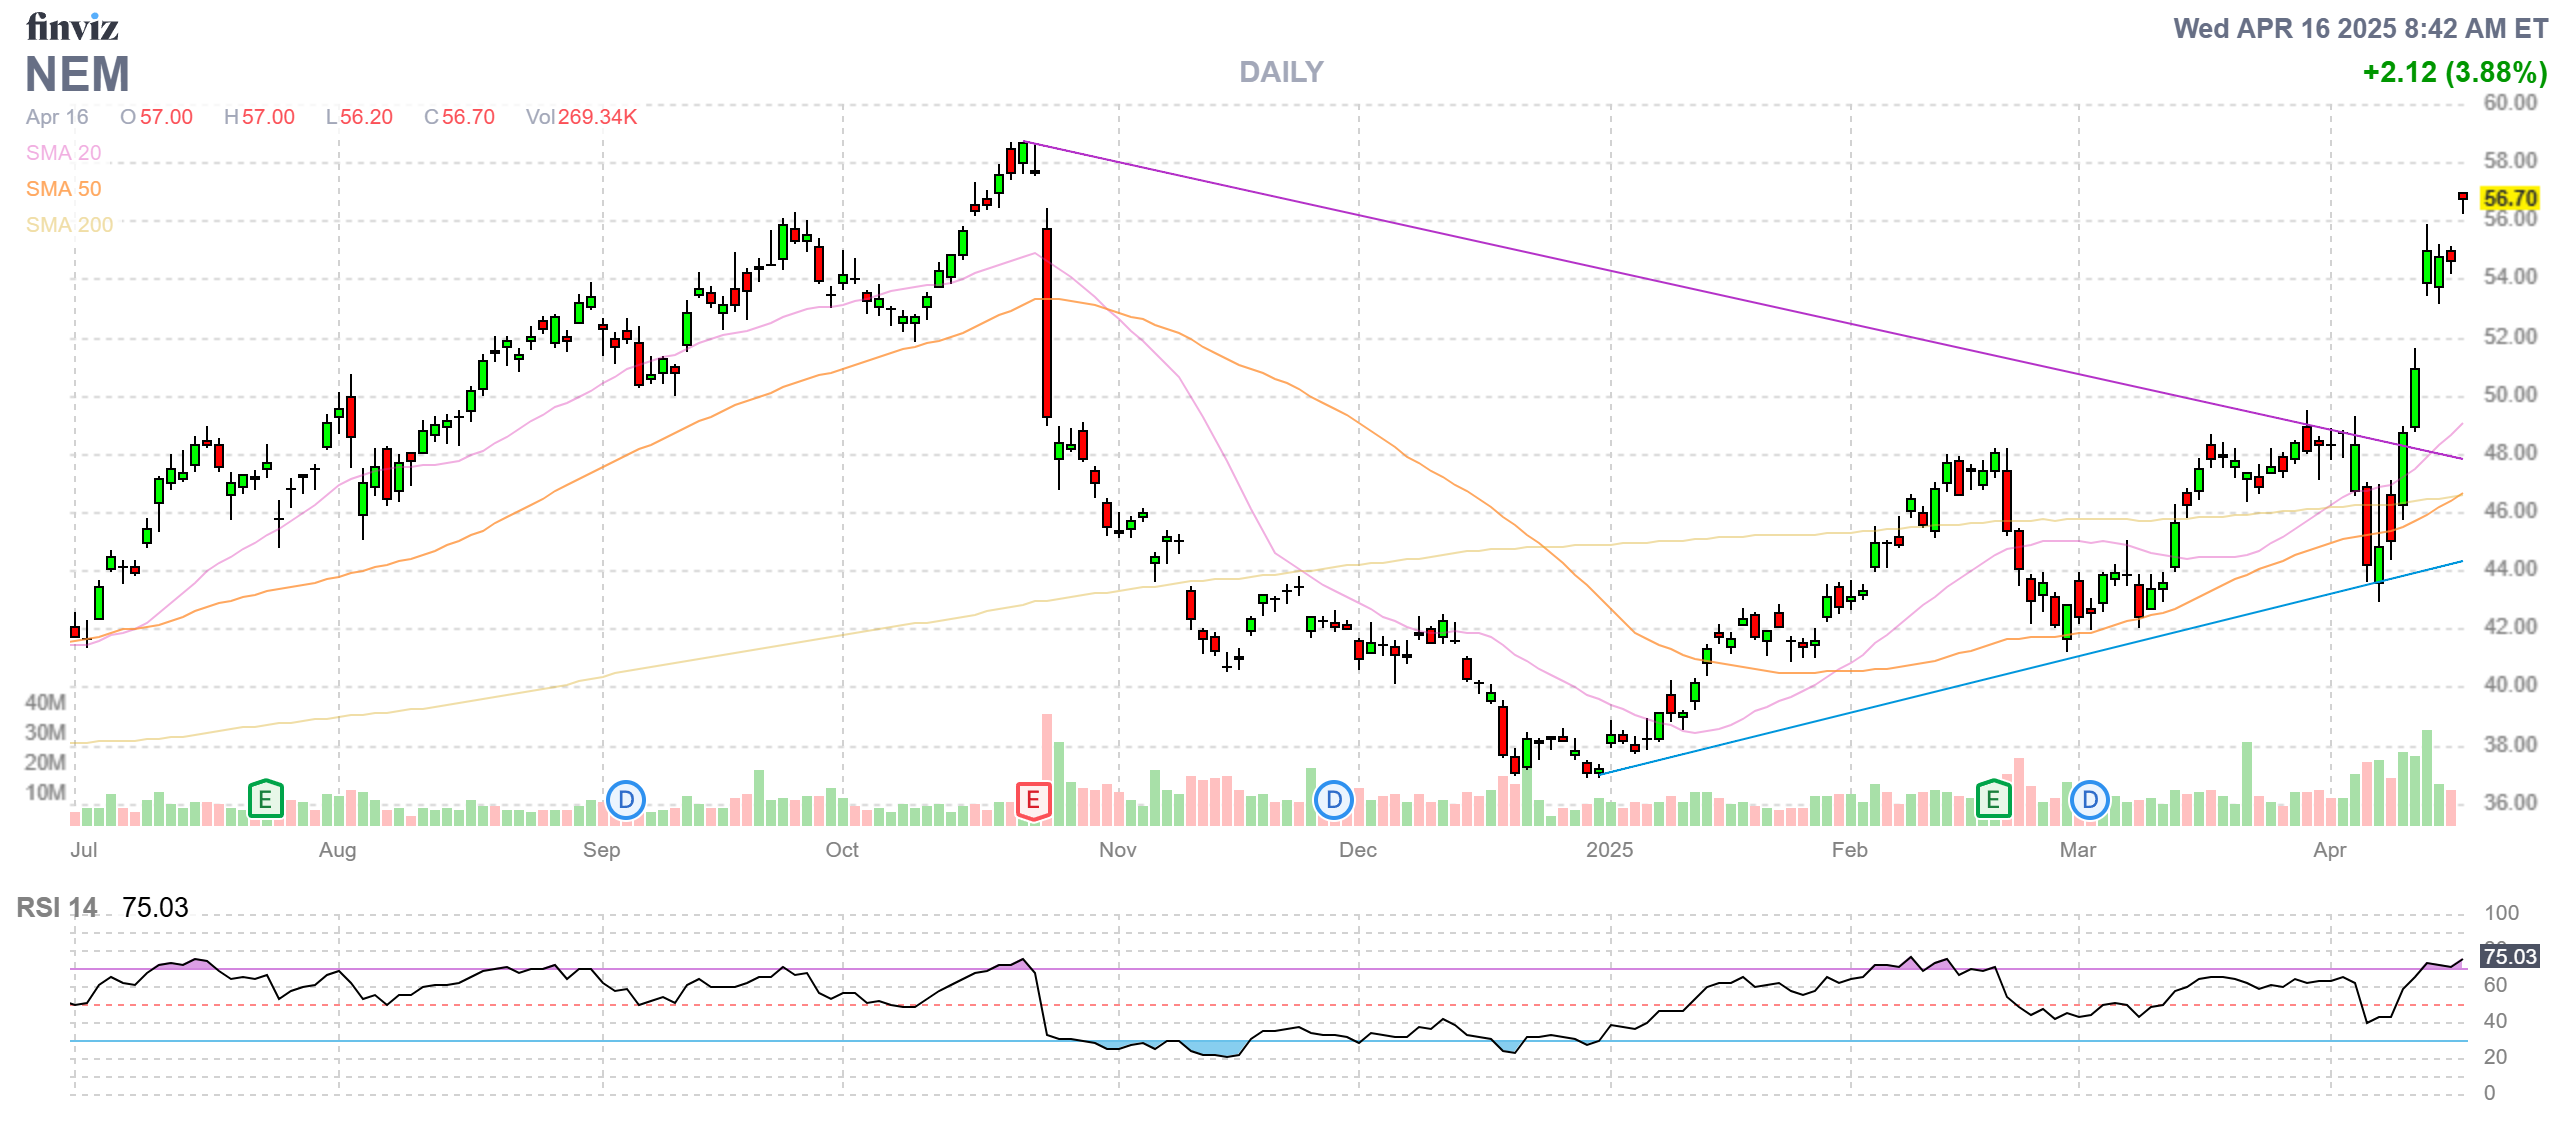
This flight to safety screams unease. Trump’s tariff flip-flops (90-day delays and tech exemptions) gave markets a brief breather, but the underlying tension persist. Gold miners are outperforming the metal itself, hinting Western investors are finally waking up. Keep an eye on these safe havens; they’re telling a story the dollar won’t.
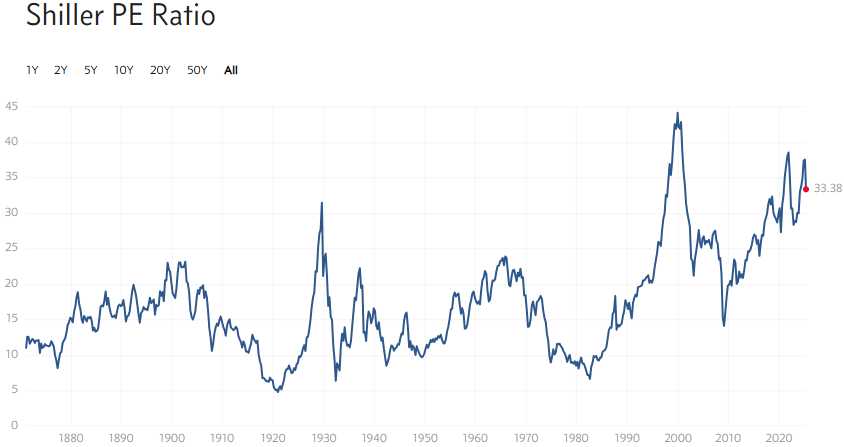
Despite an 8% YTD drop, the S&P 500 is STILL floating in bubble territory. The Shiller PE ratio sits at 33, DOUBLE its historical average of 17 – and that’s assuming the rosy outlook of unadjusted earnings! Reality Check: tariffs can pop this bubble quickly:
Take Apple, for example. Moving production from China to the U.S. could cost Billions, slashing profits by up to 50% for the transition. A Million U.S. workers at $60,000 each equals $60Bn vs. $30Bn they pay to Foxconn or 25% of AAPL’s $125Bn pre-tax earnings. AAPL is trading at 26 times $108Bn net profit so drop that to $78Bn and call it 18x and we’re down to $1.4Tn – 50% below the current $202/share price!
Globalization’s unraveling could drag margins and multiples down across the board.
 Investors are still whistling past the graveyard, chasing every 10% dip like it’s a Black Friday sale. But in this market, that could lead you straight into an unmarked grave. The buy-the-dip playbook has worked for a decade but now the rules are changing by the hour. Structural risks are piling up: Tariffs, Debt, Leverage, and Policy Chaos. Buffett’s has been hoarding $360 billion in CASH!!! for a reason and, though we hedged the crap out of our portfolios – they’ve taken a pounding in the past month (see our Portfolio Reviews). Hedge, diversify, and maybe keep a flashlight under your pillow – this is NOT the time for blind optimism!
8:30 Update: AMD has just announced the Export controls on chips will cost them $800M for the quarter and that’s knocked their stock down 7.5% in pre-market. You can’t sell chips, you can’t buy chips – Team Trump is really trying to knock America back to the Stone Age – were we great then?
Mortgage Applications are down 8.5% for the week but Retail Sales are up 1.4% vs 1% expected and that’s miles above February’s 0.2% and ex-Auto we’re up 0.5% but that’s cooling from 0.7% last month so – mixed bag. Meanwhile, Industrial Production fell 0.3% in March and Capacity Utilization fell to 77.8% from 78.2% so we’re not even using the Factories we have – what is the point of building more?


