
Well, we were heading lower anyway.
As you can see from this chart, the S&P 500 had been falling since yesterday’s brief spike to 6,060 and now, after the 5:45 am incident, is down 63 points at 5,997 and yes, 6,000 failing is a big deal but we have to cut the S&P a break as this is an event-driven failure – we’ll have to see what sticks during the day. There SHOULD be serious support at 5,950 and, if not – then worry.
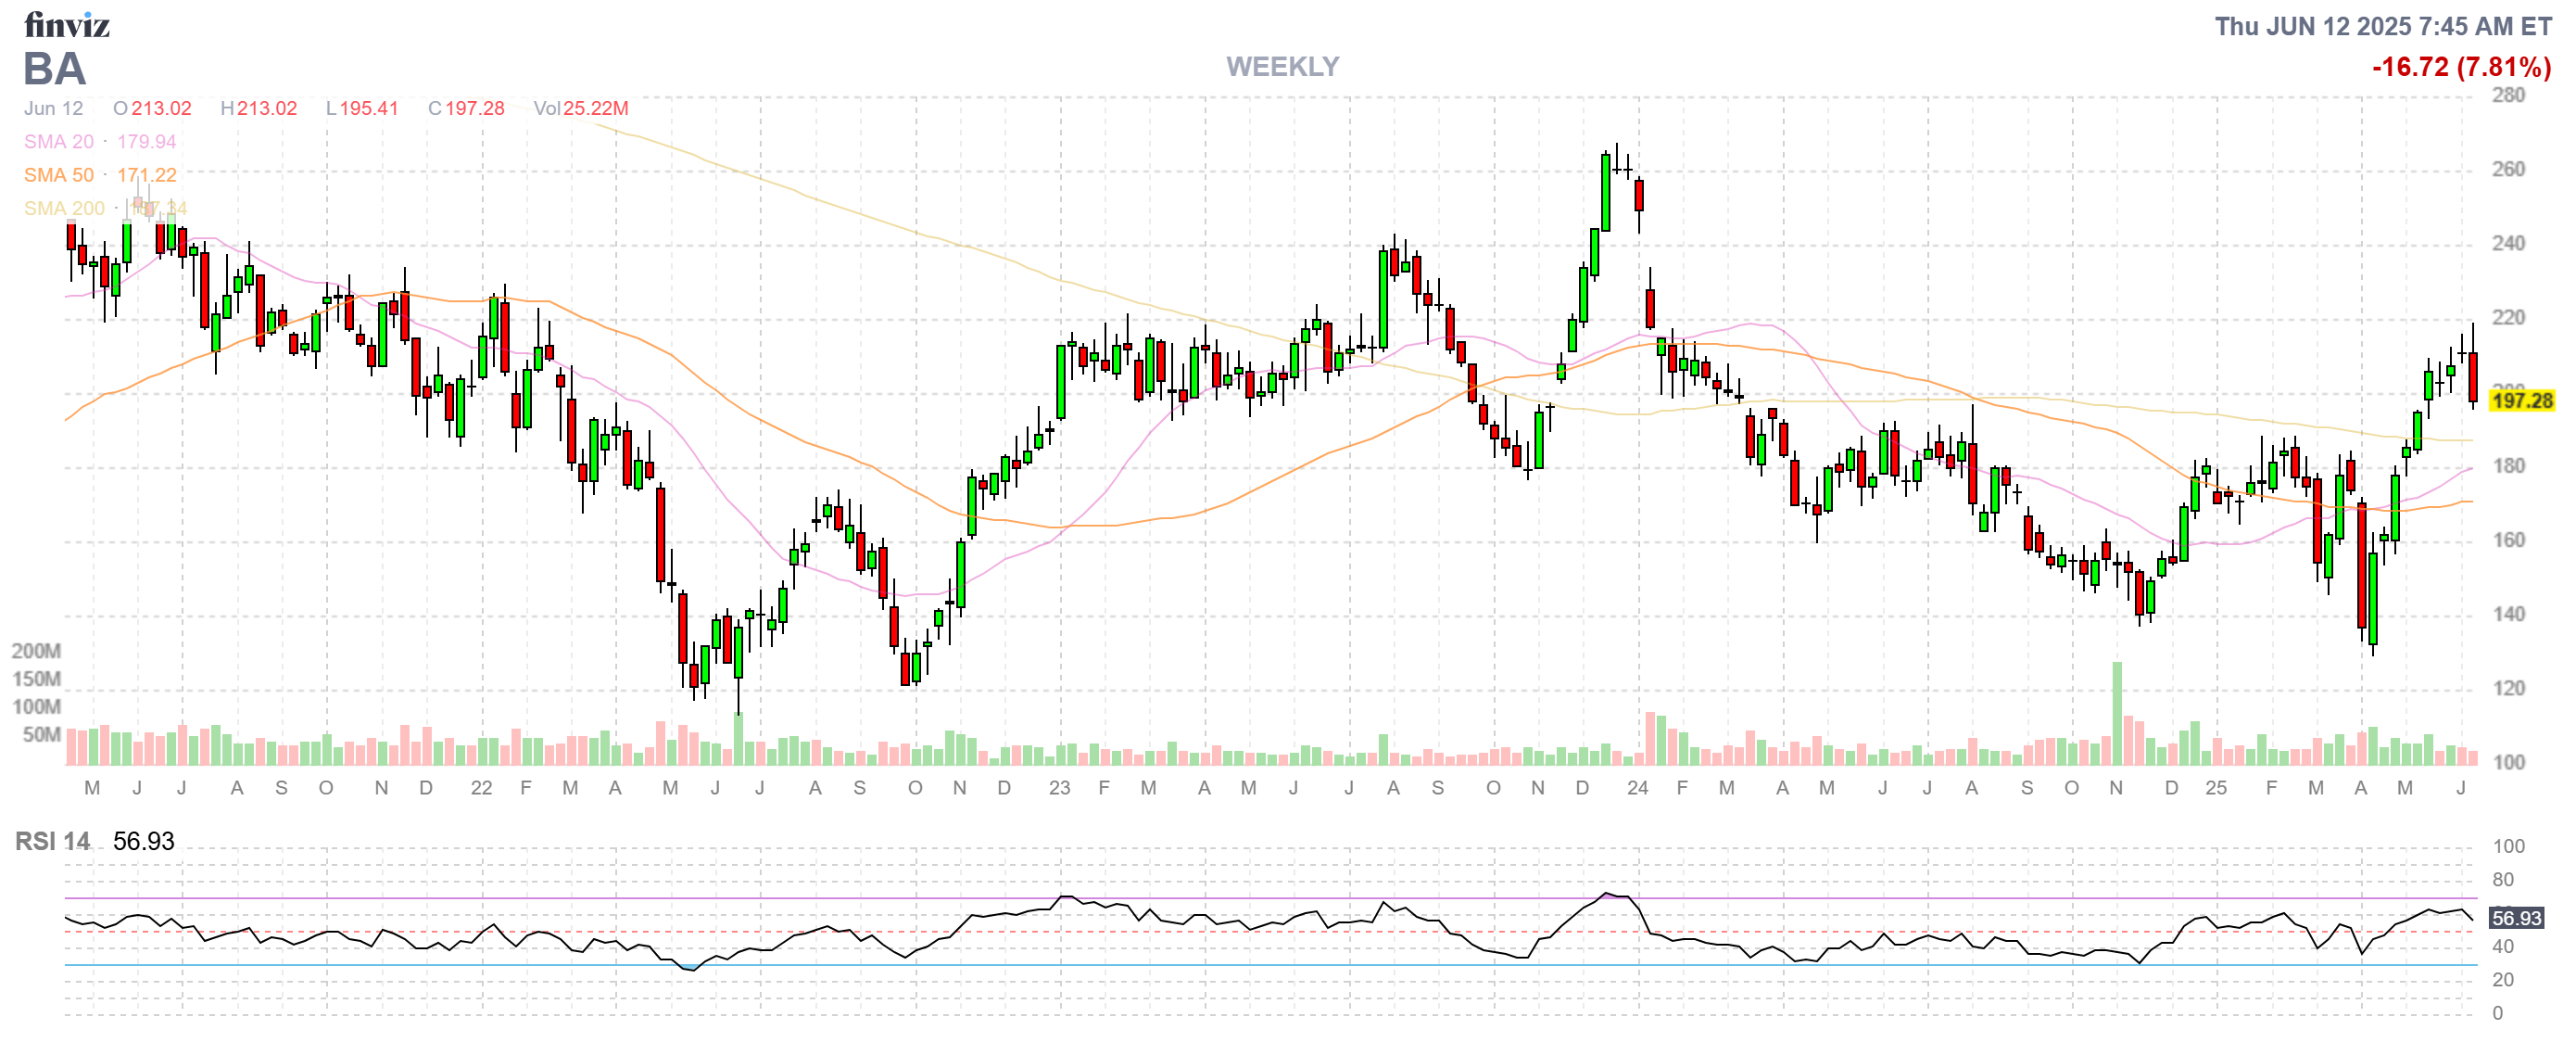
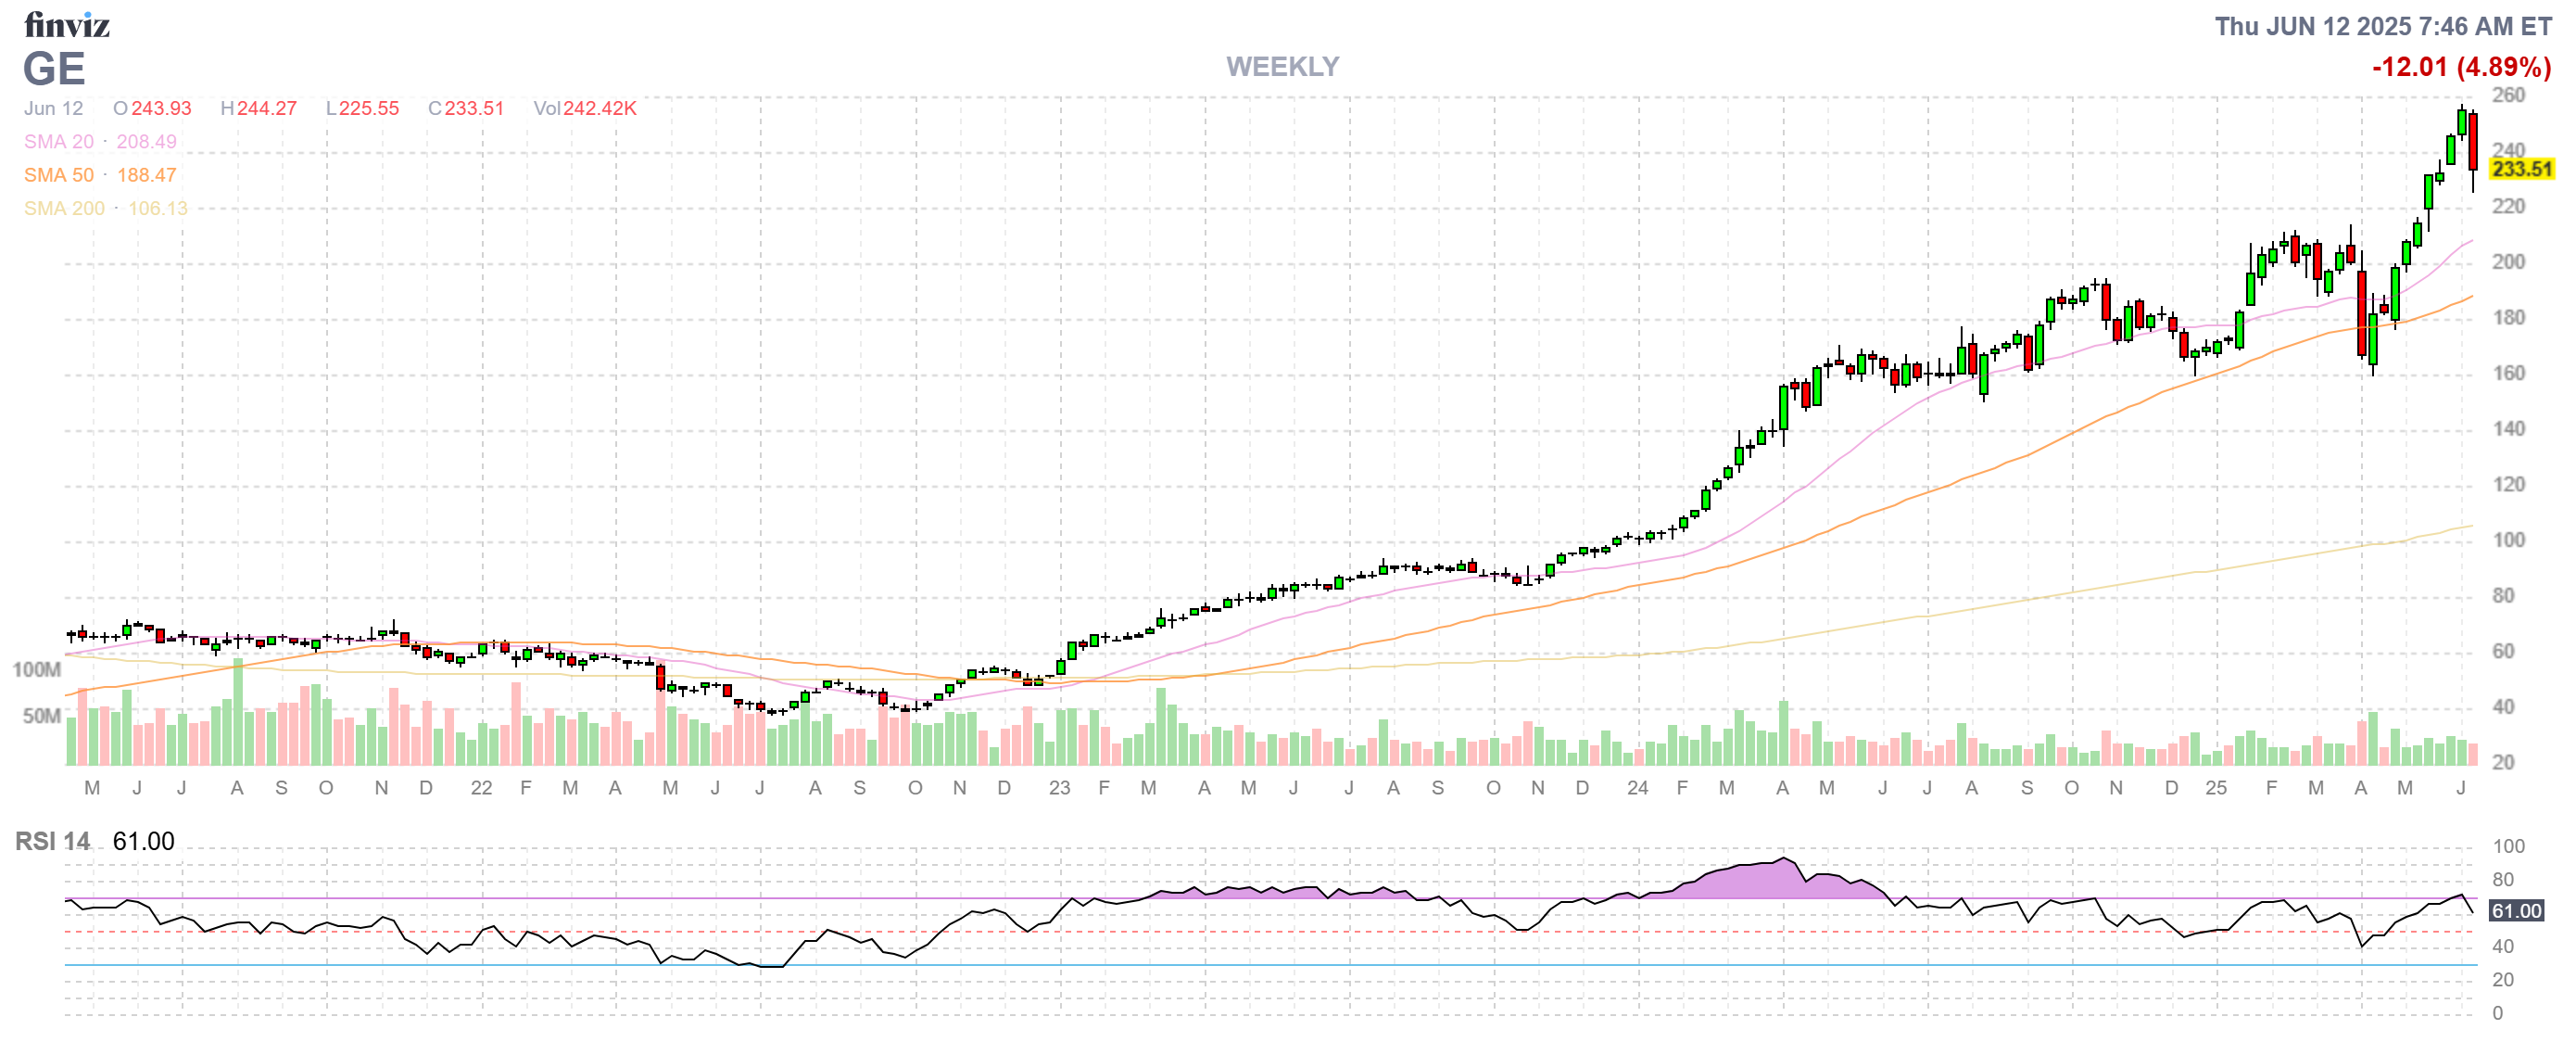
Boeing reached a deal last month with the U.S. Justice Department that would spare the company from having to take criminal responsibility for a pair of deadly 737 Max crashes in 2018 and 2019. Last year, a poorly installed panel blew away from a relatively new 737 Max while in flight. Boeing’s shares are down 8% in premarket trading along with engine-maker, GE, who are down 5%.
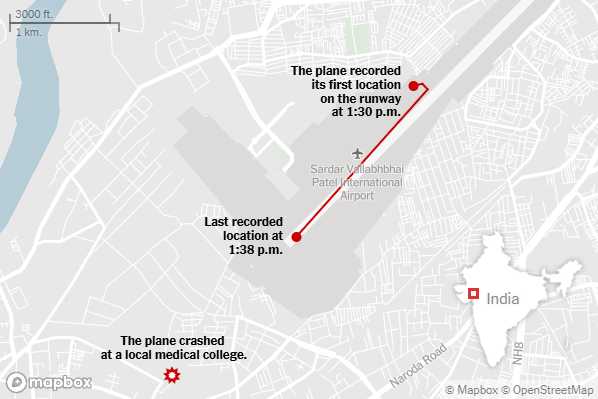
Air India, the country’s flagship carrier which is owned by the Tata Group, has worked to boost its safety record after a cluster of dangerous incidents about 15 years ago. The carrier’s previous fatal accident, before the one on Thursday, was in August 2020. An Air India Express flight from Dubai overshot the runway in Kozhikode, killing both pilots and 19 passengers.
 We certainly don’t know enough (the plane apparently lost power just after take-off) at this stage to make any guesses as to what actually happened so we’ll just keep an eye on things but, as you can see from their charts, both BA ($150Bn) and GE ($250Bn) have had huge runs recently and are far from cheap – if blame swings in either direction it can cause a much bigger pullback than what we’ve had so far.
This is the first total loss of a 787 Dreamliner since its 2011 debut. While the cause is unknown, Boeing’s recent history (door plug blowout, missing bolts) makes investors hypersensitive to BA, which is trading at 60 TIMES Free Cash Flow (NVDA trades at 50x and they are ridiculous!) while GE’s 40% YTD rally pushed its p/e to 41x versus the Industry Average p/e of 24x. Even with strong aerospace demand, a 5% drop reflects fears of guilt-by-association AND sector-wide multiple compression.
And India itself has been engaging in a rapid and accelerating expansion of its Aviation Industry – on track to add 40,000 new planes over the next decade (8% annual growth). Tragically (even more so), the plane crashed into a Medical College – killing many students as well. If preliminary findings point to pilot error or air traffic control issues, BA/GE could rebound. If mechanical or design flaws emerge, expect extended selling.
This is a high-impact, low-probability event shaking two overvalued industrials. For BA and GE, the crash is a reminder that safety concerns and political/legal risks (and we have PLENTY of these these days) can erase months of gains in hours. Broader markets should stabilize if PPI aligns with expectations (no more than 0.2%) but Boeing’s path to recovery depends on transparency and SWIFT damage control.
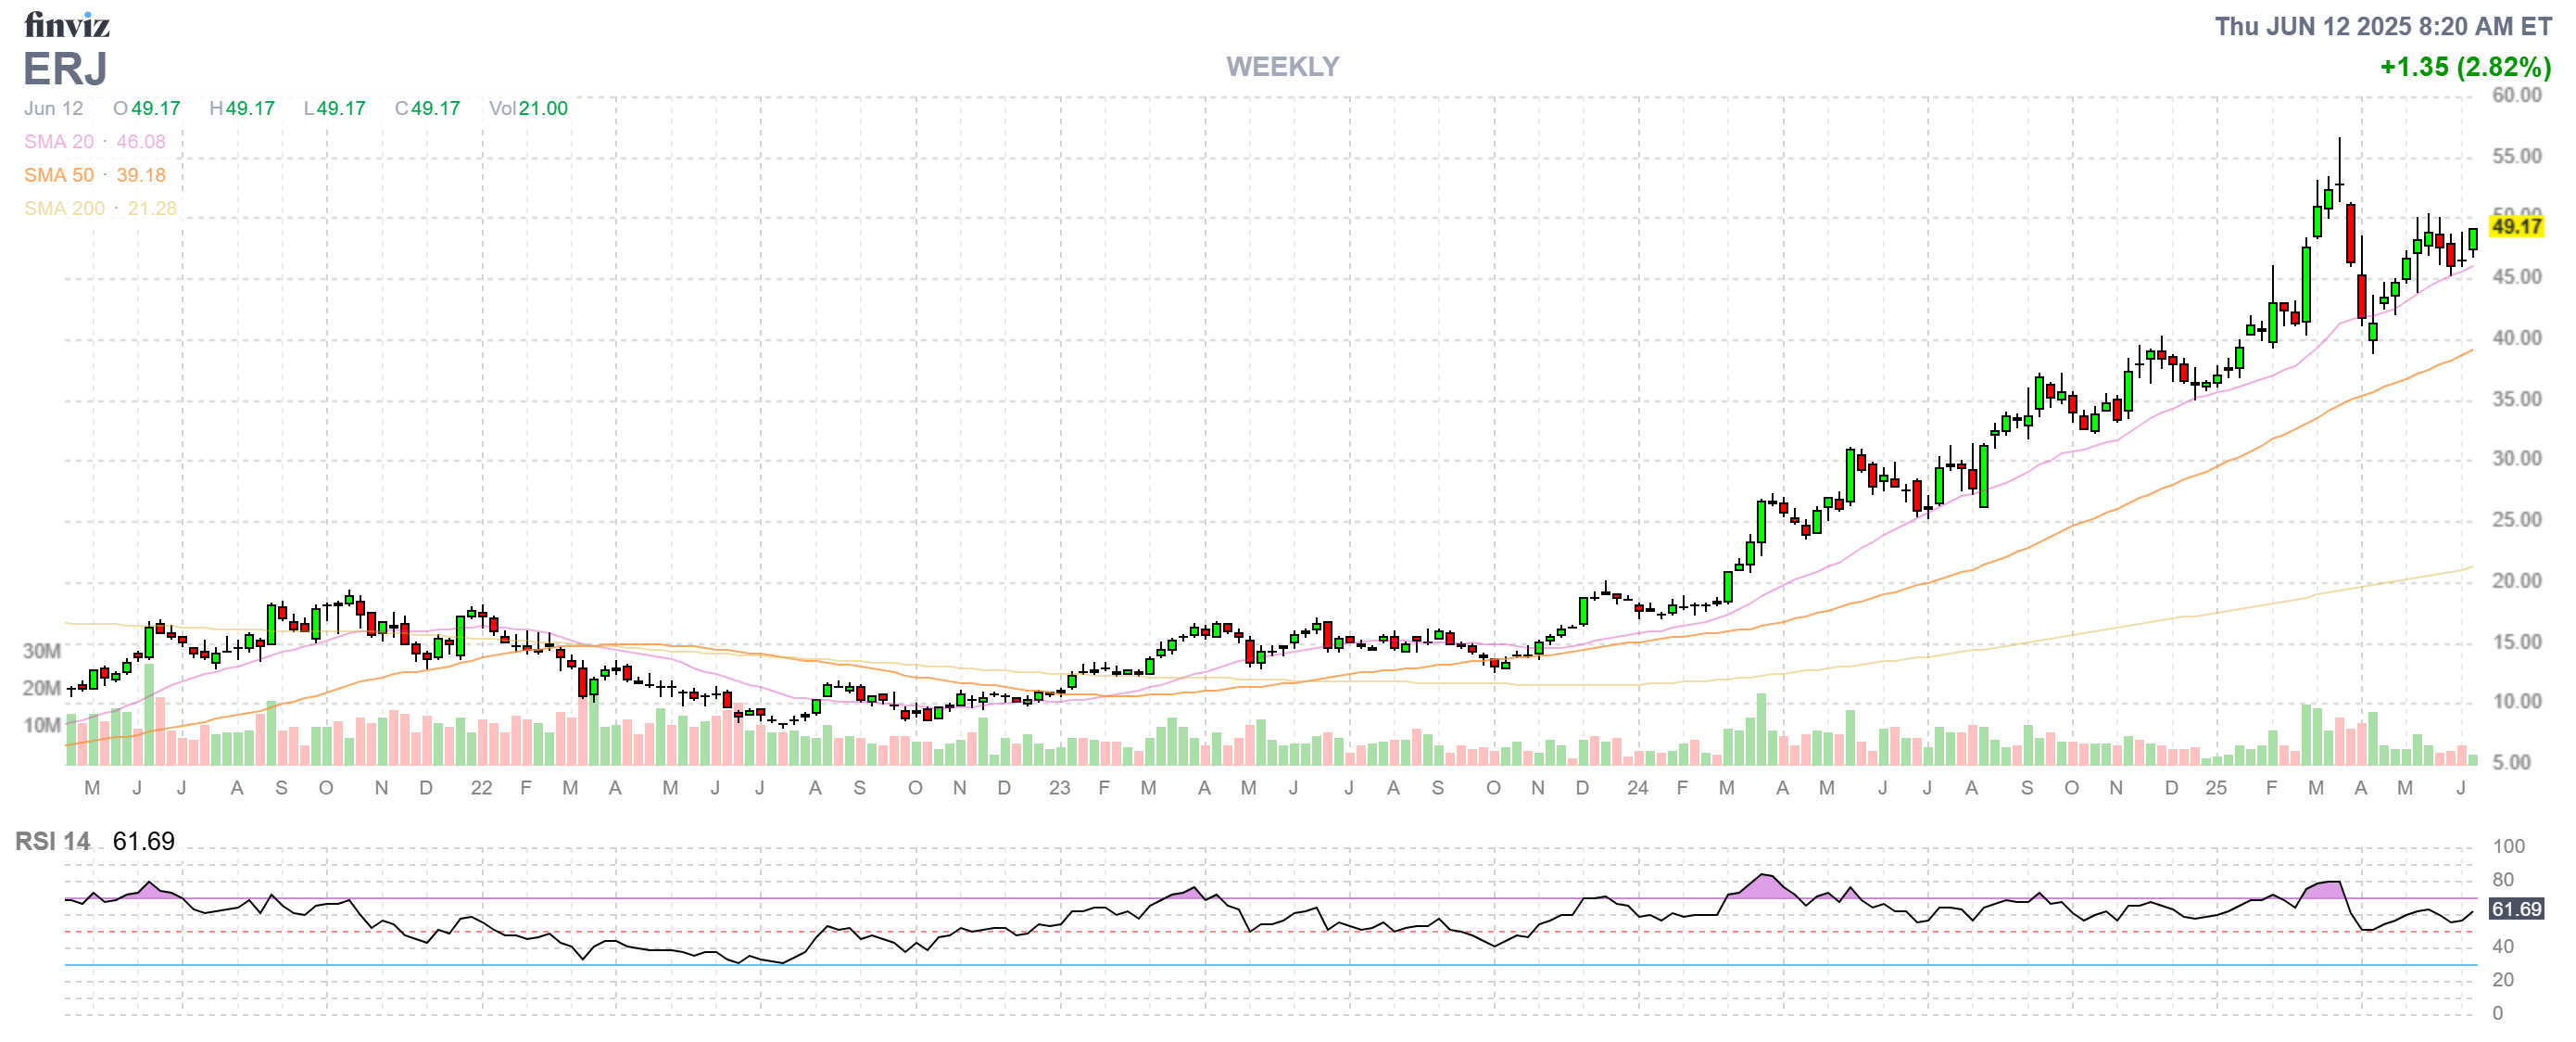
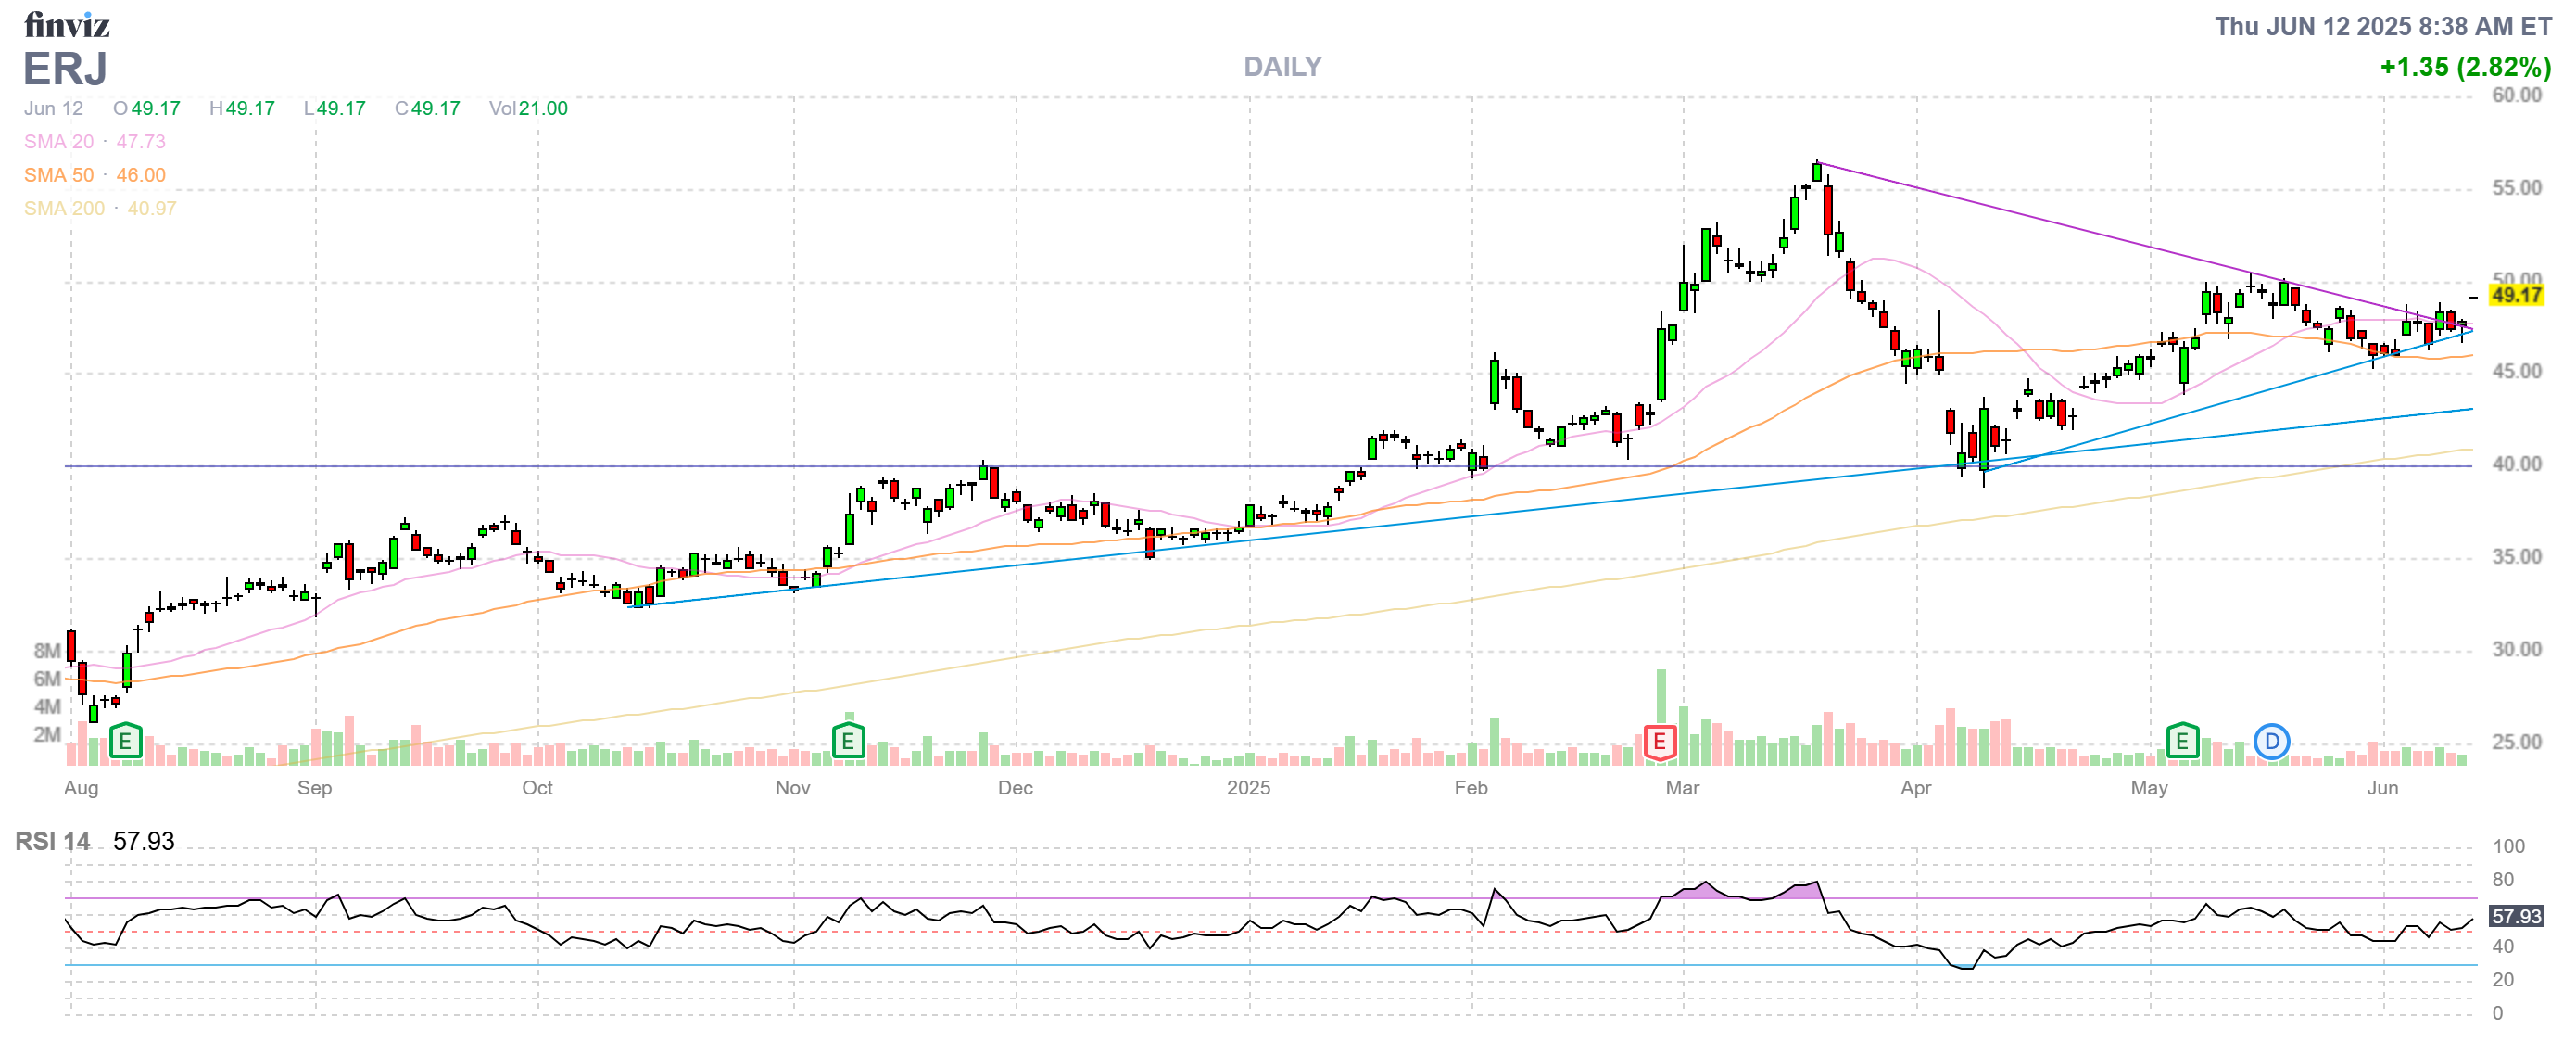
It’s also a good time to take a look at Embraer (ERJ), which has quietly emerged as one of the most resilient and opportunistic players in the Aerospace sector. Embraer just released its 2025 Market Outlook, projecting global demand for 10,500 new sub-150-seat jets and turboprops through 2044 – a $680Bn opportunity.
The company’s CEO, Arjan Meijer, notes that the shift toward mixed fleets and regional access is a long-term trend, with China and North America leading growth in new aircraft deliveries. This positions Embraer to benefit from both the ongoing reshoring of supply chains and the global push for more efficient, right-sized aircraft.
Financially, Embraer is showing real momentum. Q1 revenue came in at $1.1Bn – up 23% year-over-year, its best first quarter since 2016. While Commercial Aviation deliveries were light (seven jets, two less than expected), Executive Jet deliveries outperformed, and Defense Revenues soared 72% year-over-year.
The company is maintaining ambitious full-year guidance: 77–85 Commercial Jets, 145–155 Executive Jets, and $7–$7.5Bn in total Revenue, with EBIT margins targeted at 7.5–8.3% and Free Cash Flow of $200M or more. Embraer’s backlog hit a record $26.8Bn, up 27% from last year, thanks to major new orders from ANA and the Swedish Military.
Operationally, Embraer’s production efficiency initiatives are finally paying off, with a more stable supply chain and improved engine deliveries from Pratt & Whitney (RTX). While bottlenecks persist, management expects even smoother output from 2026 onward. At $49, ERJ trades at 22x estimated 2025 EBITDA – a very attractive valuation compared to industry giants like Boeing (50x) and Airbus (40x). For investors seeking a well-managed, globally diversified aerospace name with upside from both commercial and defense segments, Embraer is worth a serious look.
For our Long-Term Portfolio, we can play ERJ as follows:
-
-
- Sell 10 ERJ 2027 $40 puts for $5.50 ($5,500)
- Buy 25 ERJ 2027 $45 calls for $12.50 ($31,250)
- Sell 20 ERJ 2027 $60 calls for $7 ($14,000)
- Sell 7 ERJ Oct $45 calls for $6.30 ($4,410)
-
We are laying out net $7,340 on the $37,500 spread so we have $30,160 (410%) of upside potential and our worst-case scenario is being assigned 1,000 shares of ERJ at $40,000, which fits well into our $100,000 allocation blocks in the LTP. We used 127 of the 582 days we have to sell to collect $4,410 so perhaps 3 more chances to sell $4,000 is a bonus $12,000 (163%) if all goes well AND, if ERJ does take a dip – we can also sell some short-term puts as we have plenty of room in our allocation block.
With airline stocks, you ALWAYS have to have room in your allocation to double down because incidents like todays can happen to anyone at any time and, of course, don’t forget Covid shut down air travel for months – that’s also not good! ERJ fell from $20 to $5 back in 2020 – taking a $3.6Bn loss that year – they are only now making that money back so our biggest worry with ERJ isn’t a plane crash – it’s Robert Kennedy!
8:30 Update: What air crash? PPI just came out and, like yesterday’s CPI, both headline and core are at 0.1%. Of course people who pay attention might notice that, not only are we UP 0.3% from April’s -0.2%, but those were revised UP bigly from -0.5% and -0.4% (core). So it is all total bullshit but the market reacts to it so we’re forced to pay attention.
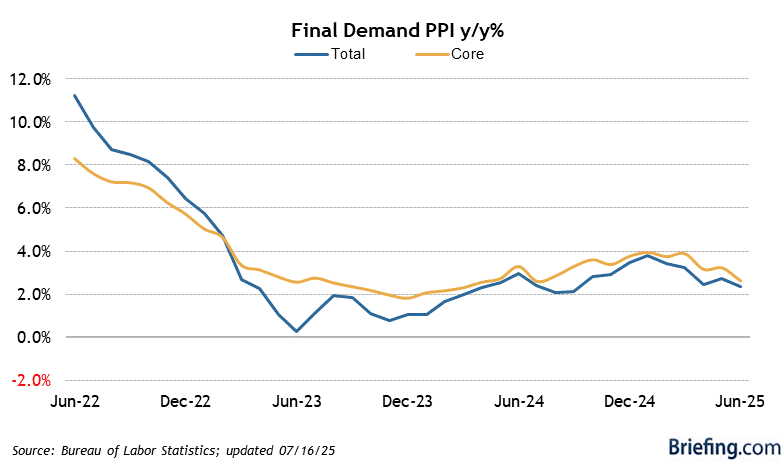
This isn’t just statistical noise. It means what looked like a string of deflationary months was, in fact, quietly revised back into Inflation territory. Markets, however, react to the headline, so this morning’s “soft” 0.1% print is all that matters for the algos, even if the underlying trend is much less benign. The same dynamic played out yesterday: CPI rose 2.4% year-over-year (up from 2.3% in April), but the market cheered the monthly deceleration and ignored the fact that annual inflation is inching higher, with core CPI at 2.8%.
The bottom line is that headline inflation data is INCREASINGLY UNRELIABLE as a real-time signal. Between base effects, aggressive seasonal adjustments, and outsized revisions, the “official” numbers can paint a very different picture from week to week. For traders and investors, this means you’re forced to play the game – reacting to the latest print, even if you know the “facts” will be rewritten a month from now. As Mark Zandi at Moody’s put it, “This report still reflects the disinflation trend that began a few years ago and has persisted through May,” but he also warns us that Trump’s tariffs could soon reignite inflation pressures.
So yes, the market may shrug off the occasional plane crash or any other “real world” event in favor of a headline inflation print, but savvy investors should keep a close eye on the revision game and be skeptical of any narrative that relies solely on the latest number.
In this environment, the only thing you can count on is that the story will change – sometimes “bigly” by the time the next report drops.


")