
 We’re a bit bearish.
At the moment, we are protecting $53,305 in Long-Term positions with $100,000 worth of hedges in our Short-Term Portfolio (see yesterday’s review), so it would be nice if the market takes a nose dive – especially as we’re about 90% in CASH!!! at the moment and we’d love to do some more shopping.
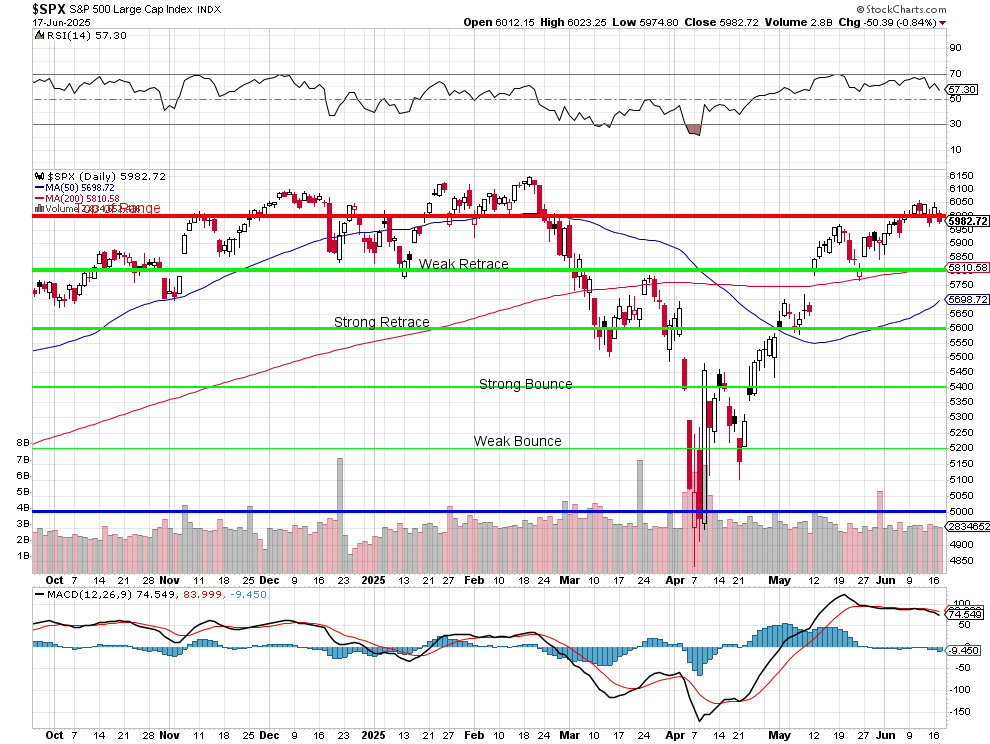
As you can see from the S&P 500 chart, the 200 dma is testing our Weak Retrace Line at 5,800 and, if it can stay over that (now 5,810) long enough for the 50 dma to cross back over (after July 4th at this pace), THEN we are back to bullish BUT that all comes to a head right when the tariffs are supposed to kick back in and when Q2 Earnings Reports kick off – busy, busy, busy…
So we remain CAUTIOUS while the markets remain optimistic, with Retail Dip Buyers racing in NO MATTER WHAT causes the sell-offs. Are their AIs telling them to do it? Probably. The algorithms are programmed to buy the dips, creating a self-fulfilling momentum that defies Fundamentals. This artificial buoyancy can only last so long, especially as we approach a perfect storm of tariff reimpositions and the Q2 earnings season, both of which could expose cracks in Corporate Guidance and Consumer Resilience and just yesterday we saw a 0.9% drop in May Retail Sales and a 0.2% drop in Industrial Production.
Tariffs are scheduled to come back July 9–14, potentially increasing costs and squeezing margins, hitting Supply Chains which will pressure Q3 guidance for Multinationals. Earnings reports begin rolling out just as tariffs take effect. With Retail Sales slumping and Consumer caution rising, the risk of negative surprises is HIGH. Companies may use the tariff narrative to lower the bar for the rest of the year, adding to the volatility.
In this environment, our hedges are not just insurance, they are strategic tools to capitalize on volatility. With 90% of our portfolio in cash, we’re ready to add to positions when the market offers better prices. But PATIENCE is key. The retail crowd’s relentless dip buying often leads to short-term rallies that can trap latecomers. We prefer to wait for clear signs of capitulation or a confirmed technical bottom before deploying significant capital.
That means it’s time to bring back our Bounce Chart as we retest those February highs – once again with Tariffs looming just around the corner:
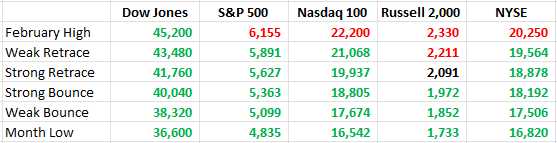
The Russell is clearly lagging. Over 2,000 is a good sign if it lasts but let’s keep in mind that, before we call it a new breakout for the indexes, they need to clear not just the February highs but make new highs one box above those – which would become the Weak Bounce Lines for the next set of numbers.

The Magnificent 7 have popped 35% off their April lows – up $6 TRILLION in market cap (now $17.4Tn) in two months. Unfortunately, market inflows for the past two months were just net $10 Billion, with April having $46Bn worth of Market OUTFLOWS and May having $56Bn flowing back in.
Stock prices, and thus market capitalizations, are determined by the price at which THE MOST RECENT TRADE occurs, NOT by the total amount of money flowing into the market. When a buyer is willing to pay a higher price for even a small number of shares, that new price is applied to ALL of the outstanding shares, instantly increasing the company’s market cap – even if only a tiny fraction of shares actually changed hands.
Traders tend to let themselves get led around by the nose watching these short-term changes in valuation, which often turn out to be quite ethereal. As VALUE INVESTORS – we teach our Members to see the difference.
That’s why the 200-day moving average matters – rather than being “one man’s opinion” it is the consensus of everyone who has traded a stock for the past year (200 trading days) taken into account. The 50-day (two months) moving average can give us an indication of more recent trends in investor thinking – and that takes into account recent earnings, current news-flow, etc. That’s why those indicators are useful.
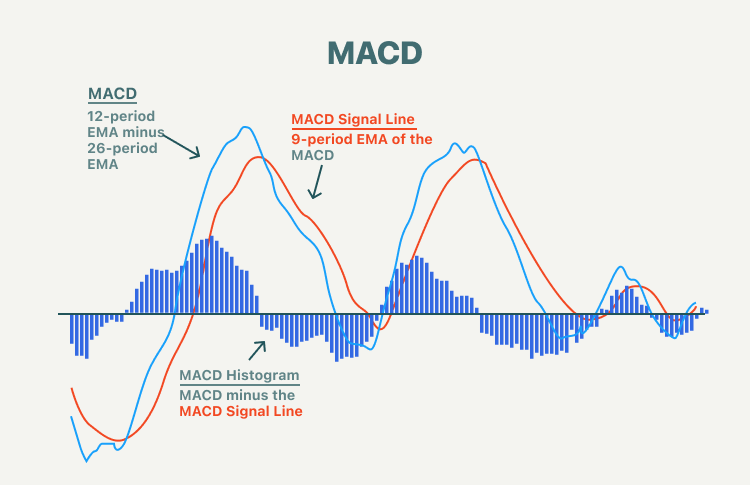
Also useful then is the shorter-term MACD indicator, which is calculated by subtracting the 26-period exponential moving average (EMA) from the 12-period EMA. A 9-period EMA of the MACD line, called the signal line, is plotted on top of the MACD line. When the MACD line crosses above the signal line, it can indicate a potential buy signal; when it crosses below, it may signal a sell. The distance between the MACD line and the signal line is shown as a histogram, which helps visualize the strength and direction of momentum:
In short, at the market is walking a tightrope between hope/hype and reality. Until tariffs ease or earnings prove resilient, we’ll keep our powder dry and our hedges tight, watching closely for the signals that tip the balance one way or the other.
Other than that, we’re waiting for the Fed Non-Decision today at 2pm (during our Live Trading Webinar) and, more importantly, the Fed’s new data report and then, at 2:30, Powell’s press conference. Busy, busy, busy…
8:30 Update: Mortgage Applications fell 2.6% as of June 14th while Housing Starts (1.25M, down from 1.39M last month) are the worst since May of 2020 – AFTER a 33% market collapse in the early stages of COVID – THAT is where we are now – keep buying algos… no one else is!
If there is any argument for the Fed to cut rates – this would be it. Housing starts dropping over 10% in a single month is a disaster and, if the Fed waits until July 30th (next meeting) and we drop another 10% – to the 2020 lows? Well then maybe Trump is right and Powell is miles behind the curve.
Building Permits fell from 1.42M to 1.39M, so down 300,000 and Unemployment is steady so what does this really tell us? Mortgage Applications are falling even as Unemployment remains stable, indicating that high rates and affordability issues are keeping Buyers on the sidelines. The Labor Market is not collapsing, but job growth is slowing, and more people are leaving the workforce, which can mask underlying weakness.
Let’s be careful out there!


