
What a rally!
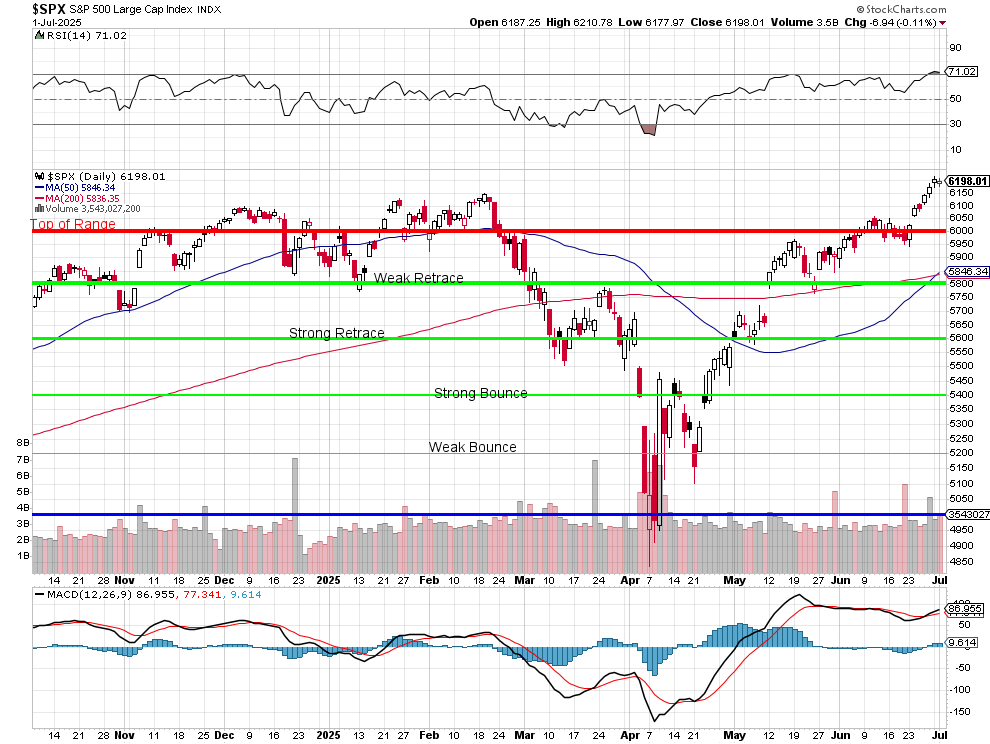
From 4,950 on April 8th to 6,200 yesterday, the S&P 500 is up 25.25% in less than two months. As you can see from the chart above, that has brought the 50-day moving average from a “Death Cross” to a “Life Cross” also in less than 60-days and that’s a good sign BUT MACD is at 87 and that is hot while even HOTTER is the RSI at 71.02 – which is five-alarm fire kind of hot into the holiday weekend.
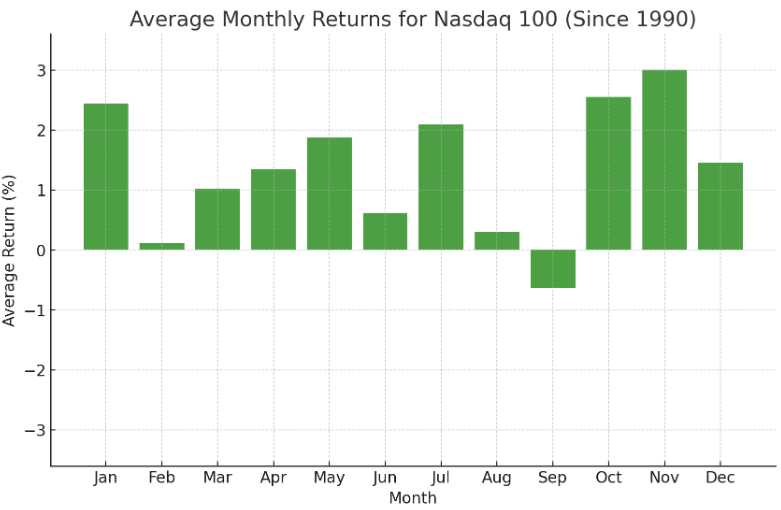
So, which symbol do we heed into the summer? Do we trust the “Life Cross” and the technical momentum, or do we take the hint from the screaming-hot RSI and MACD that we’re running on fumes? Historically, July is a bullish month for the S&P 500: Over the past 35 years, it’s averaged a 1.4% gain and hasn’t posted a negative July since 2015 – that’s 10 years for your math wizzes!
But even the strongest seasonal tailwinds can’t erase the fact that we’re now deep into overbought territory and, unless TACO, we have a major Macro-headwind coming at us next Wednesday, July 9th, as Trump rolls out his Tariffs (again). This is coming as we back at overbought levels where rallies have historically paused (or reversed) especially as we approach psychological resistance at 6,200.
Then there’s the July 4th Big, Beautiful Fiscal Bill deadline with its potential Deficit Drama along with the start of Earnings Season for the Magnificent 7 all coming against a backdrop of rising volatility, since with the VIX historically ticks up 5% in July, 8% in August and 7% in September – as you can see from last Summer’s chart.
The S&P is now 6% above the 50 and 200-day moving averages and, for many technical models, that screams “bullish,” but those same models show we’re stretched, with momentum indicators at levels that rarely persist without at least a tactical pullback (5-10%). The last time we saw a rally this vertical, it ended with a sharp mean reversion as traders locked in gains and rotated to safety.
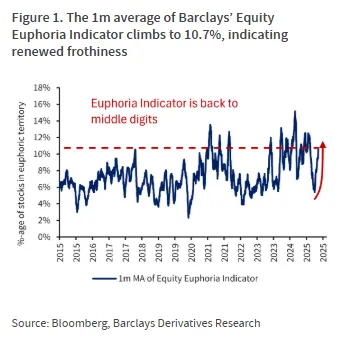 And now, as if on cue, the “irrational exuberance” alarm bells are ringing louder than they have since the meme-stock mania and the height of the Dot-com bubble. According to Barclays’ Equity Euphoria Indicator, the one-month average has shot up to 10.7%, well above its long-term average of 7% and into territory that’s historically signaled “extreme frothiness”. This is the first time since February that the gauge has breached double digits – and that didn’t end well, did it? Actually, it has only happened a handful of times in the last quarter-century – usually right before a sharp correction.
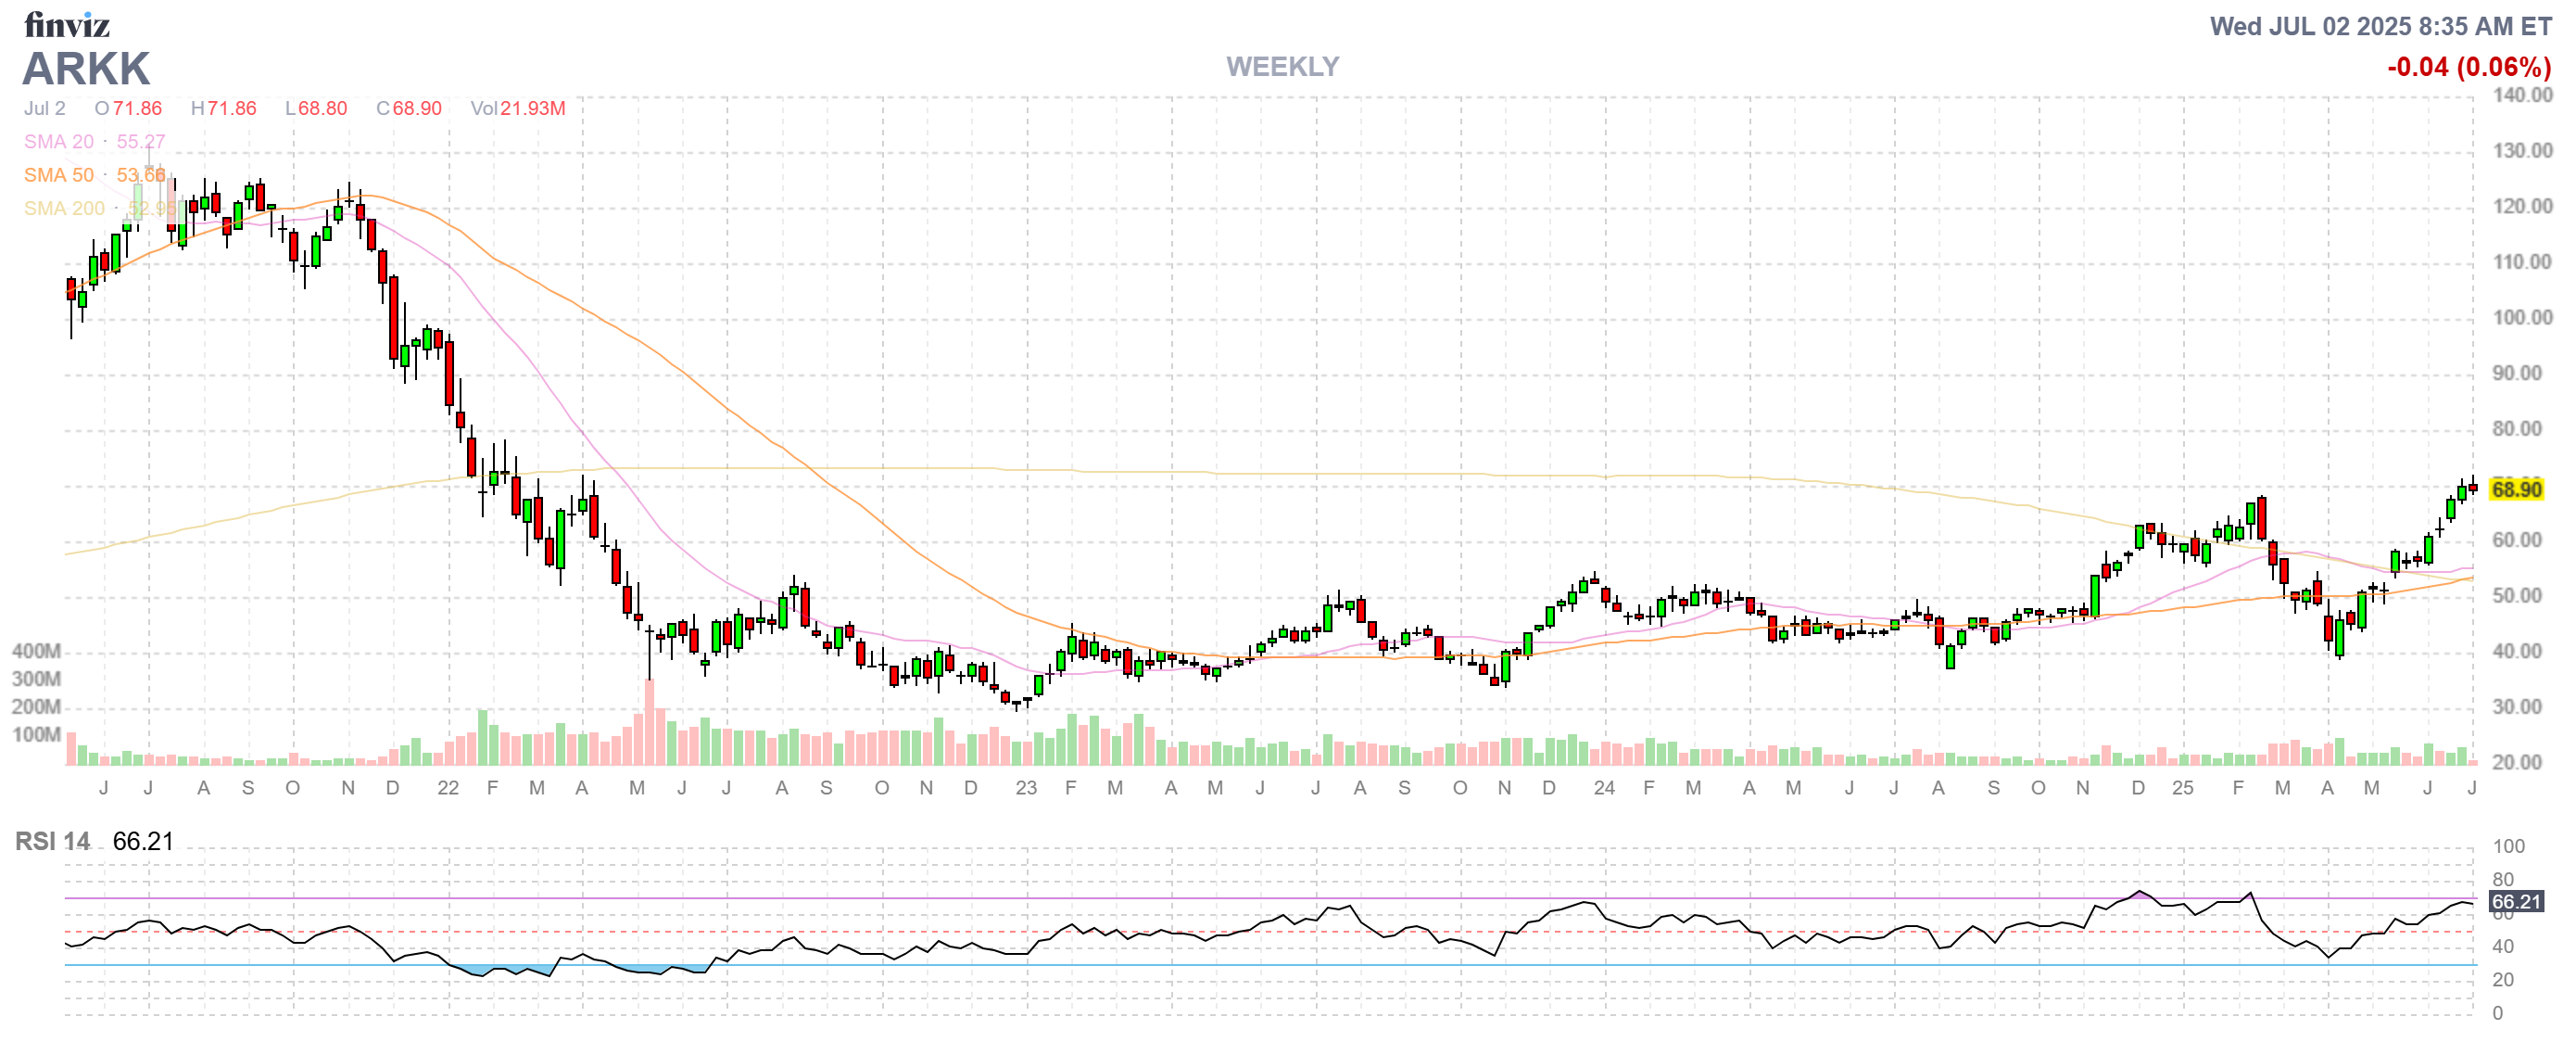
What’s driving this euphoria? Wall Street speculators are back in force – stocks have snapped back from the April tariff selloff to hover near record highs, the pipeline of new SPACs is rebounding, and Cathie Wood’s ARK Innovation ETF is on a historic tear. In the second Quarter alone, Bitcoin-linked firms rallied 78%, Quantum Computing shares jumped 69%, Meme Stocks soared 44%, and a basket of highly shorted names rallied 29%. Fundamentals? They’ve taken a back seat to “hot narratives,” and some stocks are trading more like lottery tickets than investments.
Barclays’ strategists warn that while bubbles are notoriously hard to time and can last longer than anyone expects, these elevated readings are a clear sign that investors are “overly exuberant,” which could lead to increased volatility and sudden, sharp reversals. Their advice? Ride the wave if you must, but hedge with options and keep your stops tight, because when the music stops, there may not be many chairs left. Usually it’s hard to know when a bubble will pop but think of next week’s Tariff deadline like a gigantic needle coming to burst this one (unless TACO – which is what the market now counts on).
So, as we head into the Holiday, with the S&P up 25% in two months and euphoria readings at levels not seen since the Dotcom era, the question isn’t just “Which Way Wednesday,” it’s how long can this market keep dancing on air before gravity returns?
So, do you chase the breakout or prepare for the inevitable summer whiplash? The answer, as always, is to respect both the signal and the noise. Seasonality may be on the bulls’ side, but with macro risks, policy deadlines, and overbought signals all converging, this rally is looking every bit as tired as it is impressive.
We’ll take a close look at our Short-Term Portfolio (STP) hedges in our Live Member Chat Room – join us there!


")
