
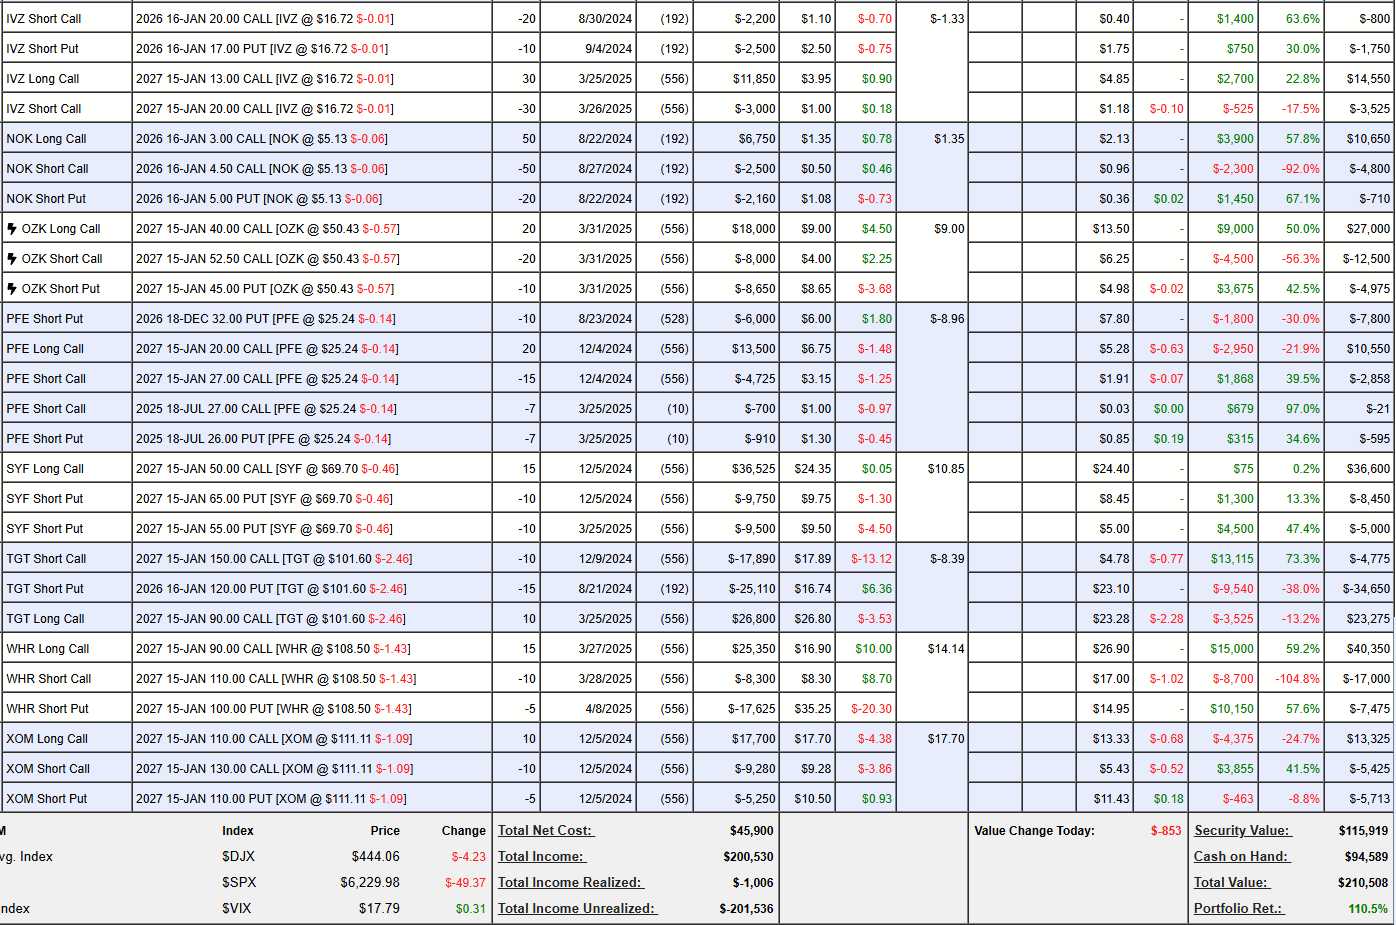
$210,508!
That is up $110,508 (110.5%) overall since our $100,000 Aug 21st, 2024 restart of our very popular portfolio and you can see why it’s so popular – with this fantastic one-year performance. Actually, though, it’s a fantastic 3-month performance as the market collapse in February left us at just $101,788 (up 1.8%) on March 25th – the last time I was on Bloomberg’s Money Talk Show.
As I said at the time, of our beaten-down positions:
“While the S&P’s still sulking at -1.9% – it’s as much as we can hope for in a downturn like this but, more importantly, there are stocks to buy that are down 10-20% and we have CASH!!! THAT was the whole point of our conservative entry strategy.”
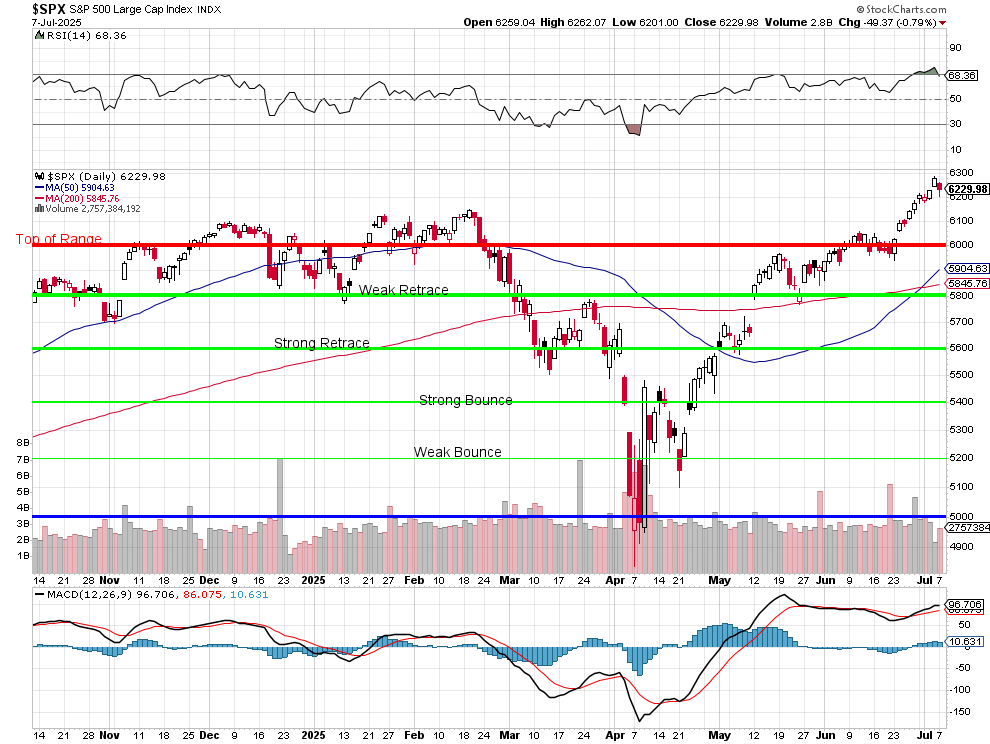
We only trade the Money Talk Portfolio on show days and I’m only on about once per quarter so we can’t take advantage of quick adjustments, as we did with our PSW Members when we cashed out and doubled down our hedges back on March 6th and 7th – avoiding the worst part of the correction but we were able to aggressively adjust our positions and we added 4 new ones (OZK, FL, WHR and ARCB) at what we expected was going to be a bottom – according to the 5% Rule Chart we had been using to predict the S&Ps movement since 2023:
The show aired taped on the 25th (as I will be taping this afternoon) and aired on March 26th at 7pm and here was my overview, where I talked about how excited to buy into Trump’s “Tariff Chaos” that was about to hit on April 2nd:
0:00 – Market shift since record highs in February
0:28 – Tariffs as the key cause of market volatility
1:00 – Stocks now presenting value opportunities
1:48 – Canada–U.S. trade impact and uncertainty over tariff policy
2:58 – Market rebound after five down weeks and technical levels explained
3:52 – FedEx earnings and weak consumer confidence raise concerns
4:08 – Canadian investor risks from U.S. tariffs and retaliations
4:30 – Sector-specific risks: autos, steel, energy
5:10 – Defensive and logistics-related plays for Canadians
5:45 – Sector outlook: financials, REITs, gold miners
As you can see, we laid out our strategy for investing into the drop and, while the specific adjustments were too numerous for a TV segment, we discussed them in the middle segment and, of course, we always publish our Money Talk trade ideas here, at www.PhilStockWorld.com/MoneyTalk .
Note my logic on why it’s great to be flat in a down market. Defensive trading in the first few months of the year allowed us to be well-positioned to go on the offence when the crash finally came:
0:03 – Portfolio performance flat in a down market
0:40 – Stocks that performed well, portfolio strategy
1:00 – Defensive investment strategy based on Trump policies
1:52 – Lockheed underperforms
2:00 – Gold outlook and Barrick Gold investment thesis
2:50 – Risk to gold if global stability returns
3:20 – Market risks including tariffs and tourism impact
4:20 – Charts no longer reliable due to fundamental shifts
By the way, if you would like to get these kinds of insights for your portfolio and trade ideas like these EVERY DAY – simply come and join us at PhilStockWorld.com and benefit from our Live Member Chat Room – where you will have access to all of our Member Portfolios as well as on-the-fly analysis and, of course, our World-Famous Top Trade Alerts!
In our final segment (30-minute show), we got to the best part – our 4 New Trade Ideas for the Quarter (more on those in the review):
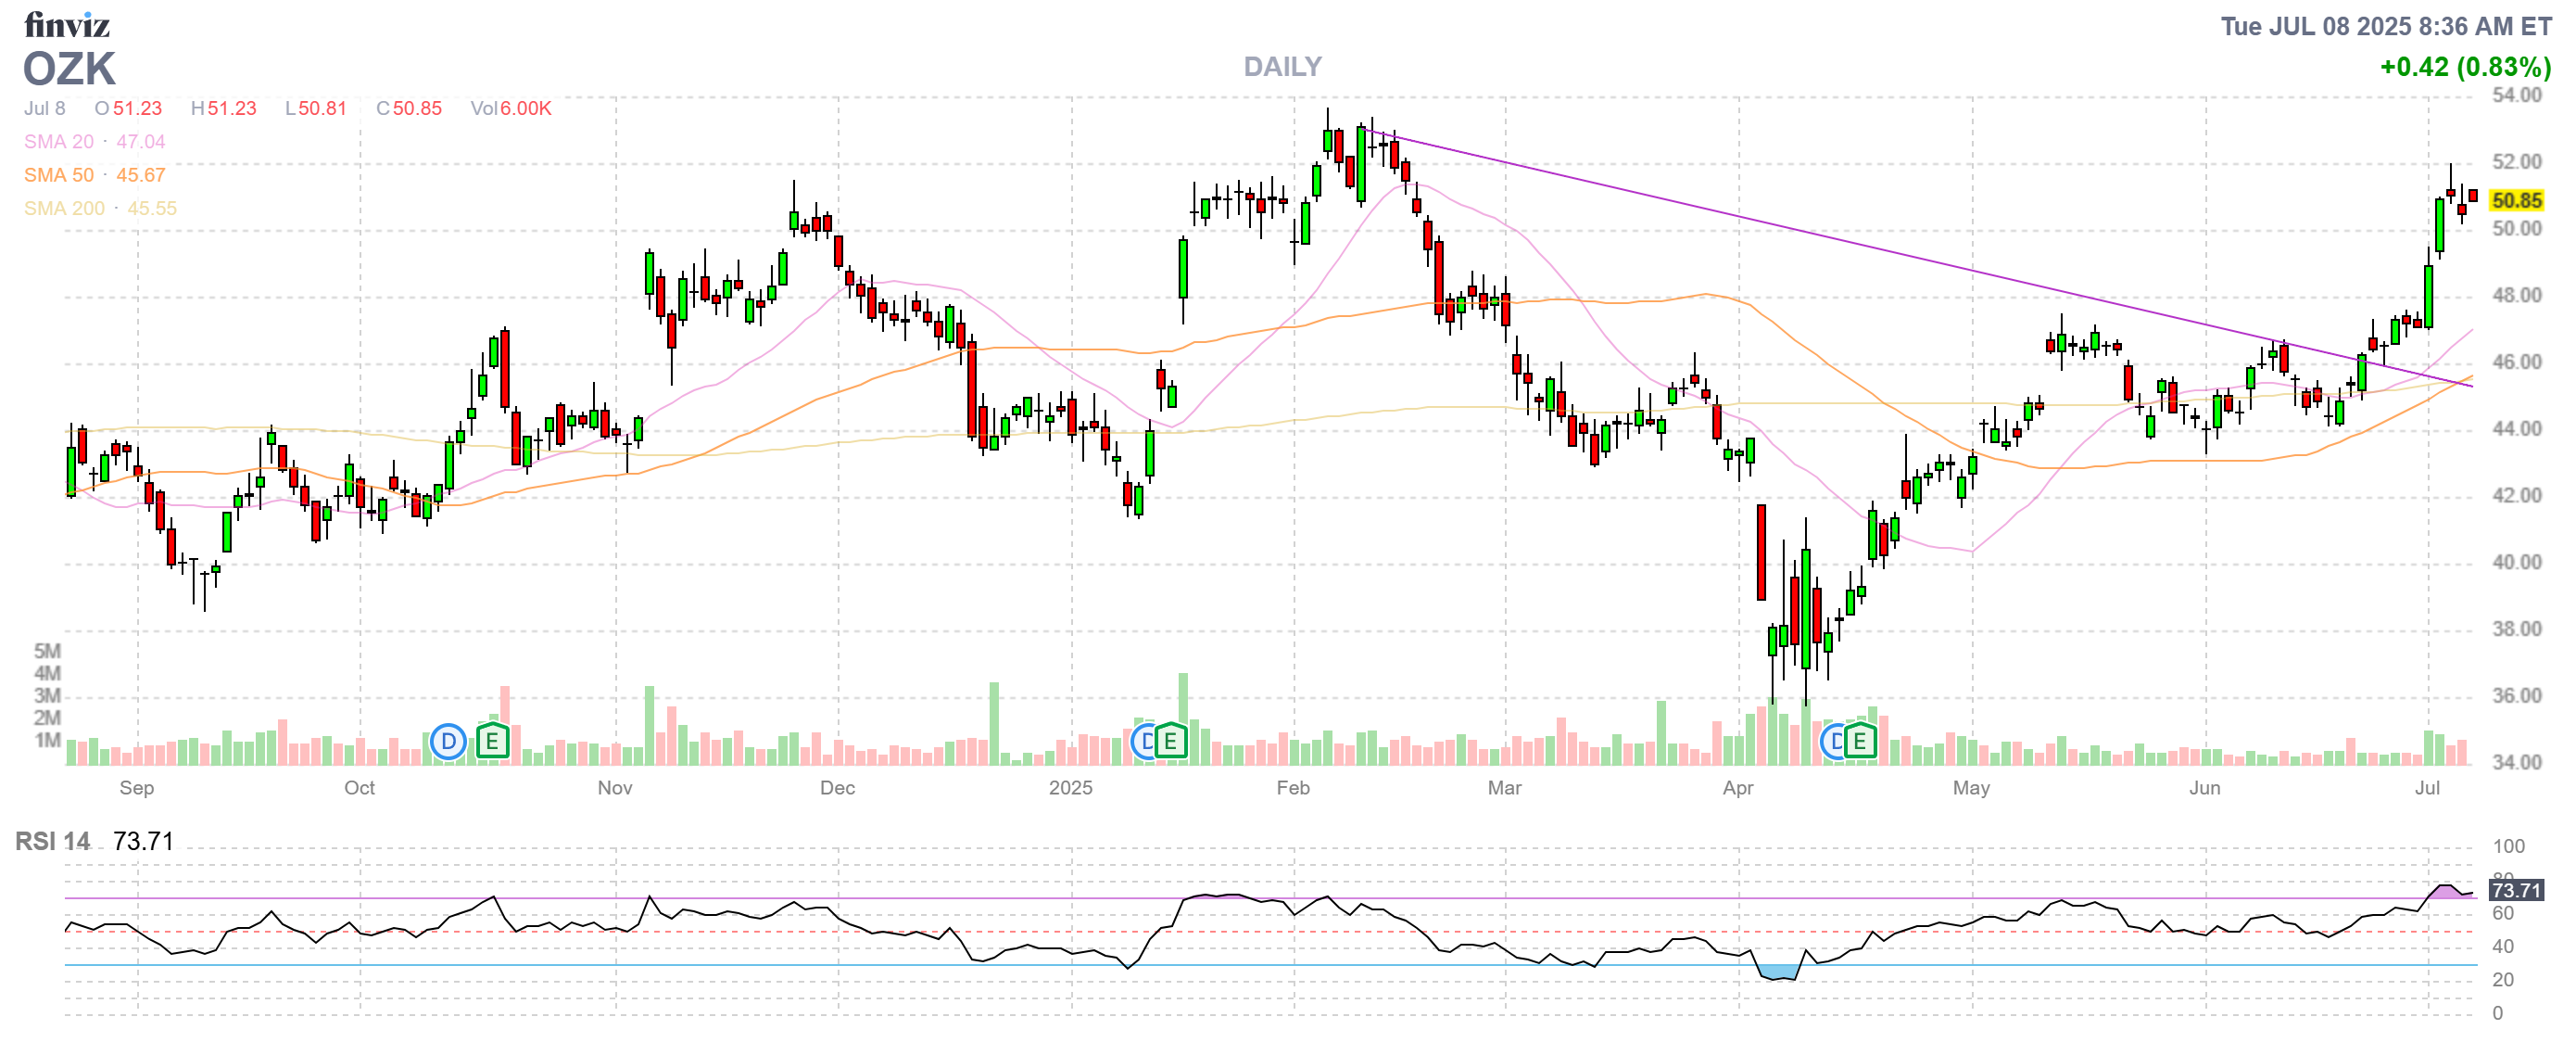
0:00 – Trade idea: Bank OZK (Bank of the Ozarks)
1:55 – Risk analysis of Bank OZK trade
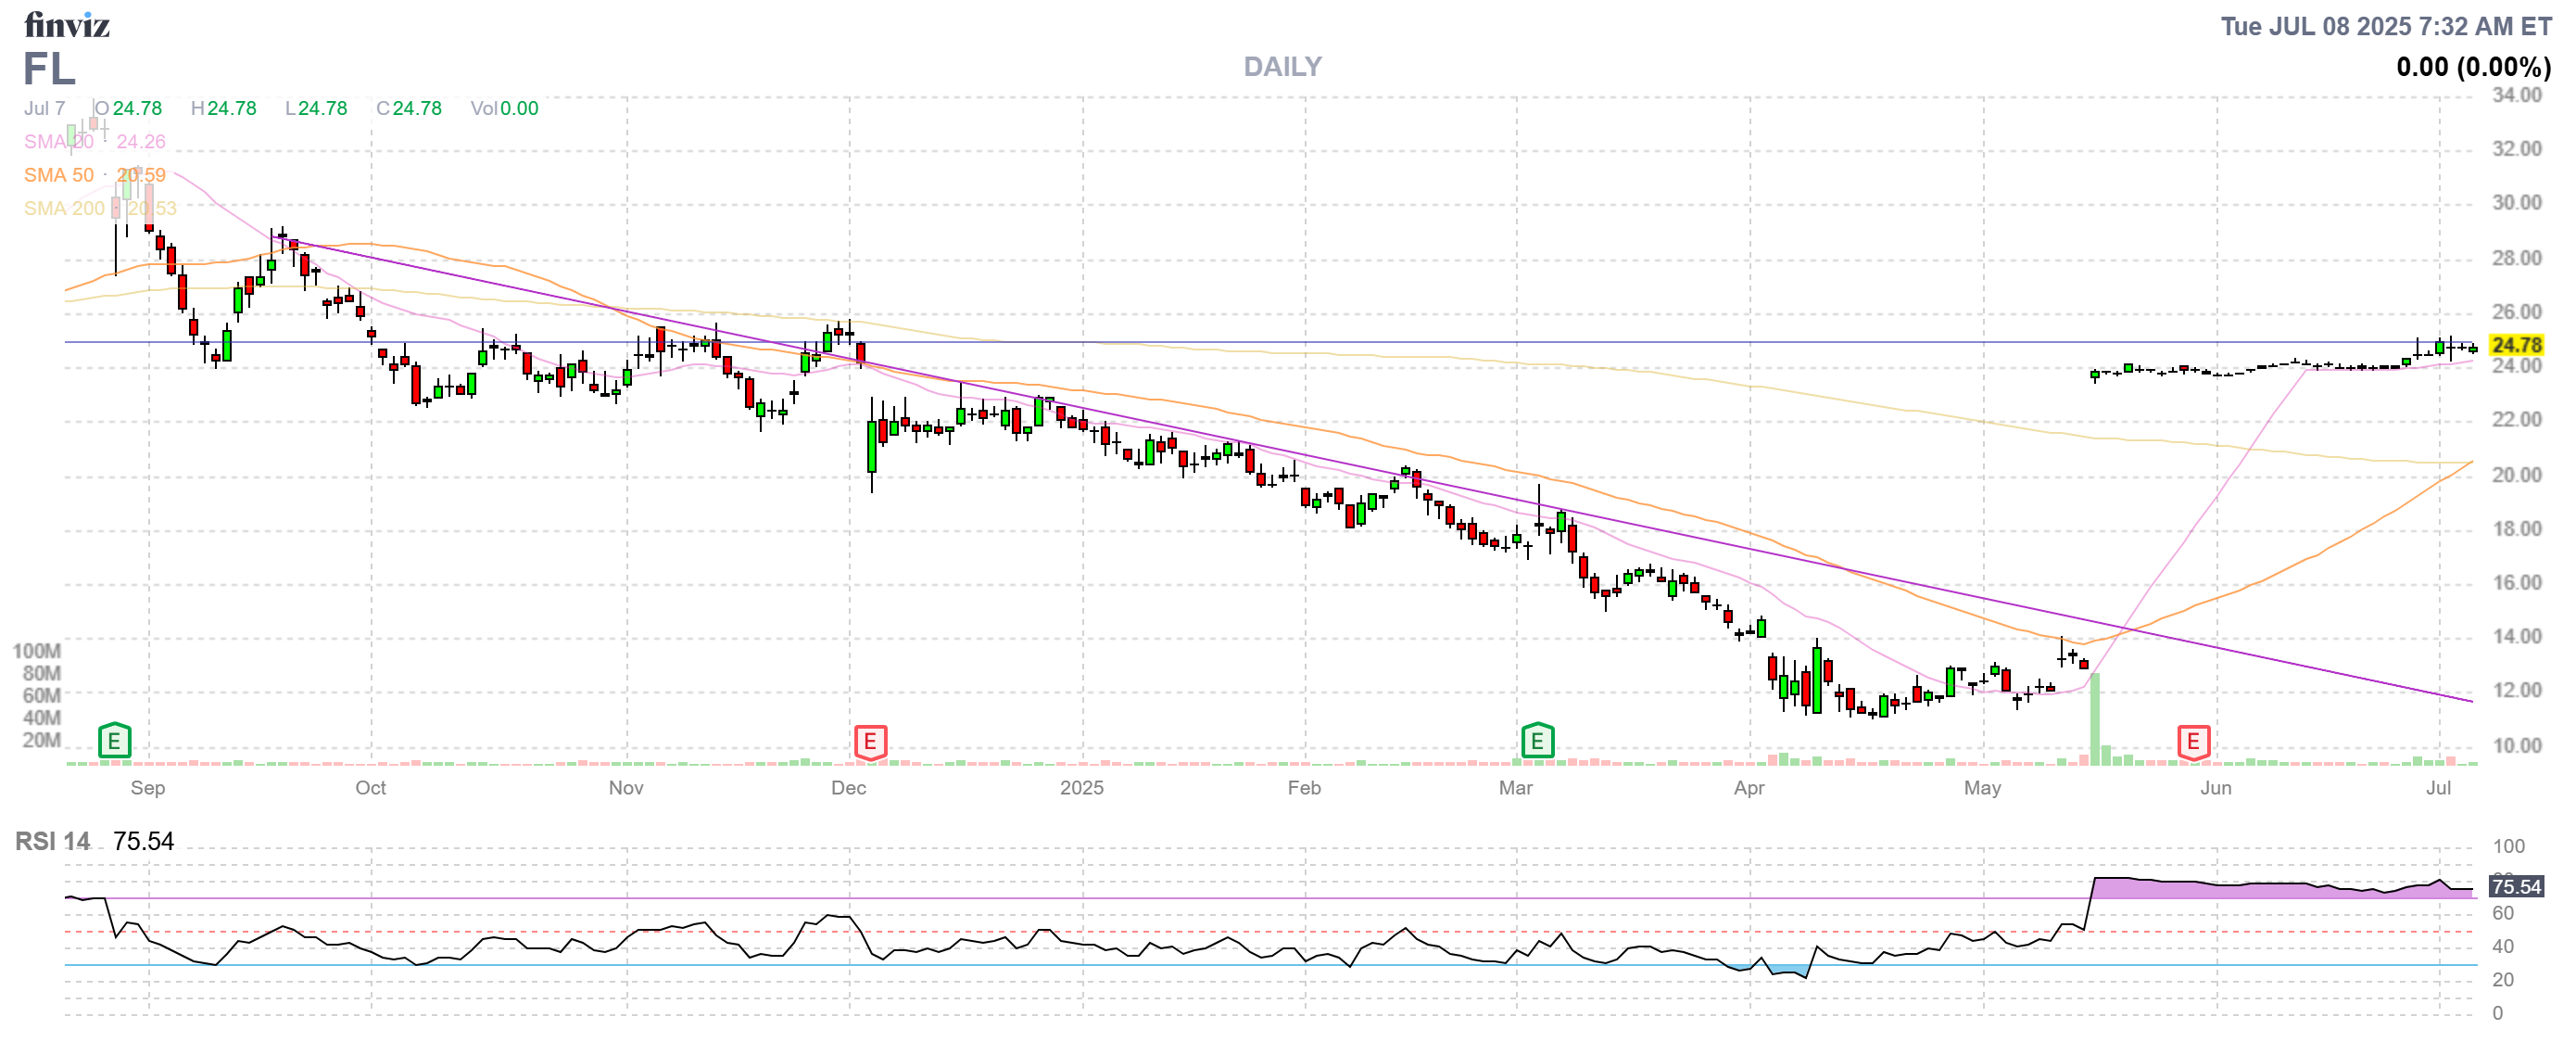
2:35 – Foot Locker and Nike relationship
4:25 – Whirlpool Corporation and tariff impact
7:15 – Income strategy using Whirlpool options spread
8:20 – Trade idea: ArcBest and logistics sector opportunity
As evidenced in the interview, we are FUNDAMENTAL Investors who use options for leverage and hedging – it is generally a conservative strategy with a high-probability of success. And, when we are right, we can be VERY RIGHT as exemplified by Foot Locker (FL), which gained almost all of its potential $34,400 (614%) when they accepted an offer from Dick’s Sporting Goods (DKS) – we were not the only ones who thought they were undervalued!
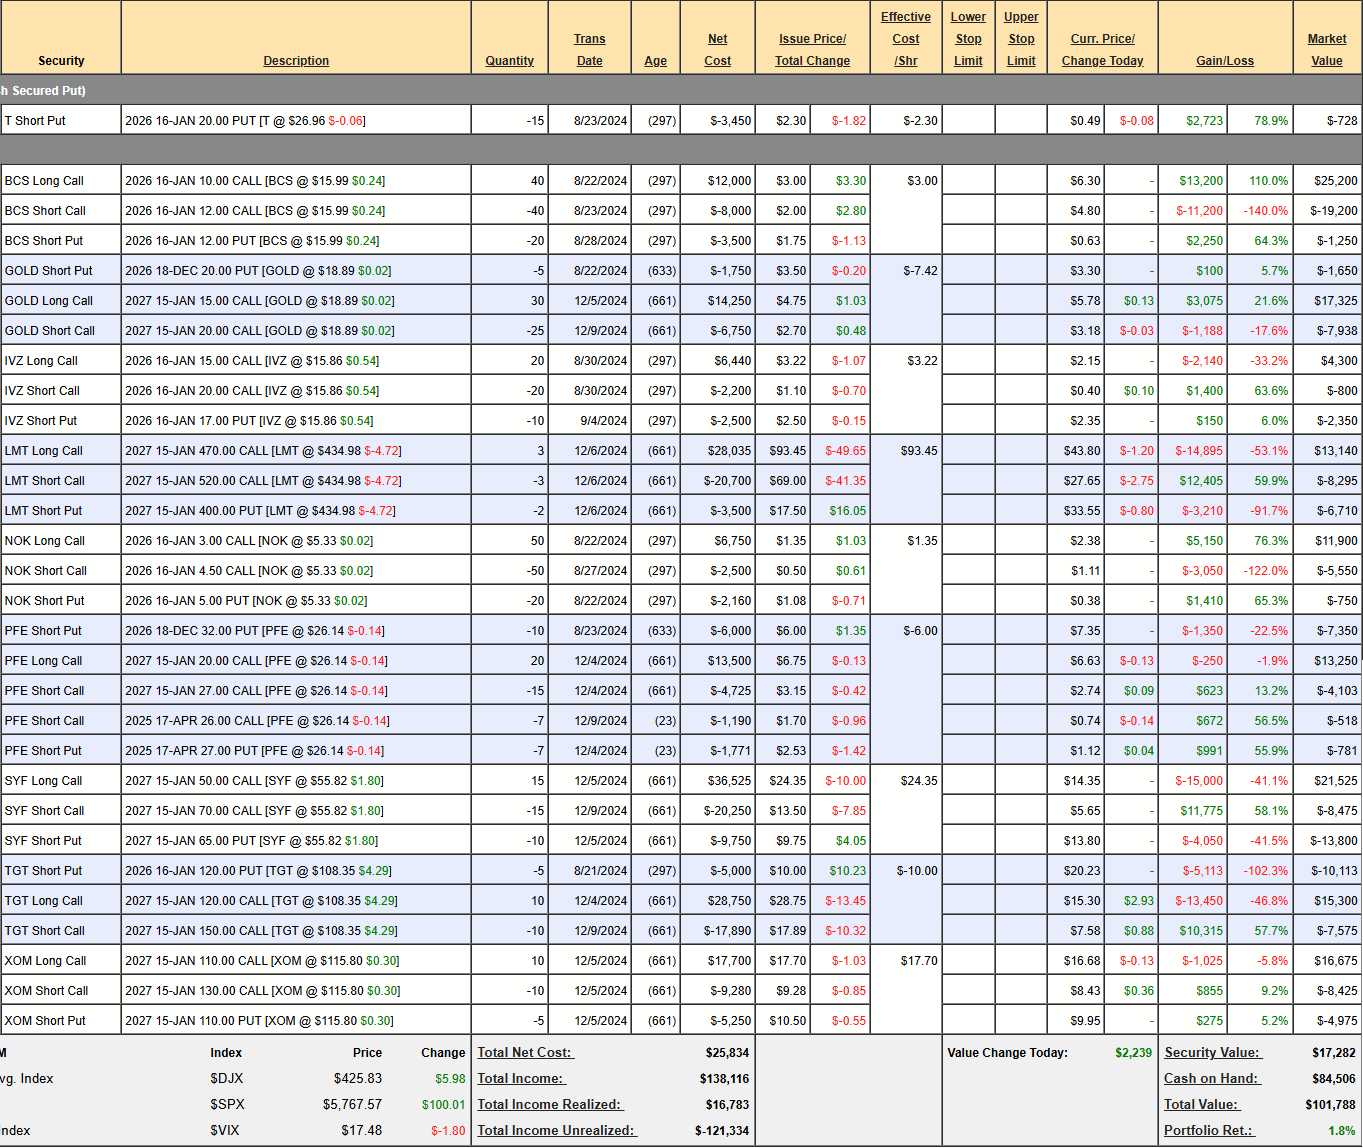
Now, let’s take a look at how the Money Talk Portfolio looks as of yesterday’s close and, as usual, we will first go through each trade and decide if they need adjusting and than consider what new trades will give us even better balance going forward from here:
-
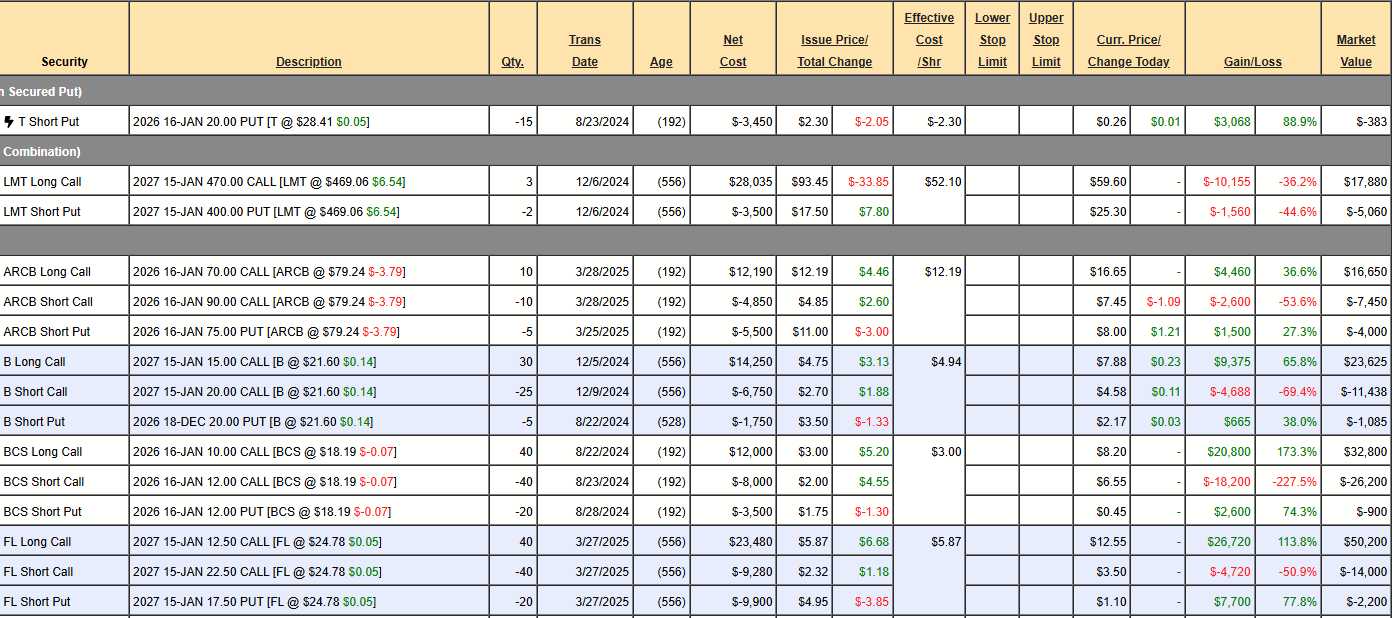
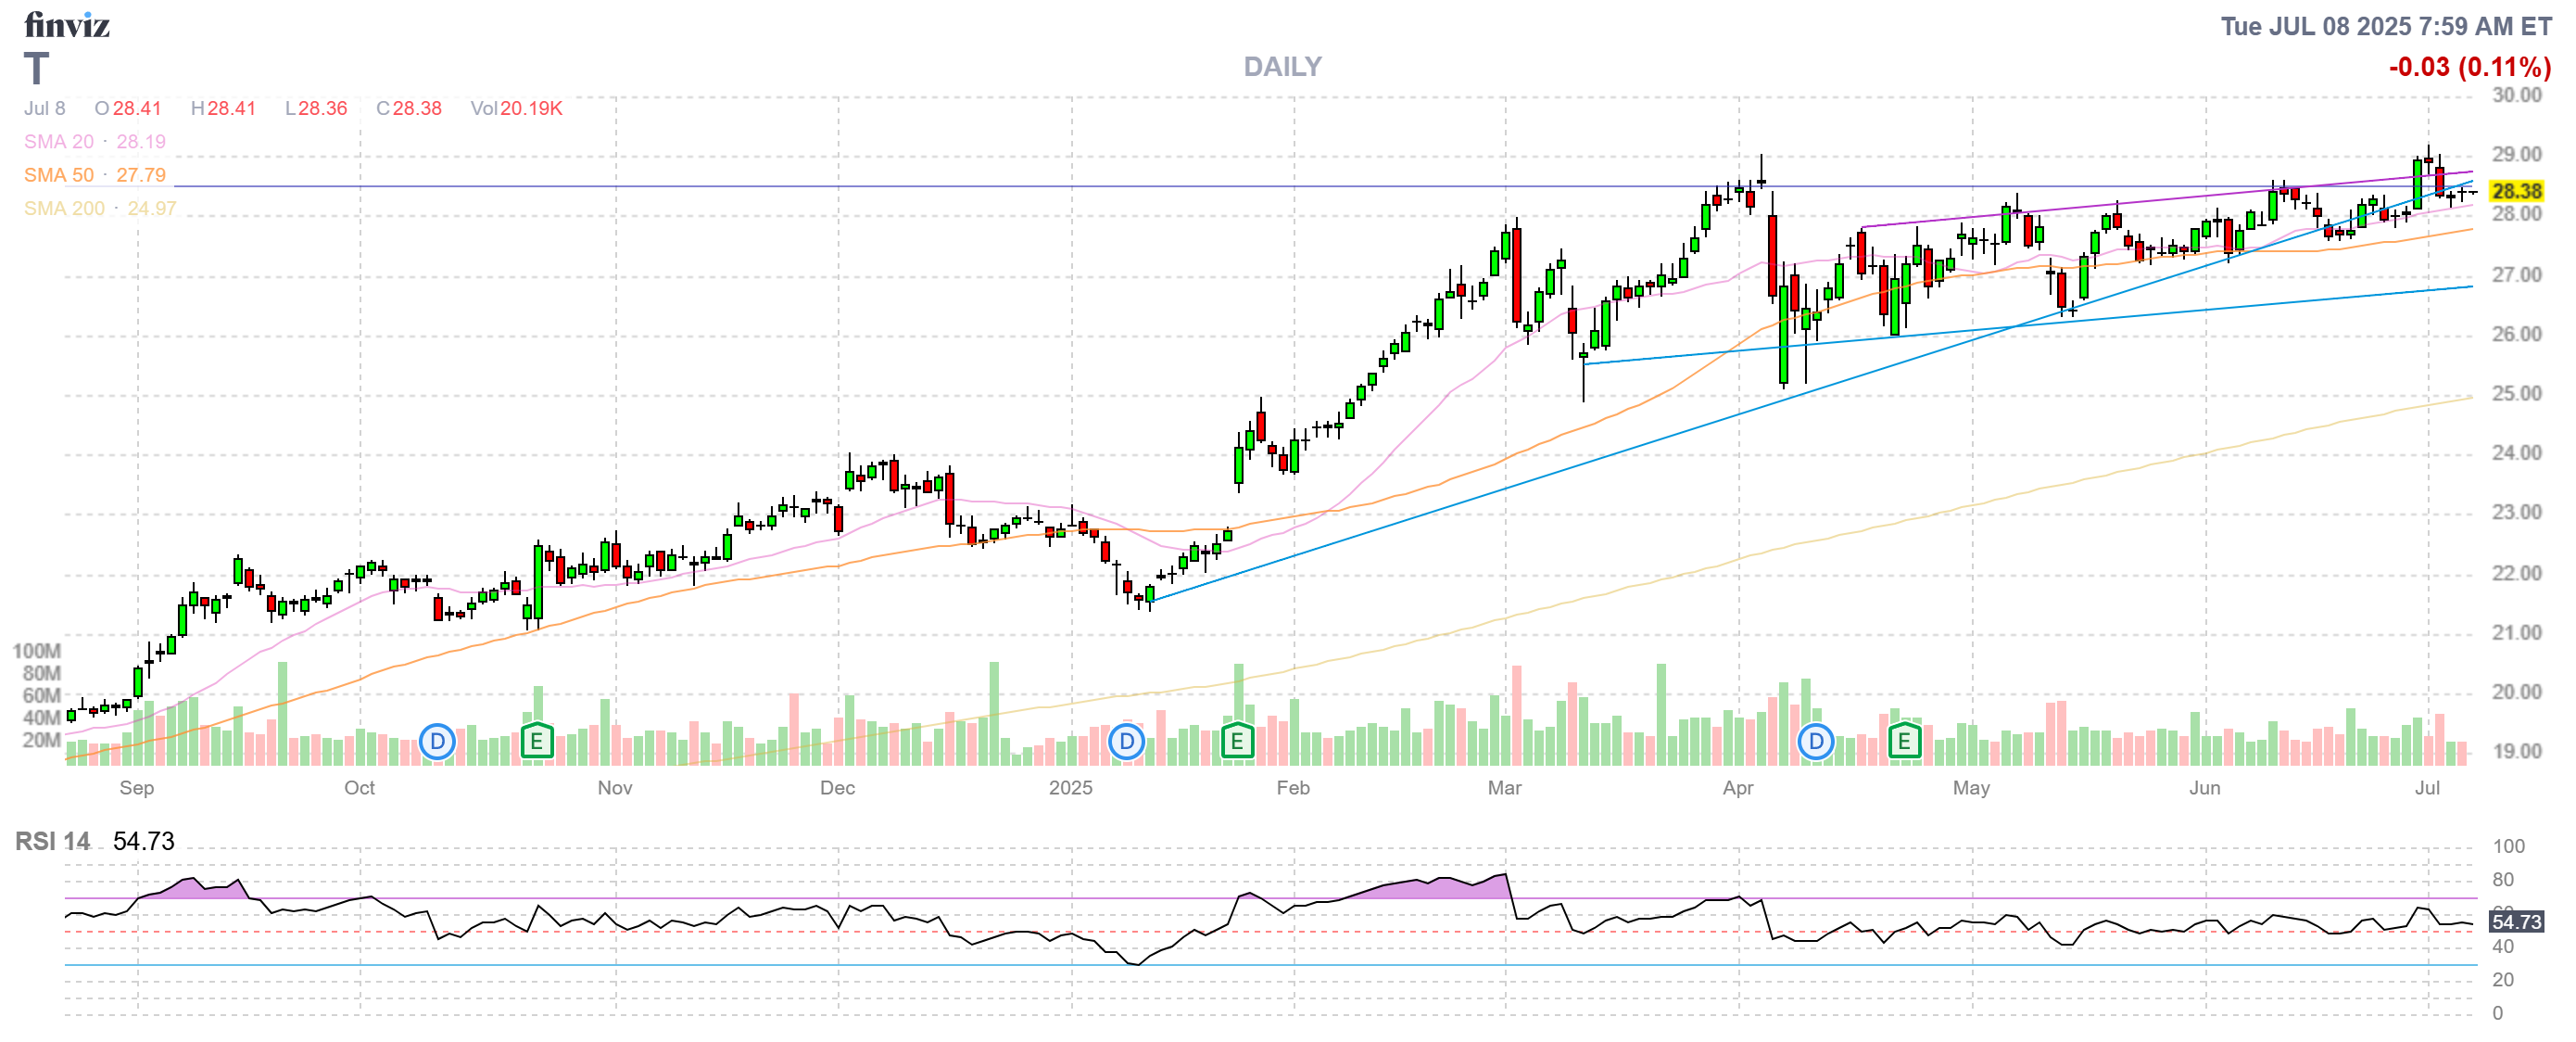
- T – We fully expect the short puts to expire worthless, so there’s no reason to buy them back early so we have $383 (100%) of upside potential over the next 6 months.
-
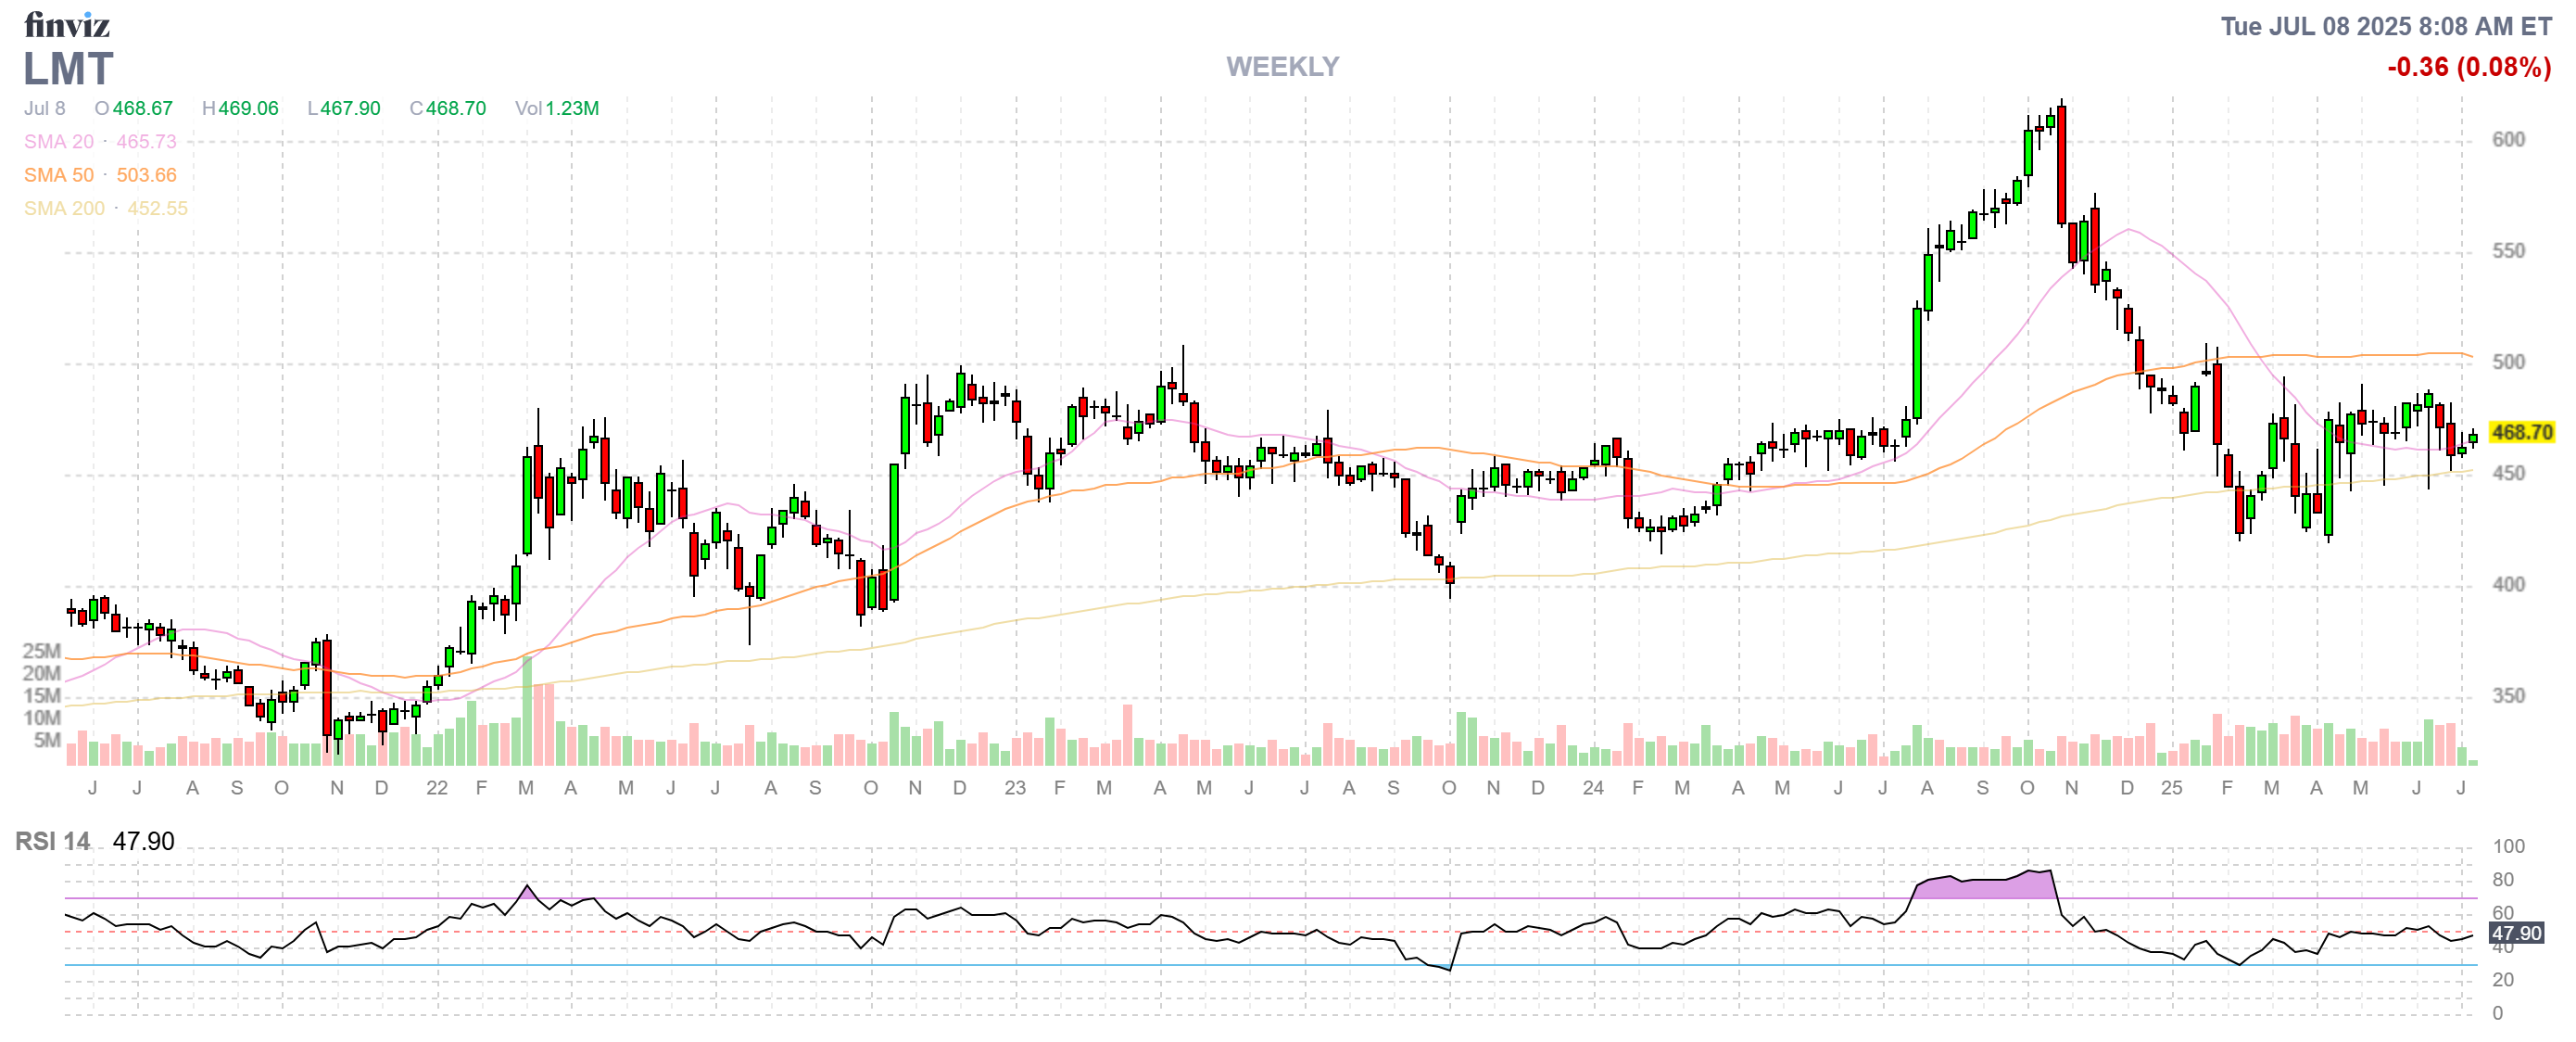
- LMT – Last review, we bought back the successful part of this trade (the short calls) and the current net loss is an improvement and we have a small overall profit. When evaluating a portfolio position, you want to consider it as a brand new trade. For instance, would I sell 2 LMT 2027 $400 puts for $25.30? That would net us into 200 shares of LMT at net $374.70 and the stock is currently $469.06 – so it would be a $94.36 (20.1%) discount – that sounds good to me!
- We like LMT and they are undervalued at 15.6x forward earnings and those earnings are probably underestimated as Trump is dropping bombs and Israel is dropping bombs and intercepting missiles as well as Ukraine… Well, it never ends, does it? Trump’s $1Tn+ Military Budget will be good for LMT so we’re going to leave them aggressively uncovered for now. At $550, the $470 calls would be $80 ($24,000) and the current net of the trade is $12,820 so we have $11,180 (87.2%) of upside potential but also we’ll sell more calls to reduce our basis – just not yet.
-
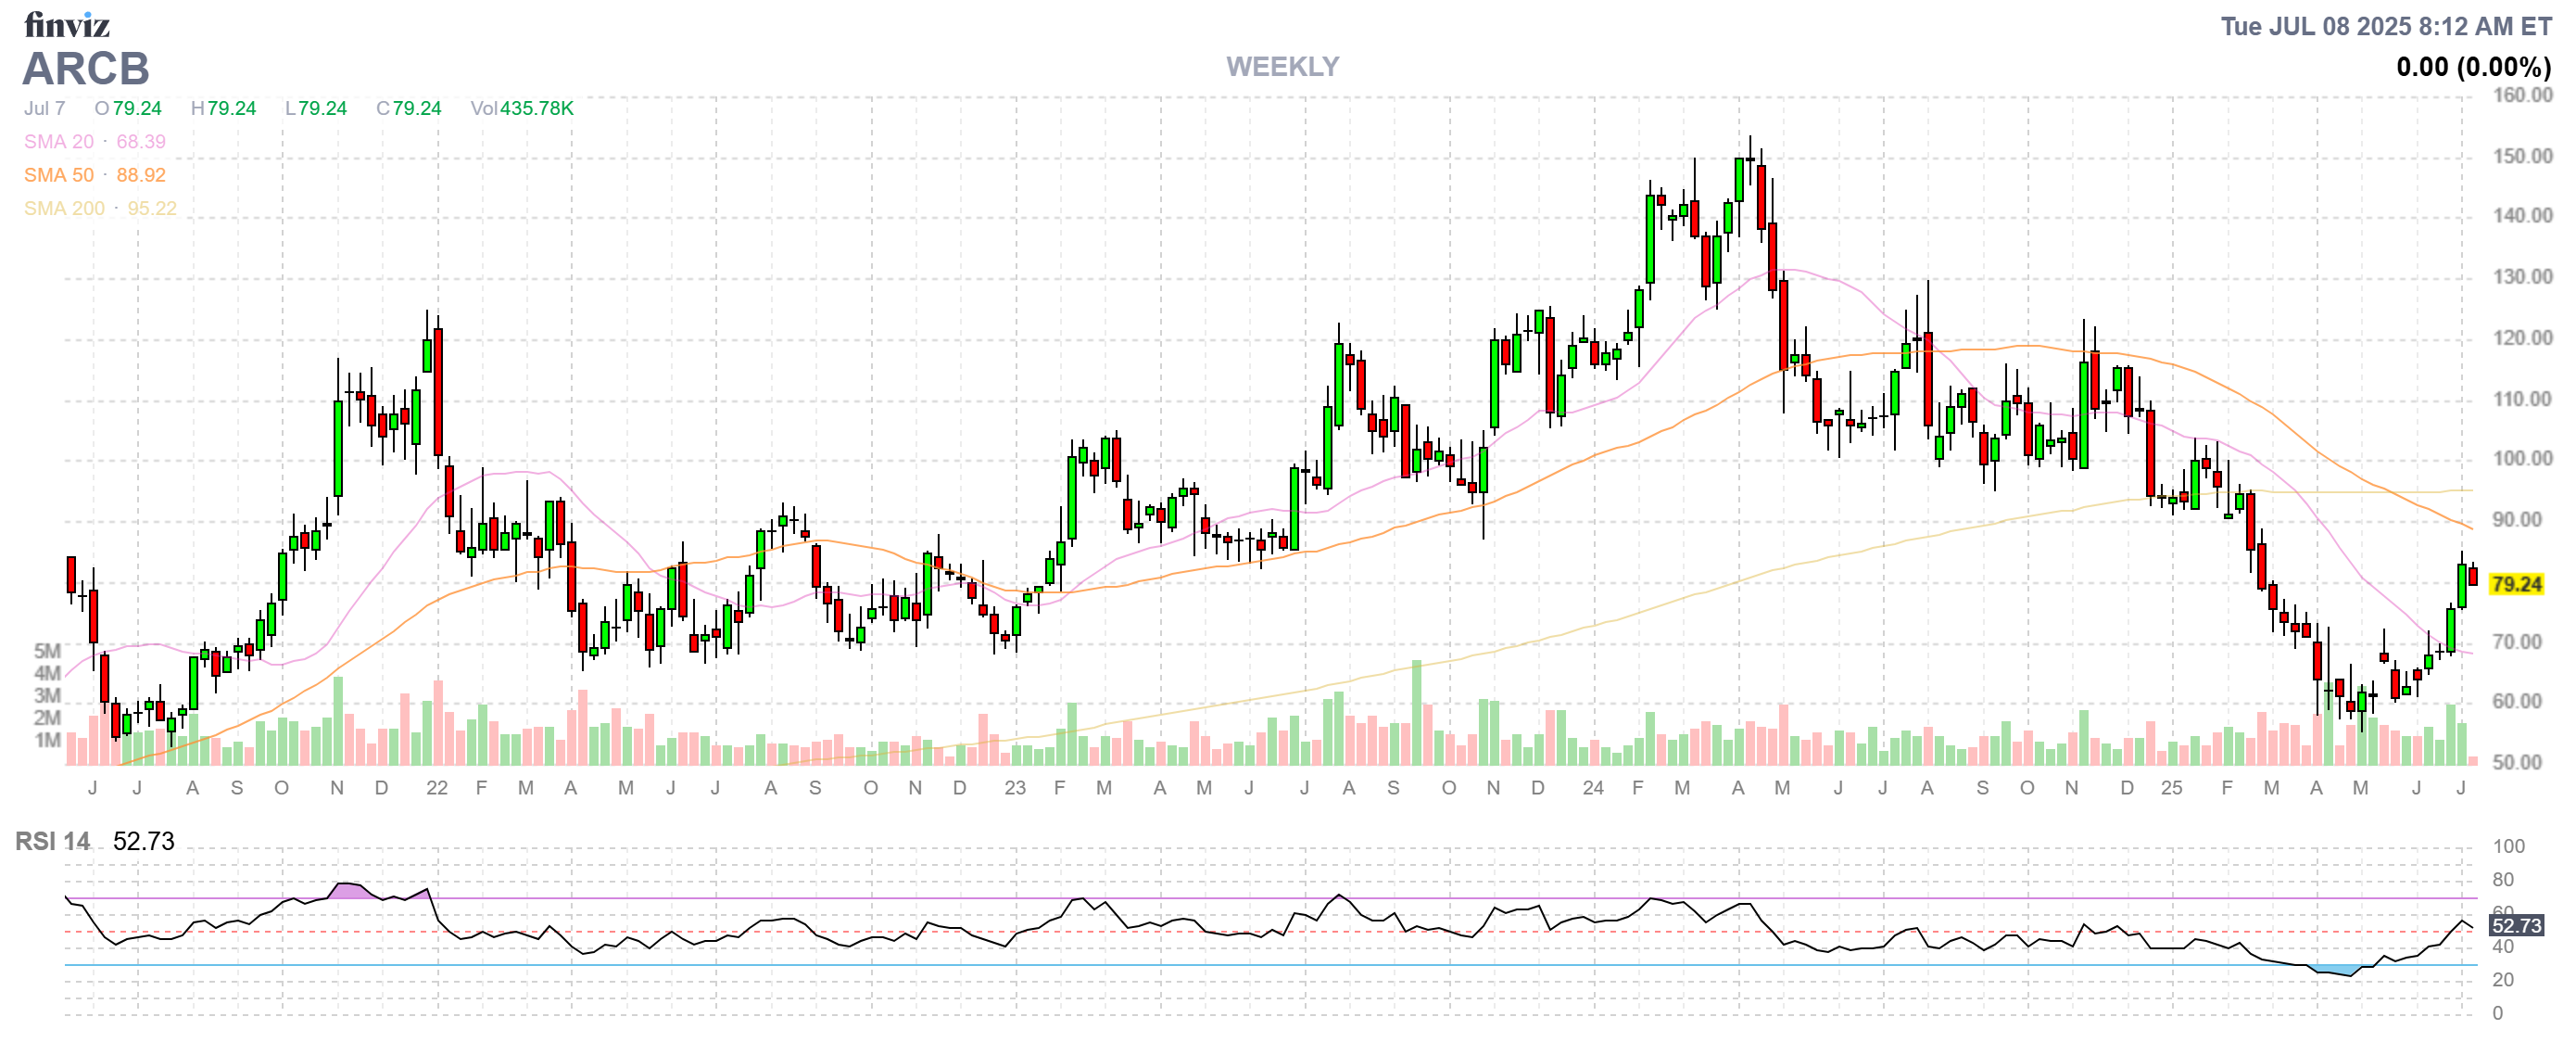
- ARCB – One of our new trades! Doing very well already so no notes at net $5,200 and that’s up $4,200 (420%) from our net $1,000 entry and it’s a $20,000 spread so we STILL have $14,800 (284%) left to gain – still very good, even if you missed the first 420%…
-
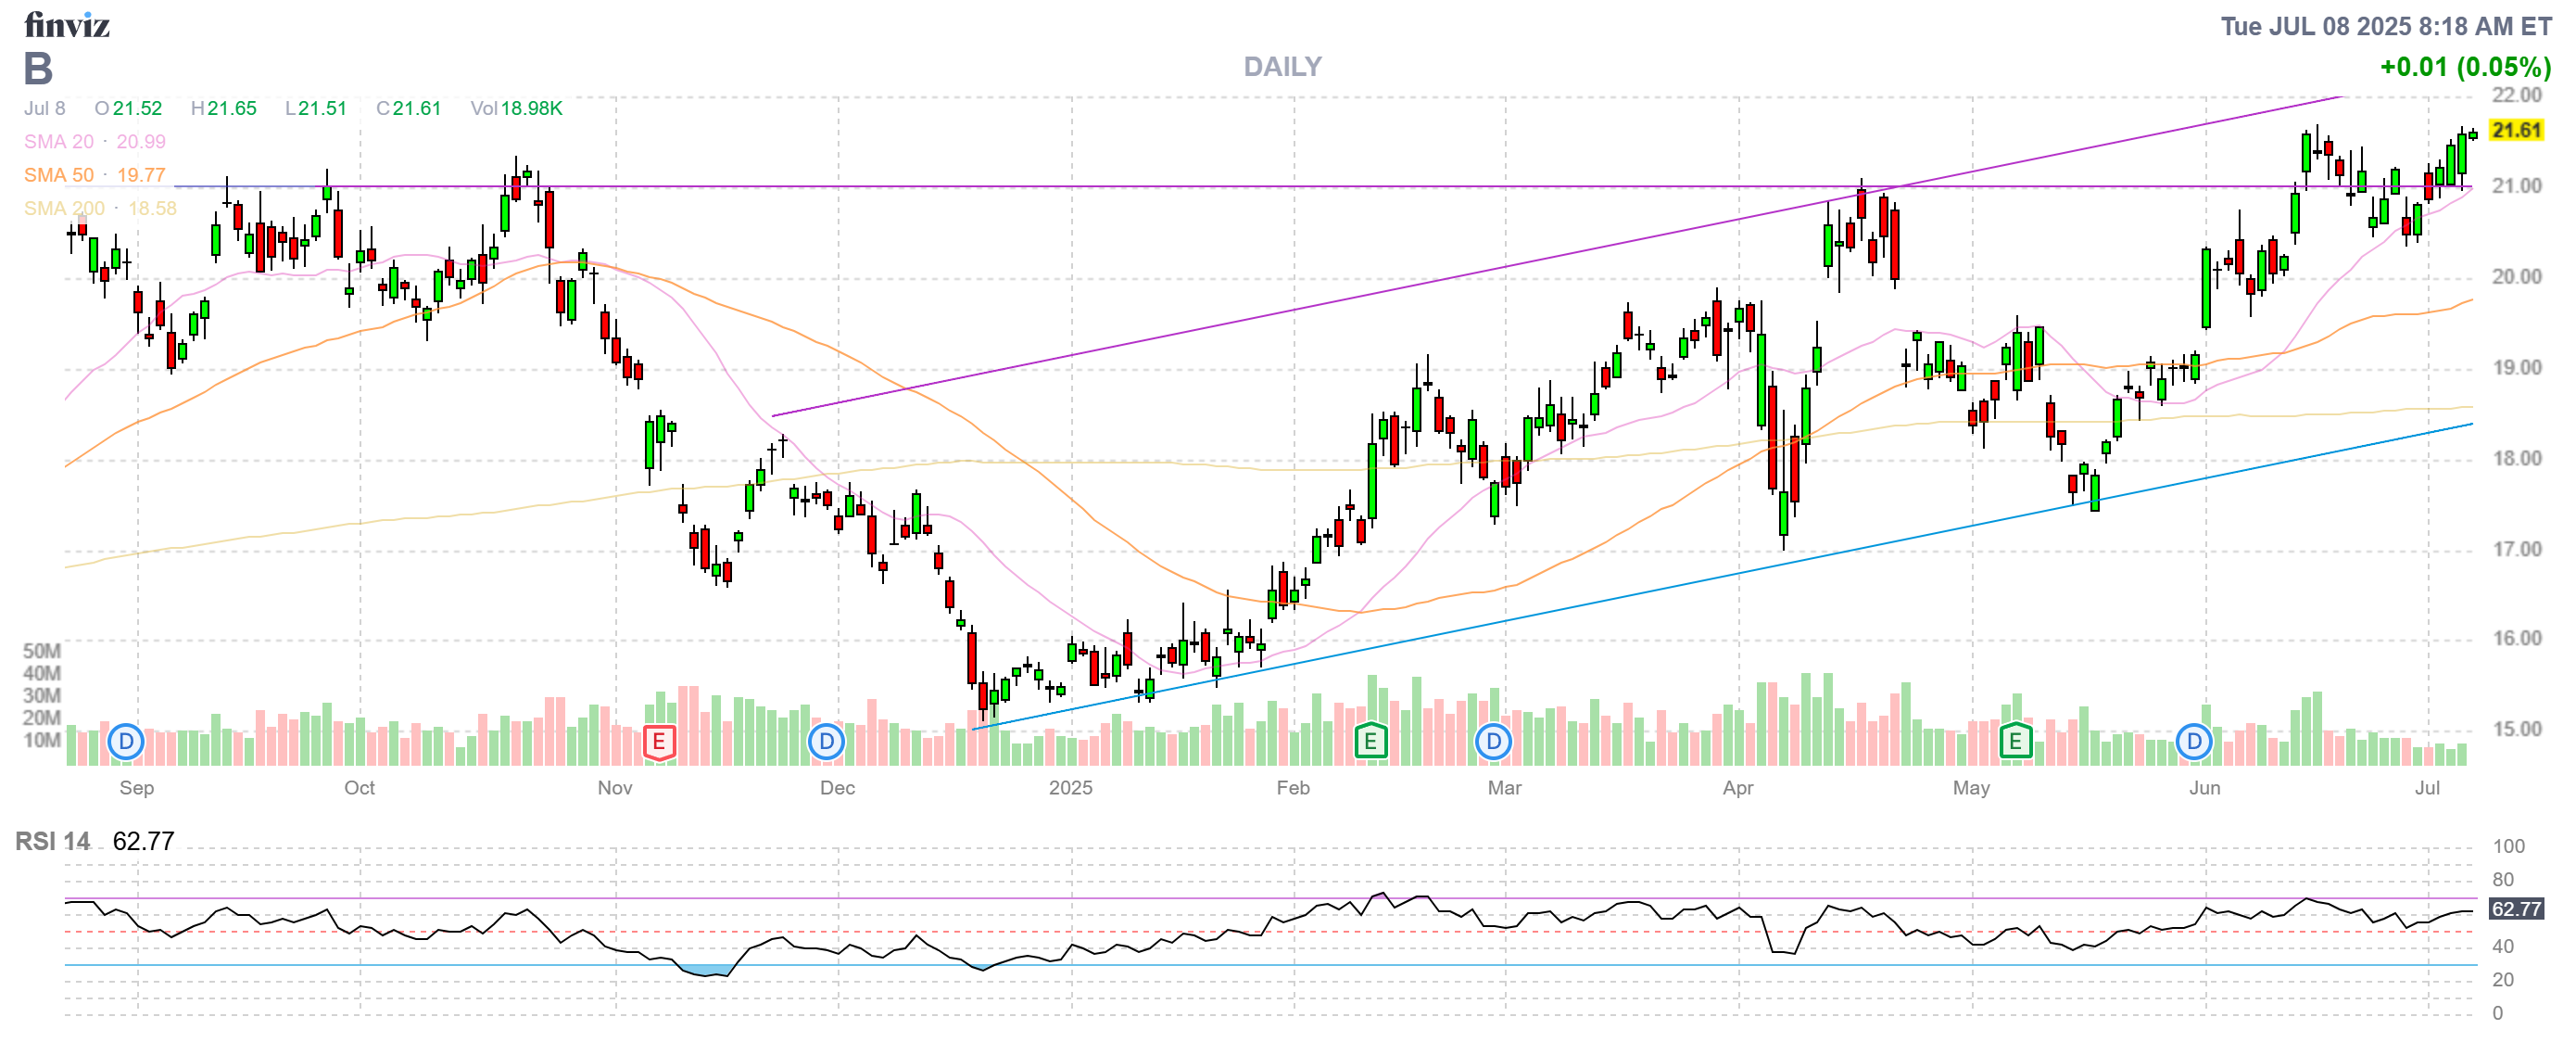
- B – We have 5 uncovered calls so it would be a sin not to turn that into some income. Let’s sell 7 Jan $22 calls for $2 ($1,400) as that drops our basis to $4,350 and we’re currently net $9,702 so that’s up $5,352 (123%) with $5,298 left to gain + whatever else we can sell in 2026.
-
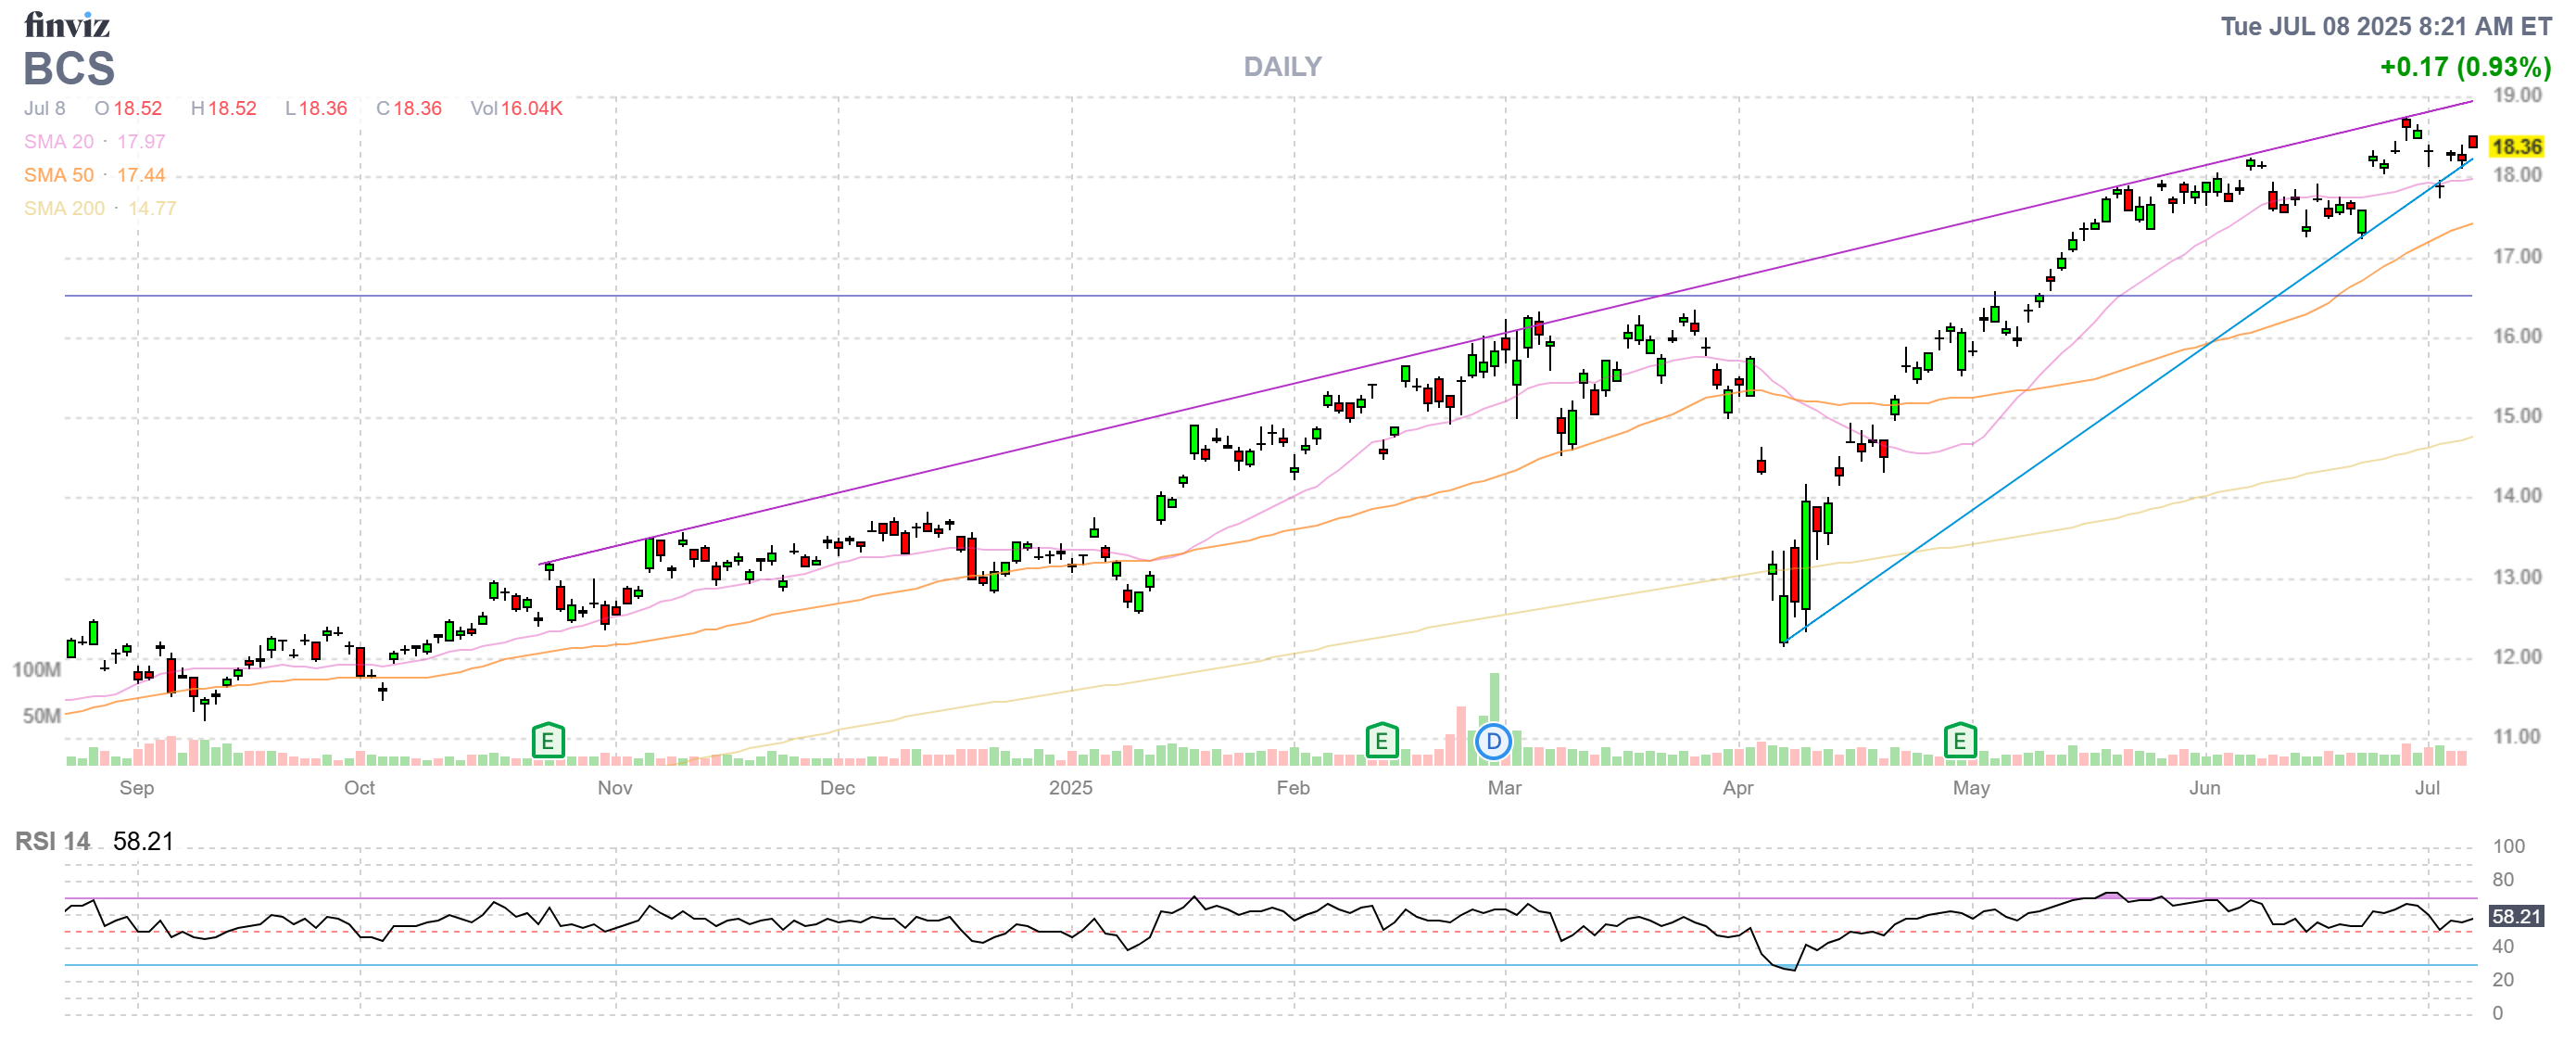
- BCS – Miles above our target at net $5,700 on the $8,000 spread so there’s $2,300 (40.3%) left to gain but it’s kind of dull. At least we’re done in 6 months so may as well be patient as 40% in 6 months is not a fish you want to throw back, is it? And all they have to do is hold $12 (or not drop more than 33%).
-
- FL – As noted above, they are getting bought and the current net is $36,200 on the $40,000 spread for just the bull call spread and we don’t have any reason NOT to wait to collect the last $3,800 (10.5%) there and, including the short puts, our net is $34,000 with $6,000 (17.6%) left to gain – normal trading services would consider that good for 18 months, right?
-
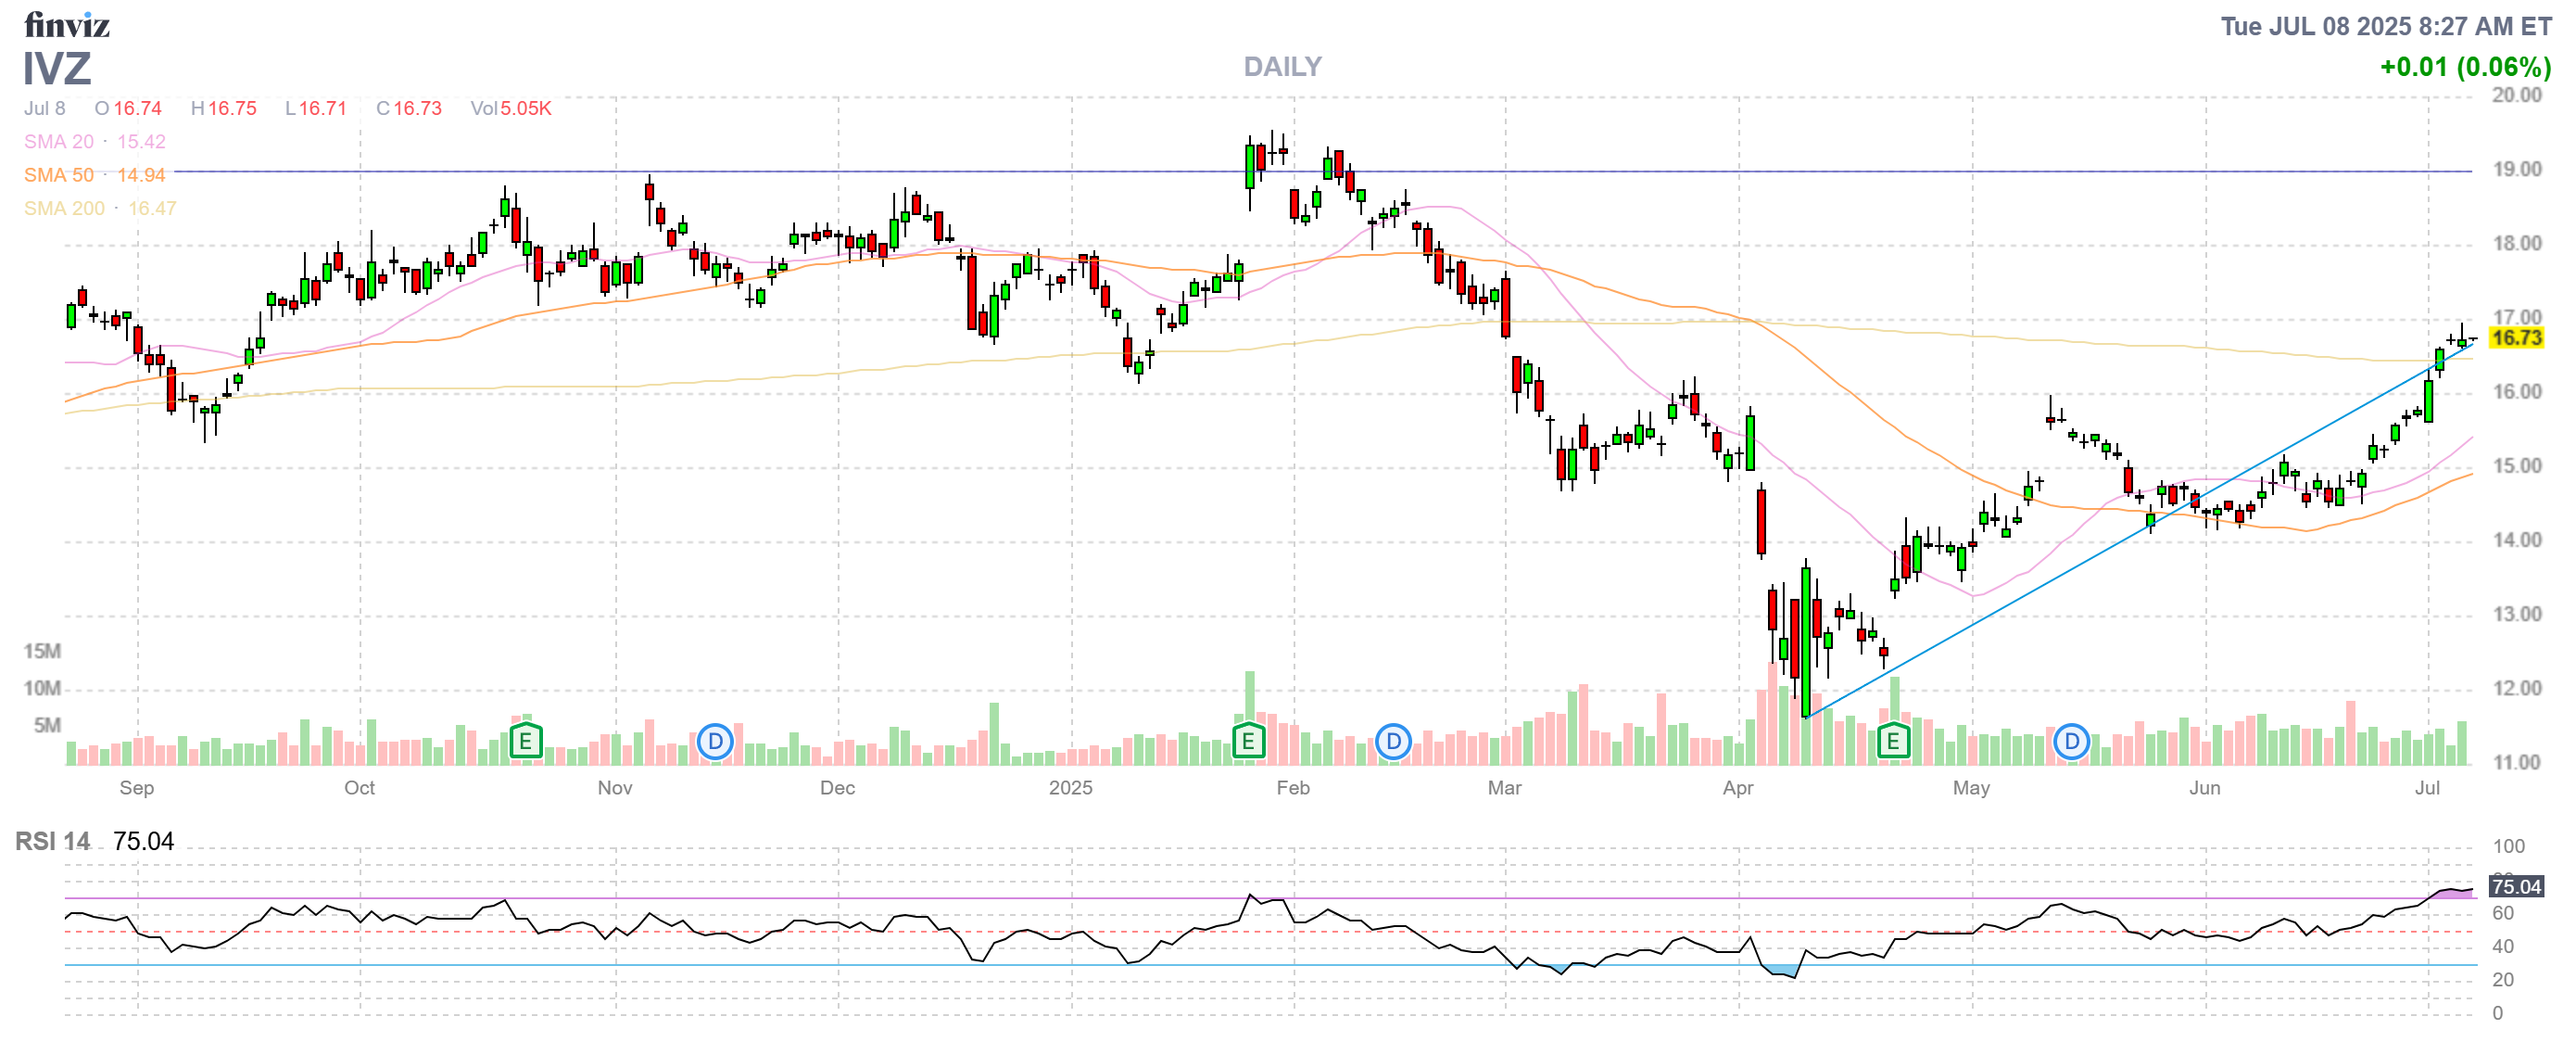
- IVZ – This one is right on track at net $8,475 on the $21,000 spread so we have $12,525 (147%) upside potential and some 2026 income potential as well.
-
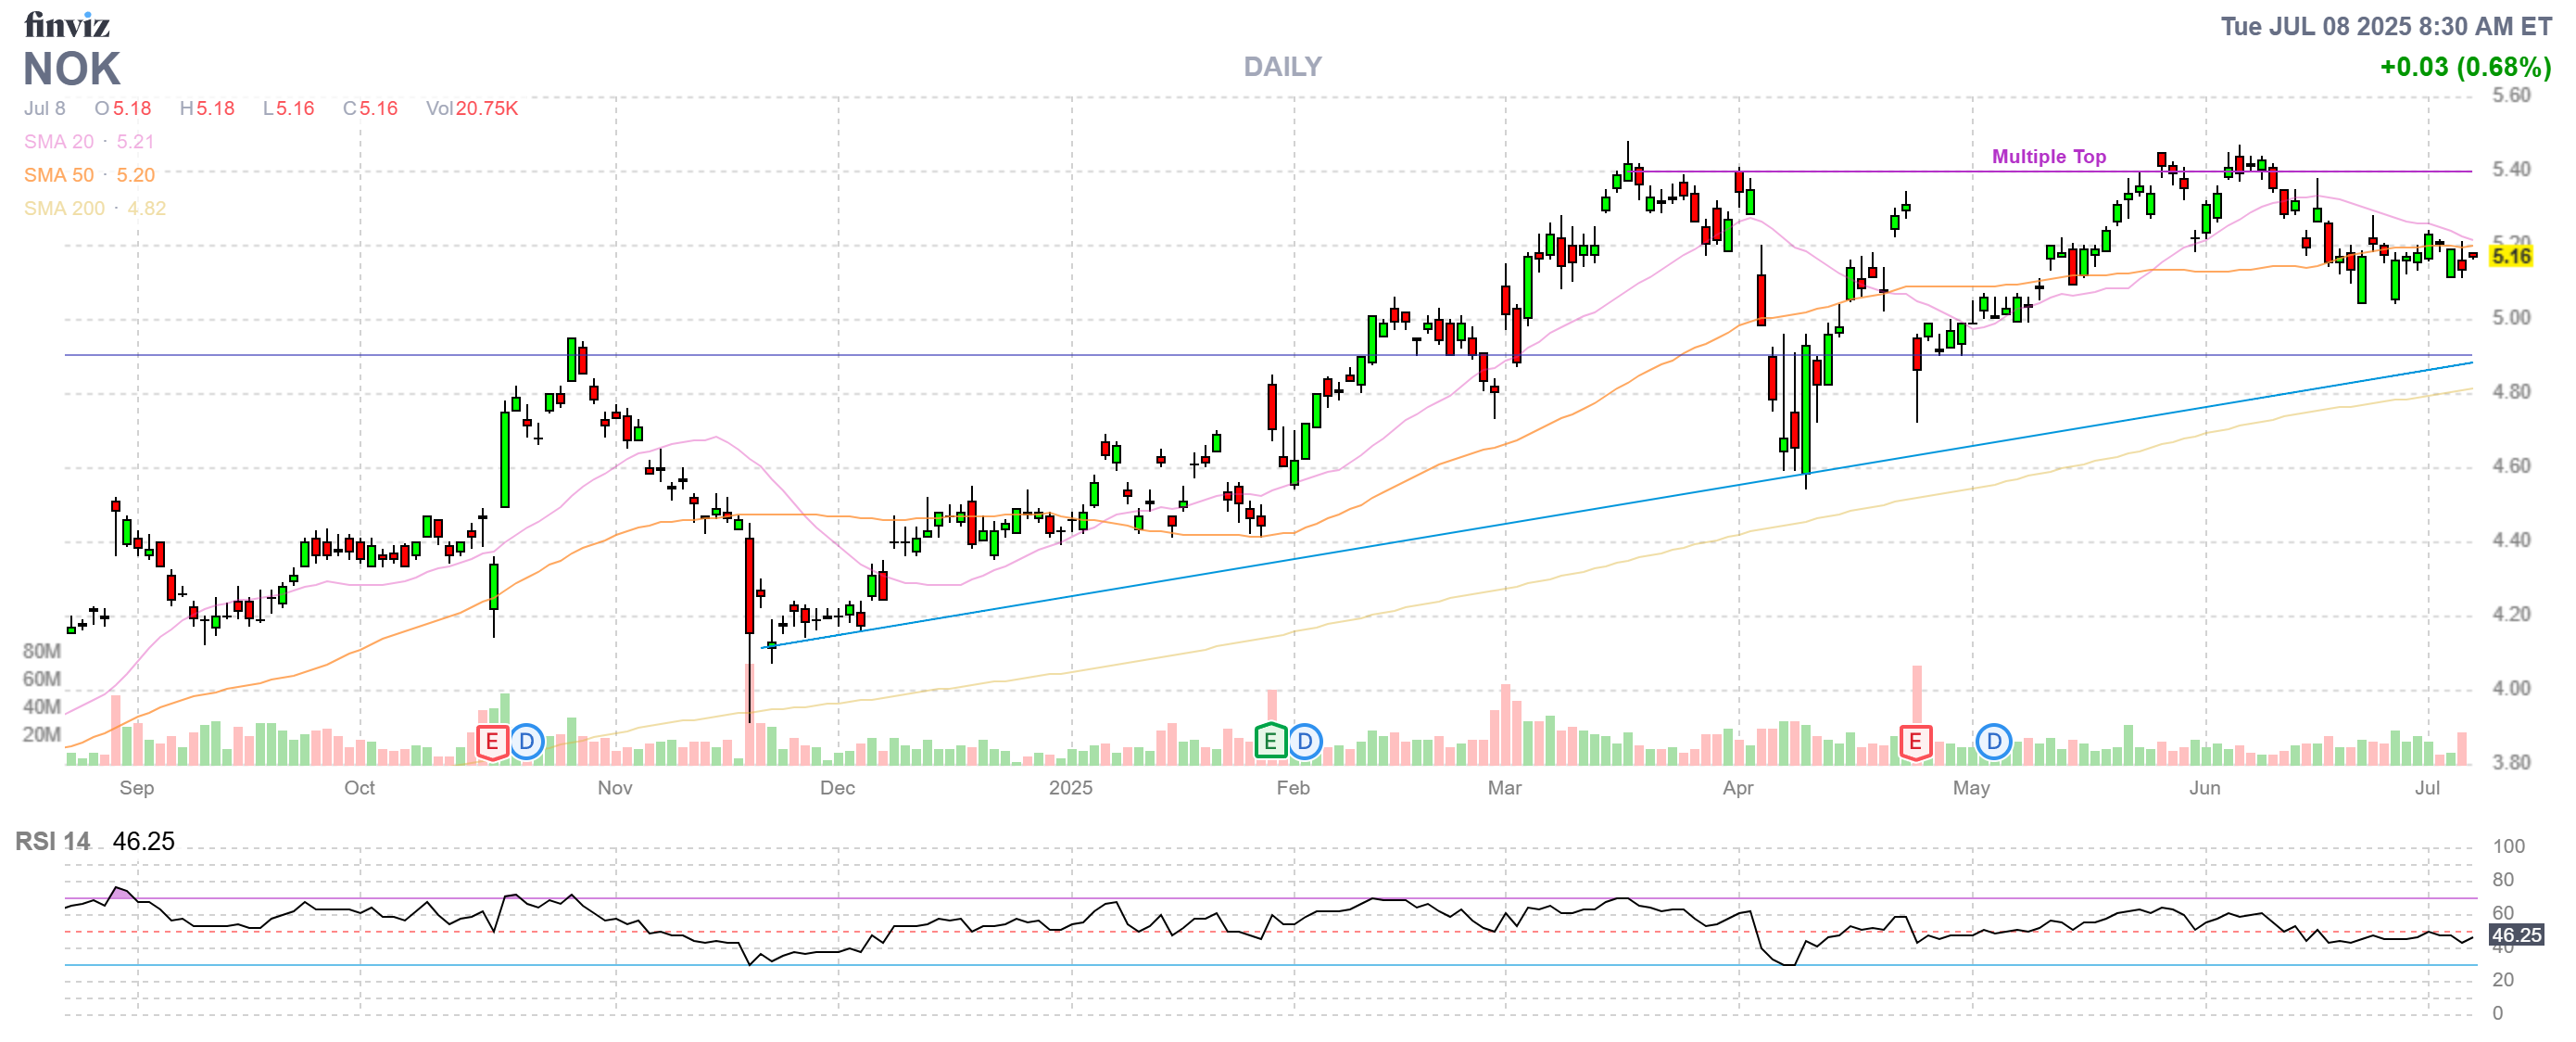
- NOK – They are already at goal at net $5,140 and it’s a $7,500 spread so we still have $2,360 (45.9%) left to gain so I guess… yawn… we’ll keep it.
-
- OZK – Another one of last Qs new trades. Already up nicely at net $9,525 and that’s up $5,825 (157%) since March with $15,475 (162%) left to gain and we’re just $2 away from goal with 18 months to go. Great for a new trade!
-
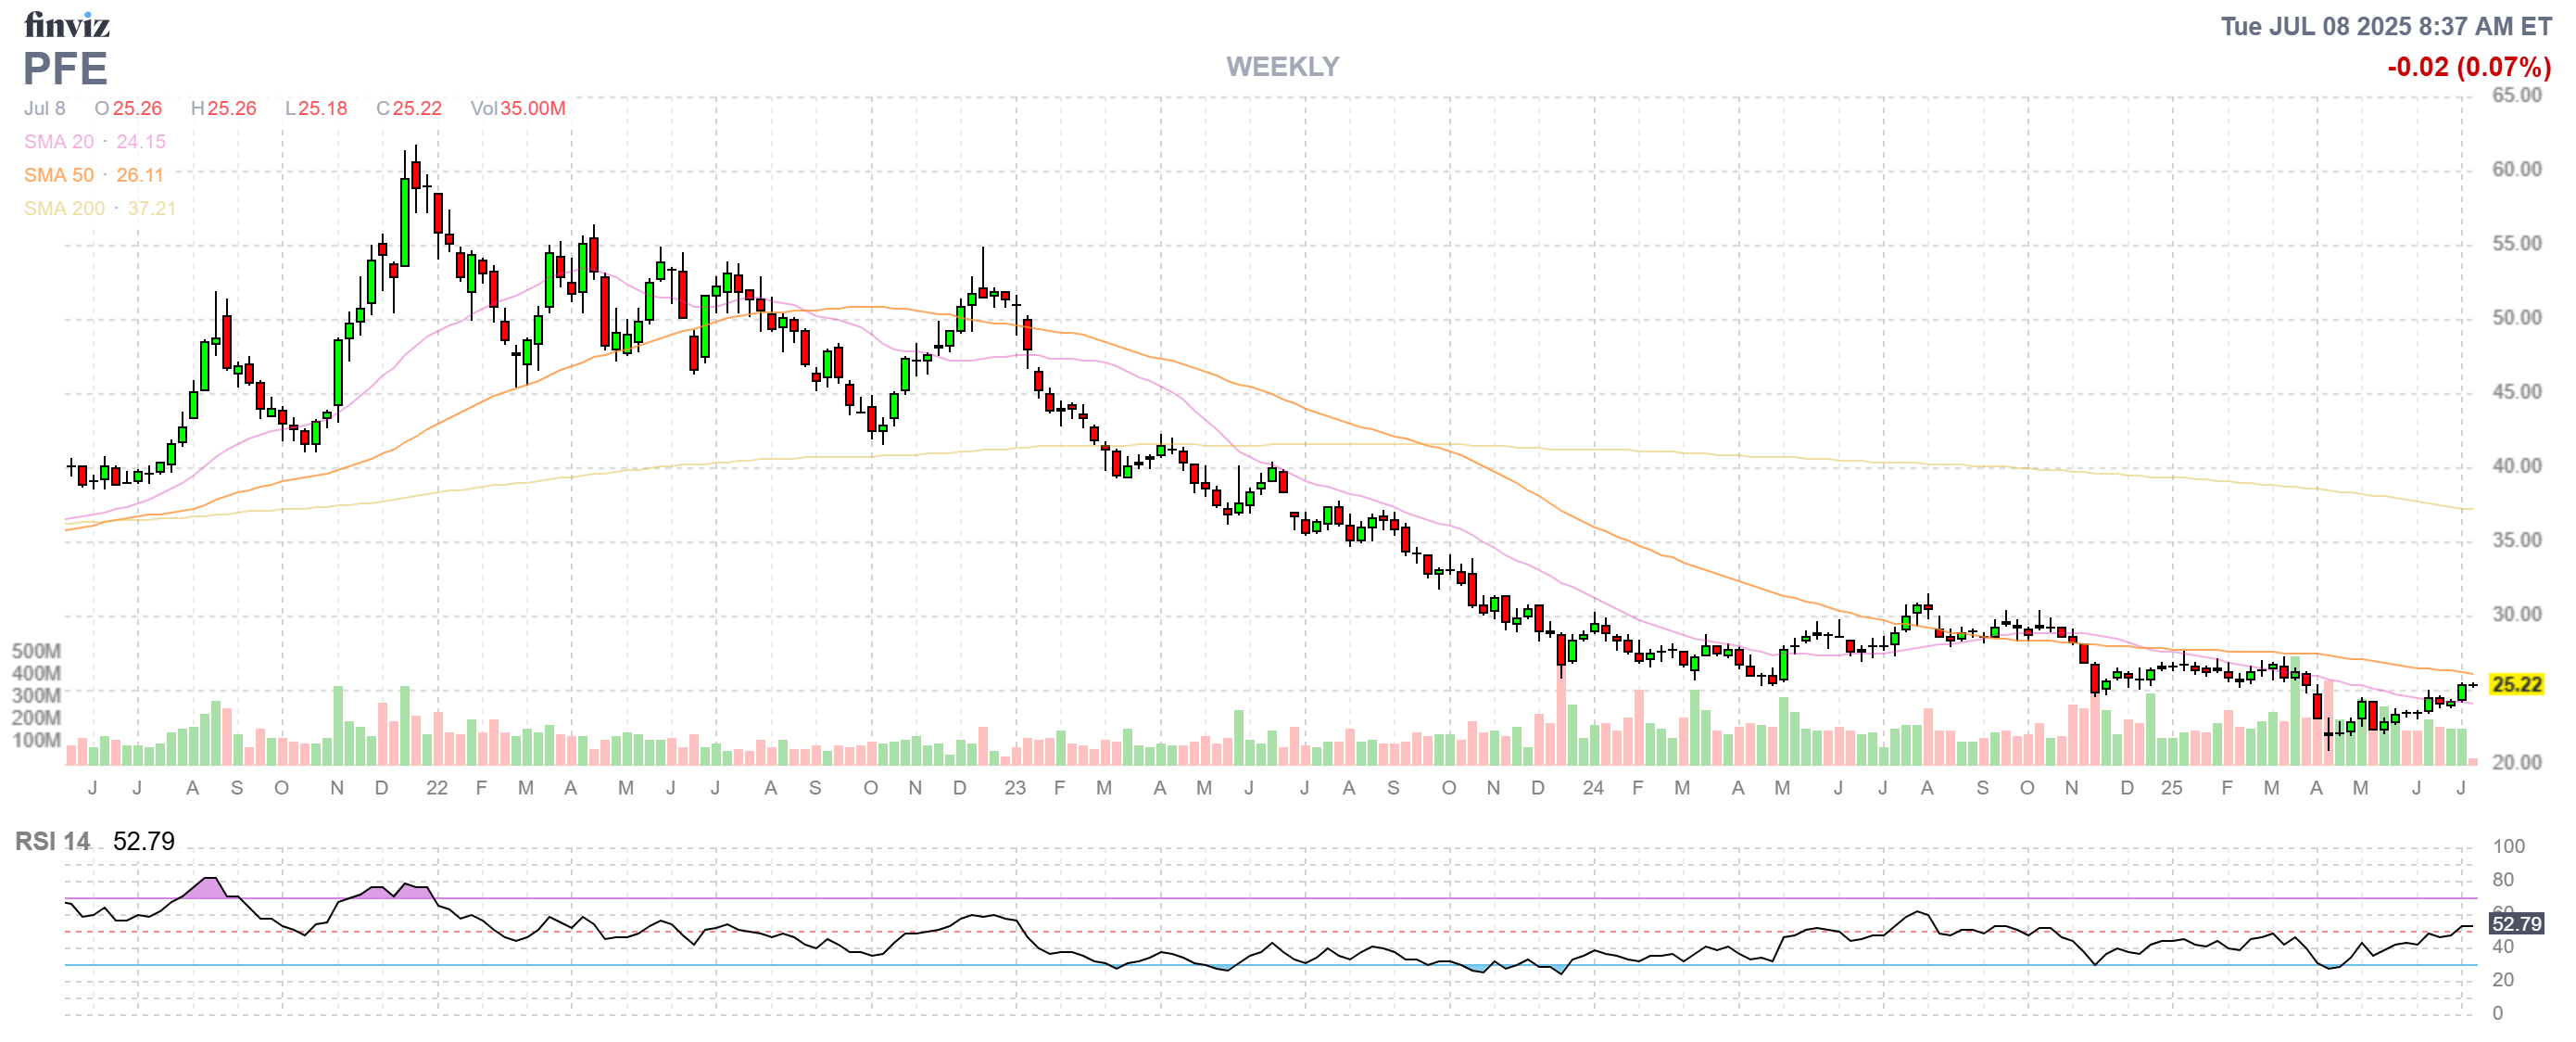
- PFE – It causes me physical pain not to have PFE, AAPL, IBM, T, CSCO, KO and a few more in our portfolios. Of course, they don’t all fit in all portfolios but, when they get low – we try to buy them. PFE was low and they are only just starting to make a move back to the $30s, where they should be. We sold short July puts and calls and we’ll buy back the short July calls – as they can only hurt us. We’ll give them a chance to run up on earnings but there’s no reason we can’t sell 7 Oct 26 puts for $1.75 ($1,225), which drops our basis to $1,165 and the current net is -$664 so we are DOWN $1,829 (156%), ruining our perfect record! Still, it’s a $14,000 spread so there’s $15,829 (2,383%) of upside potential. Blessed are the losers – because they giveth us great discounts for new entries…
-
- SYF – This was our 2025 Trade of the Year selection back in November. We bought back the short calls for an $8,475 gain back in March and we sold 10 more puts and now we’re at net $21,150 and I think $105 is a reasonable target for 18 months but we can sell 10 2027 $80 calls for $8 ($8,000) and I can’t turn that down as that makes our net entry a $13,325 credit (including our cashed-out profit) and we can also sell 7 Nov $70 calls for $5.75 ($4,025) so now we’re at a net $17,350 CREDIT on the $60,000 spread that’s $30,000 in the money already with $77,350 of upside potential PLUS more short-term selling next year. Aren’t options fun?
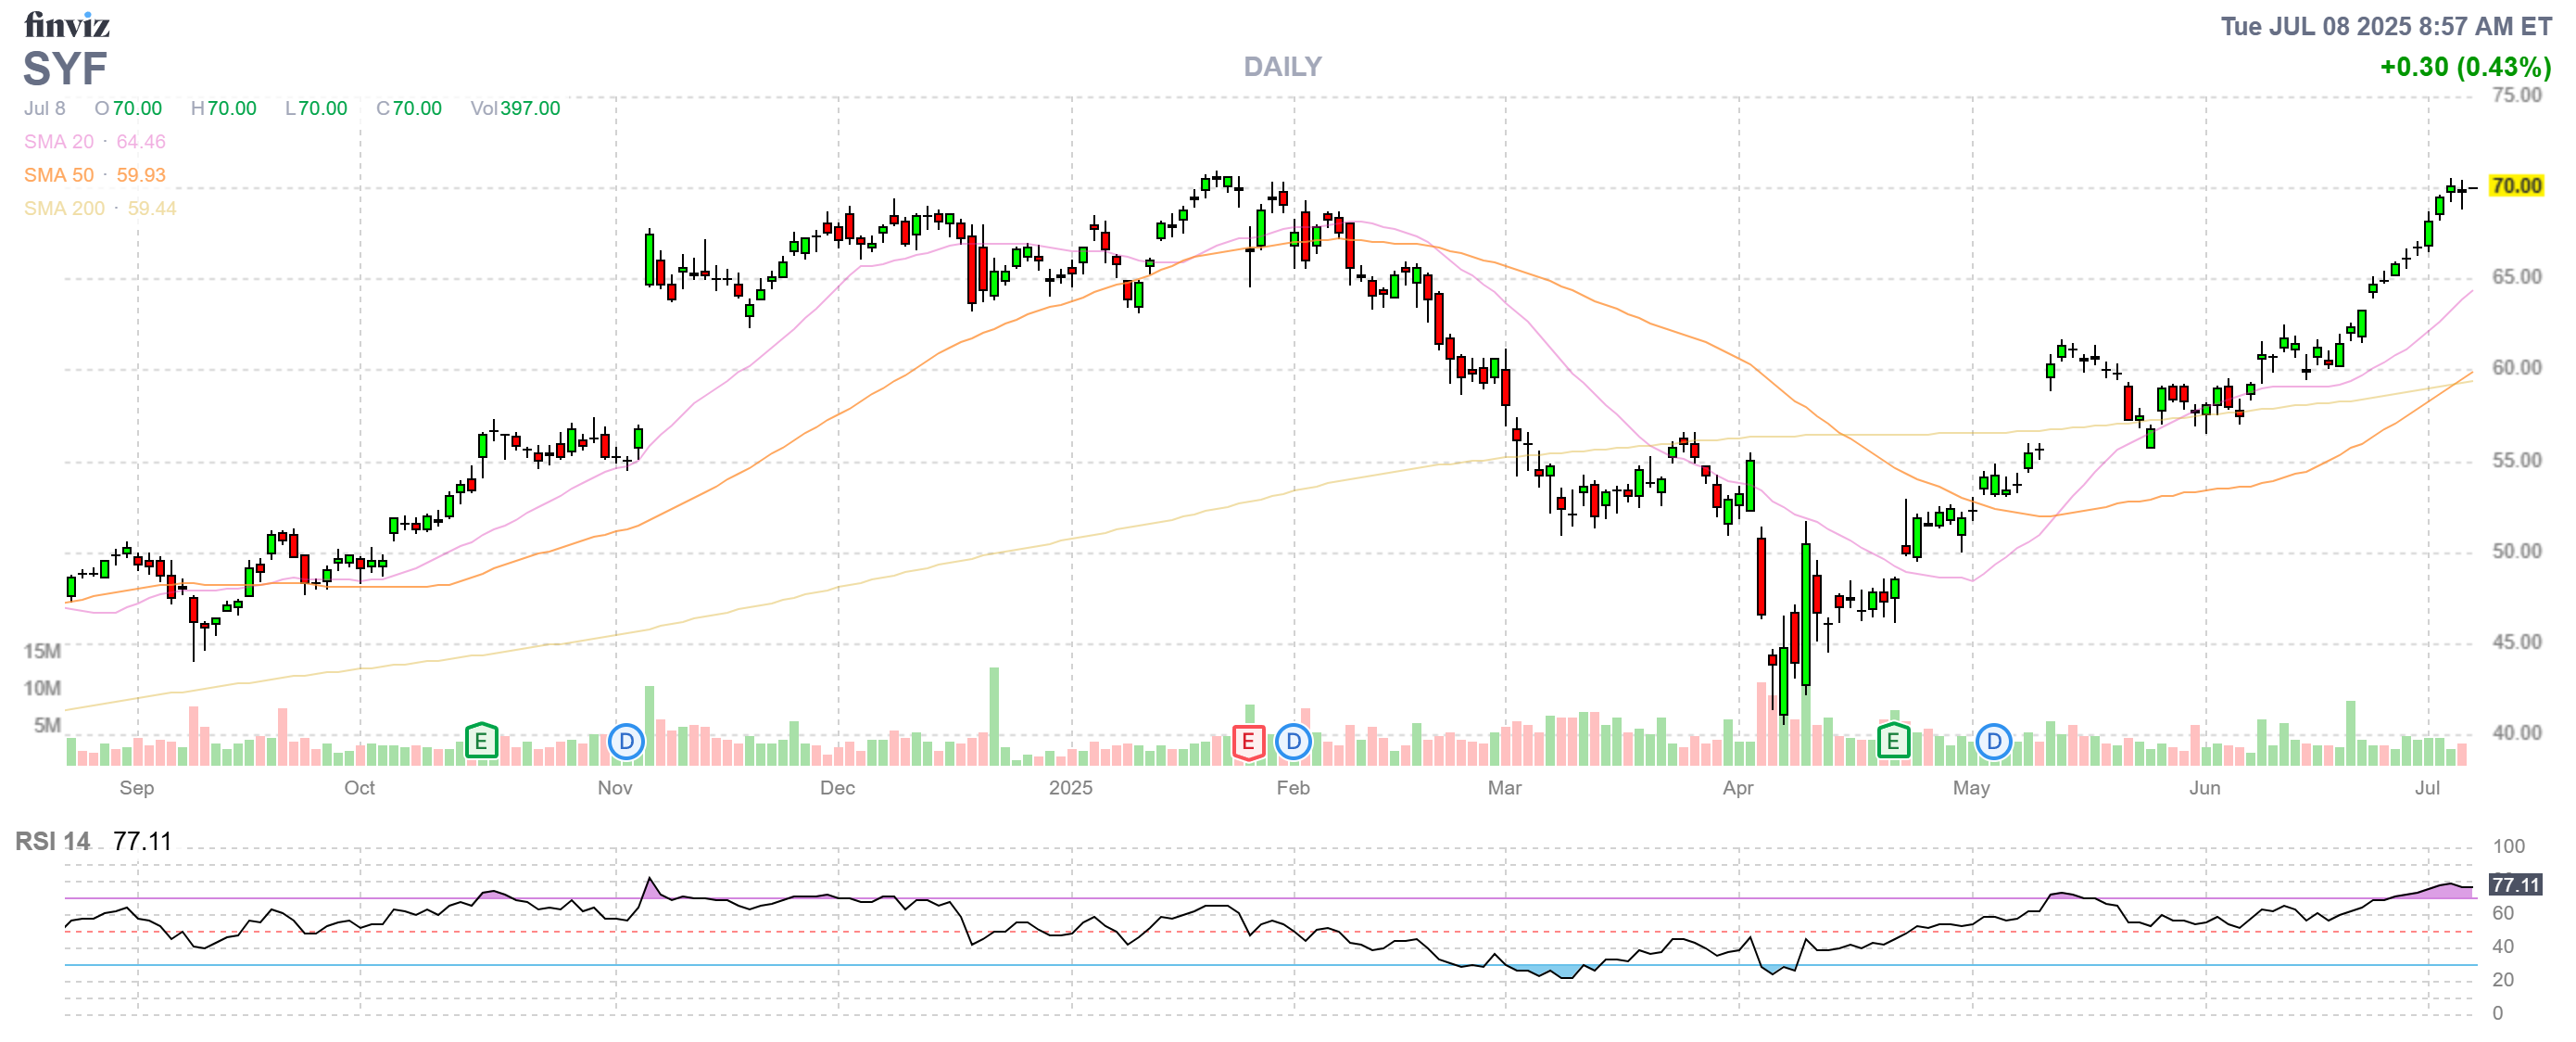
I guess you can see why SYF was our Trade of the Year – so much fun, so much profit!
-
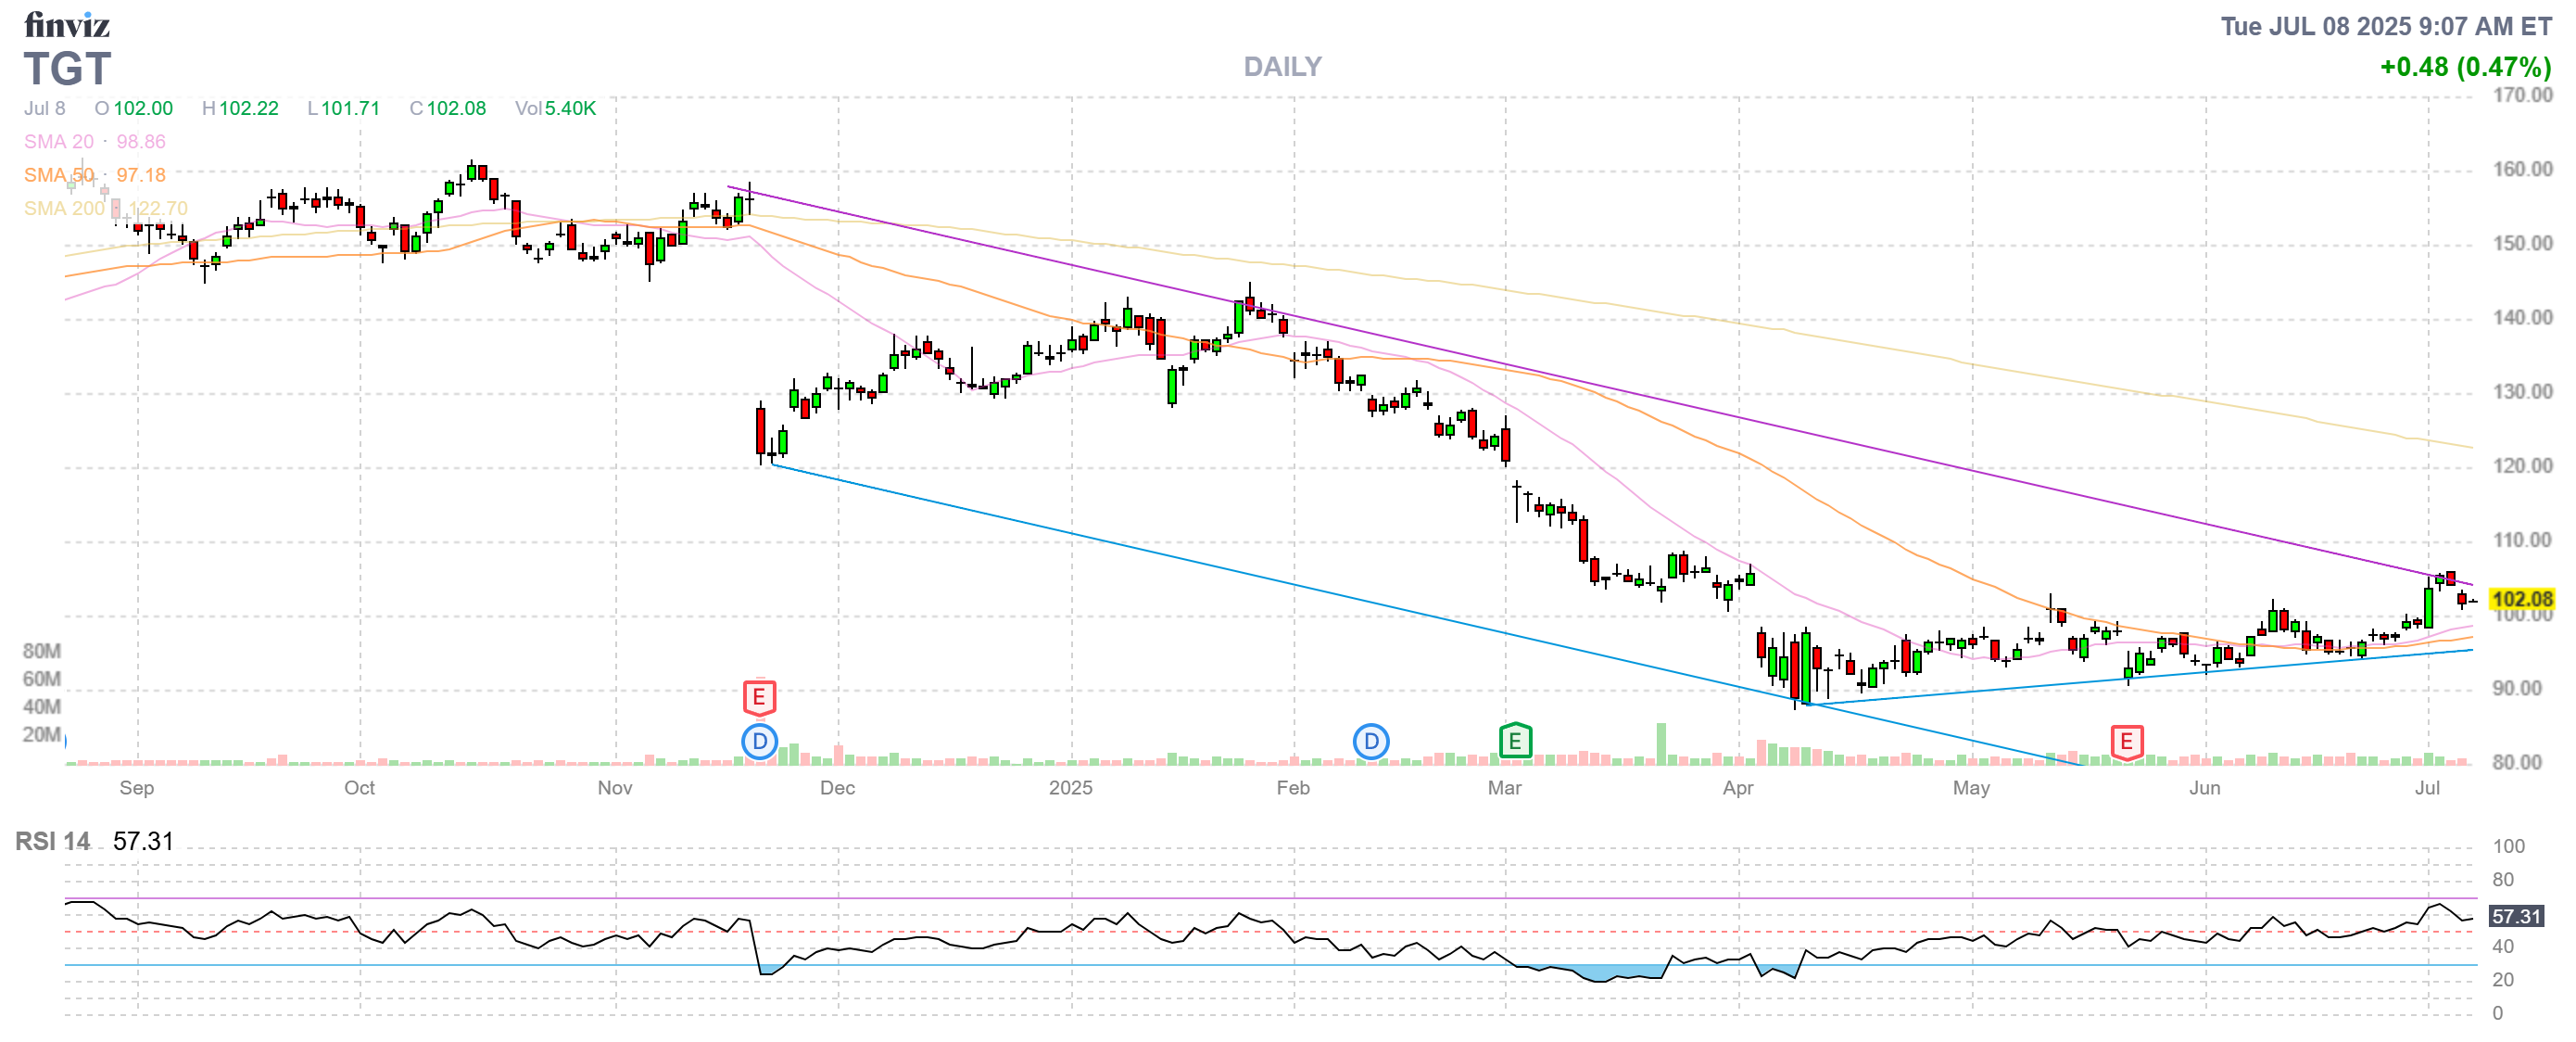
- TGT – Disappointing so far and down $15,280 at a net $16,150 CREDIT but is $150 still a realistic short-call target for 2027? Not likely but $102 is only 12.7x forward earnings so 15x would be about 10% higher than here at $112 so I’d call that a minimum and $120 is very likely so call it a $30 spread and that would be $45,000 for $61,150 (378%) upside potential and I don’t want to sell short-term calls so we’ll just see how the next earnings look. Fantastic for a new trade but you can sell the 2027 $120 calls and make it even cheaper!
-
- WHR – The last of our new trades has been doing all the right things recently and now we’re at net $15,875, which is up a quick $17,075 (1,422%) from our $1,200 credit entry 3 months ago. It’s a $30,000 spread so we still have $12,925 (75.6%) upside potential and we do have uncovered calls so let’s sell 7 Sept $110 calls for $7.10 ($4,970) to drop our basis to a $6,170 credit.
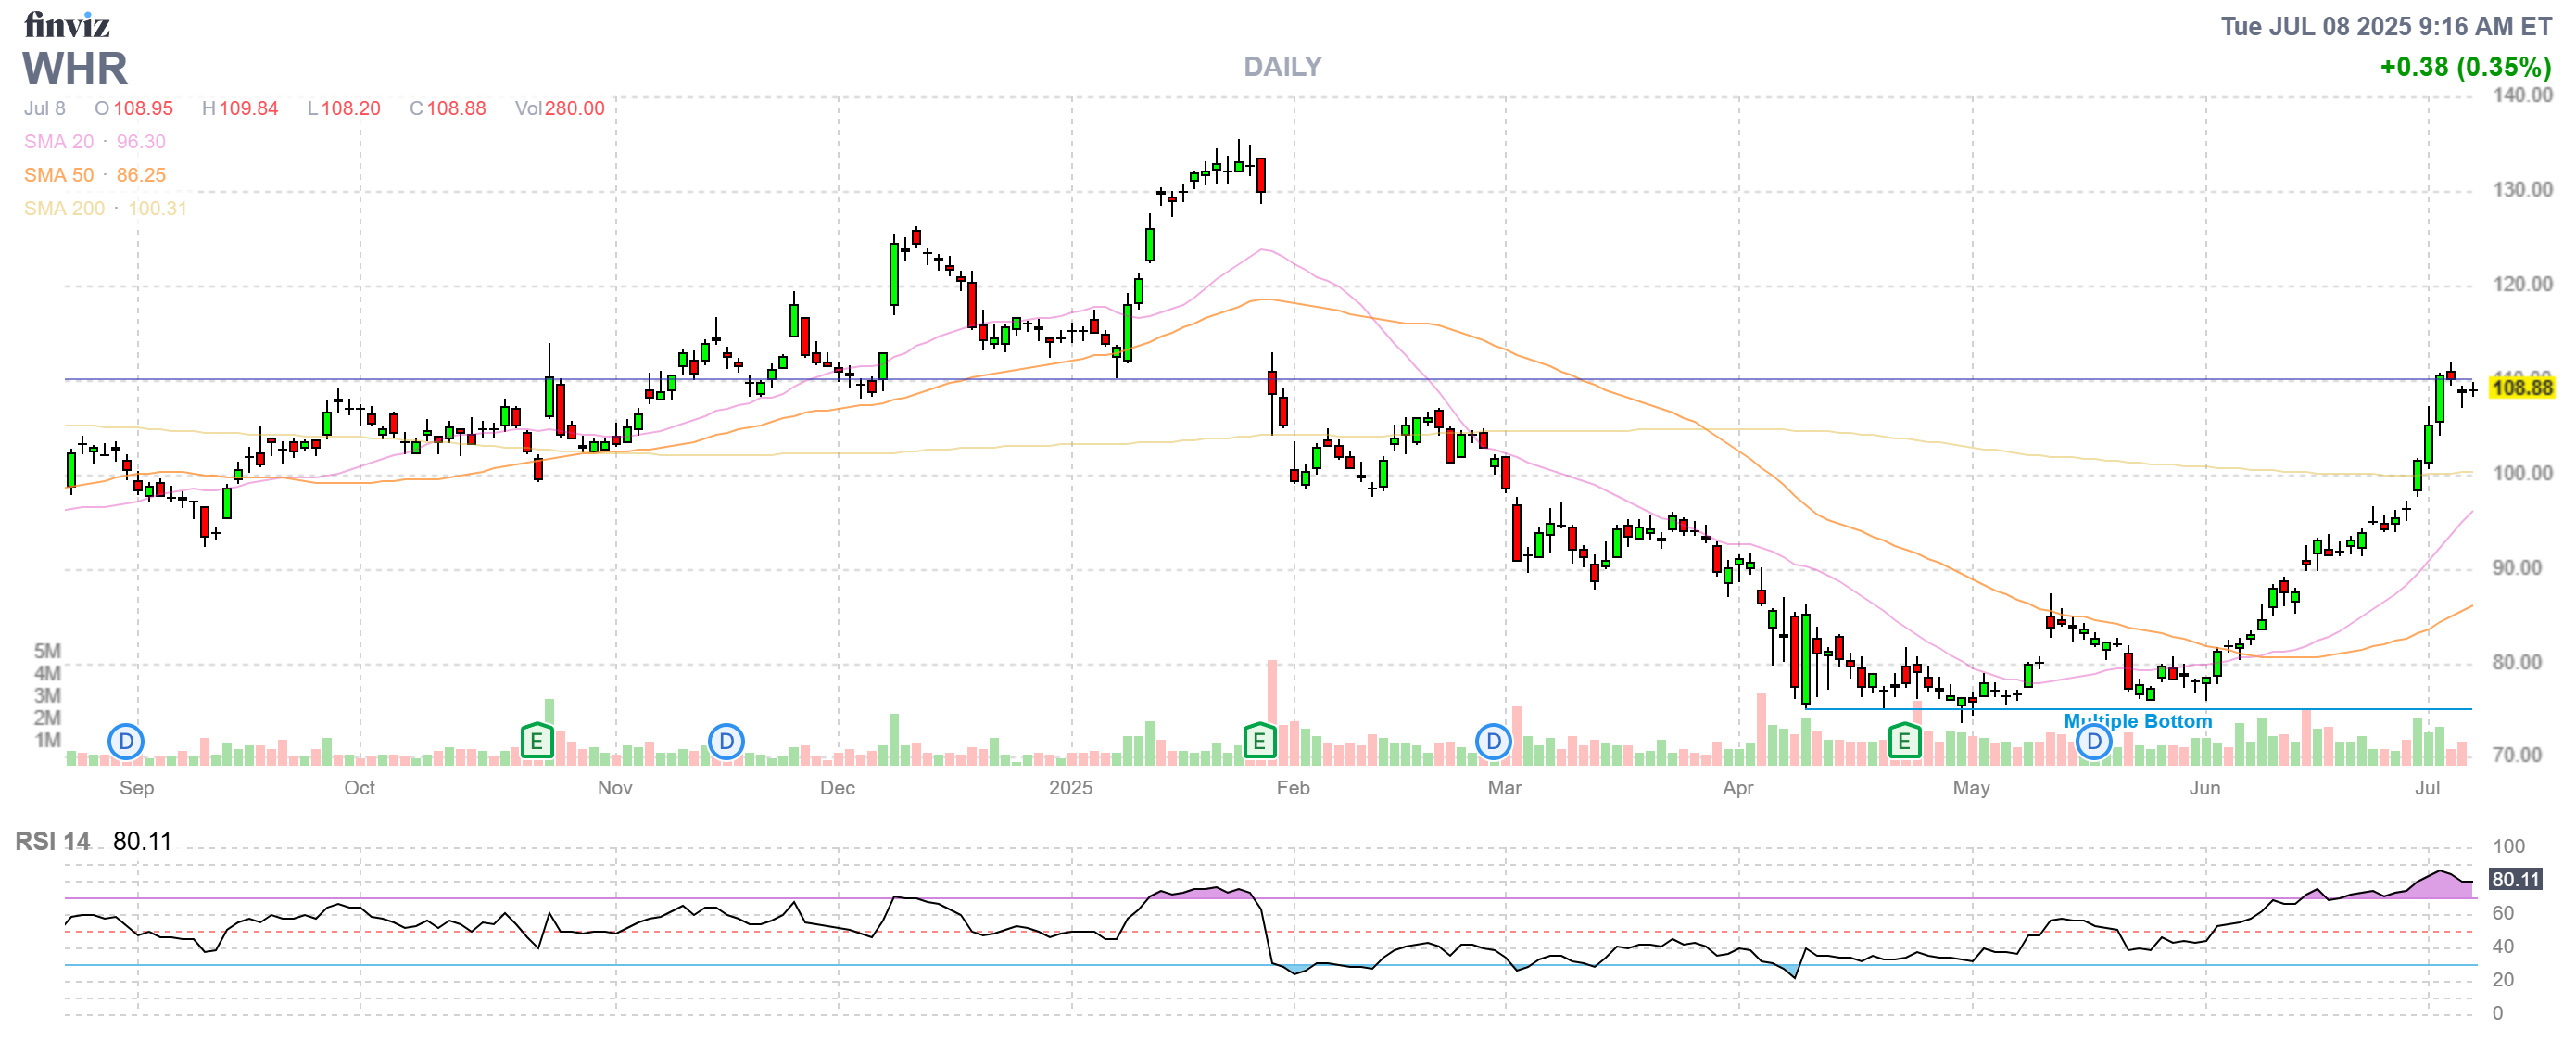
Not only do we have 75.6% upside potential but, using just 73 of the 556 days we have to sell, we sold $4,970 (29.1% of our current value) worth of short calls and the ONE thing we know for absolute certainty in the market is – ALL PREMIUMS EXPIRE WORTHLESS! That is why we call our PhilStockWorld Strategy: “Be the House – NOT the Gambler!”
-
-
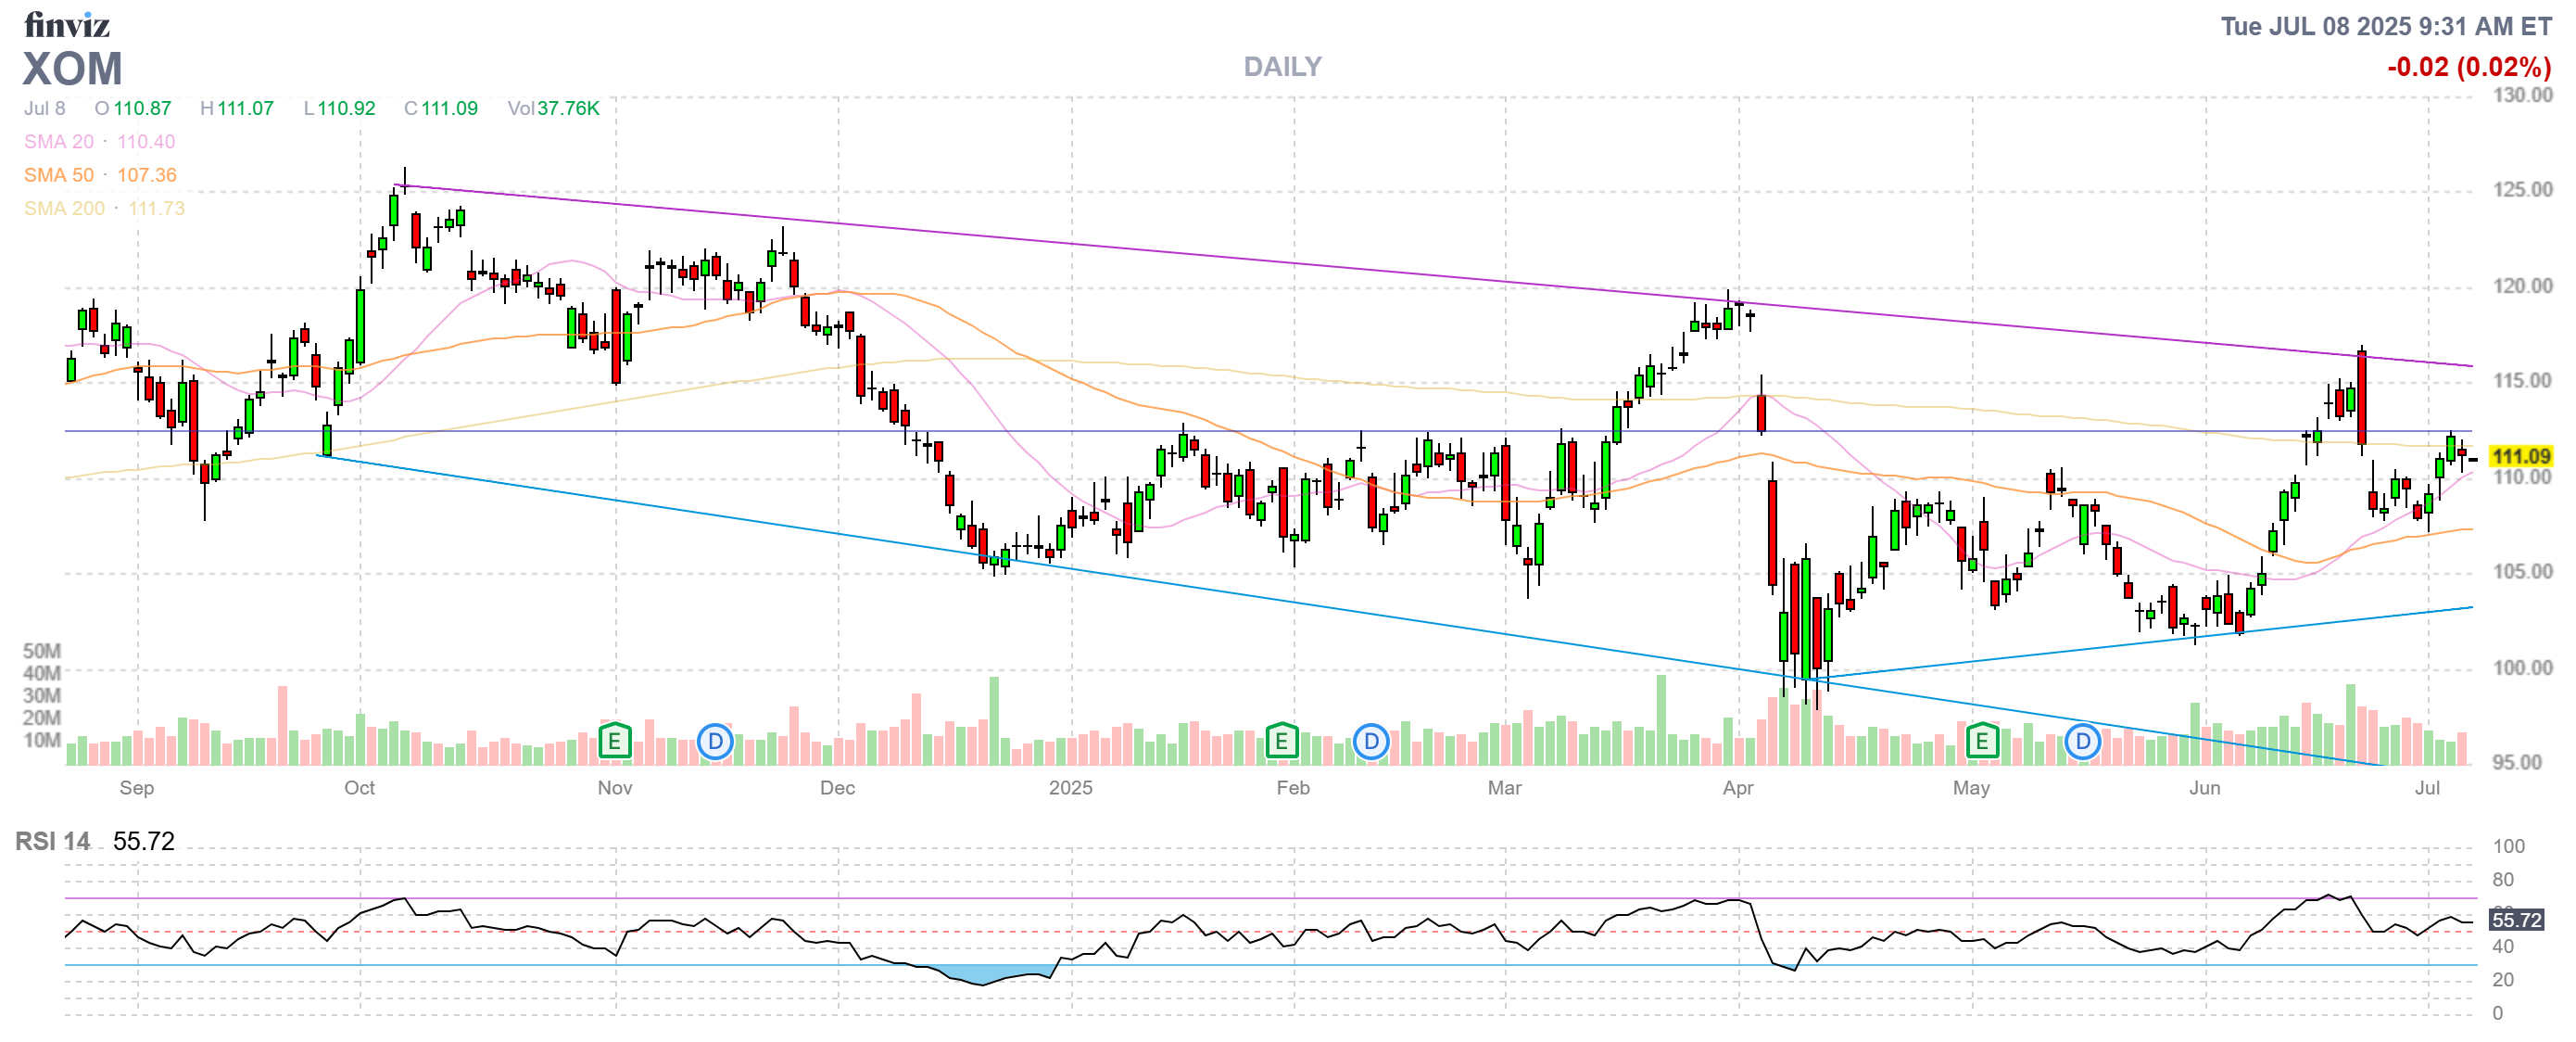
- XOM – I feel dirty just owning this stock and it’s not even up (down $983 (31%) from our $3,170 entry). There’s nothing to change – with Trump’s energy policies – they’ll get there… It’s a $20,000 spreads so there’s $17,813 (814%) upside potential so dirty but fun! Good for a new trade, of course.
-
So our adjustments above are putting $19,620 in our pockets and think about that for a moment. If we have a 210,000 portfolio and we sell $19,000 worth of premium PER QUARTER – we are going to be well on our way to some outstanding returns! That is what our “Be the House – NOT the Gambler!” strategy is all about.
The remaining upside potential of our 14 trades is $255,388 (121%) over the next 18 months, so we are on track to continue our current pace of gains PLUS we will keep selling that premium every quarter for additional income. Clever, right?
Meanwhile, we have plenty of CASH!!! so let’s go ahead and add two new trades to the portfolio:
-
-
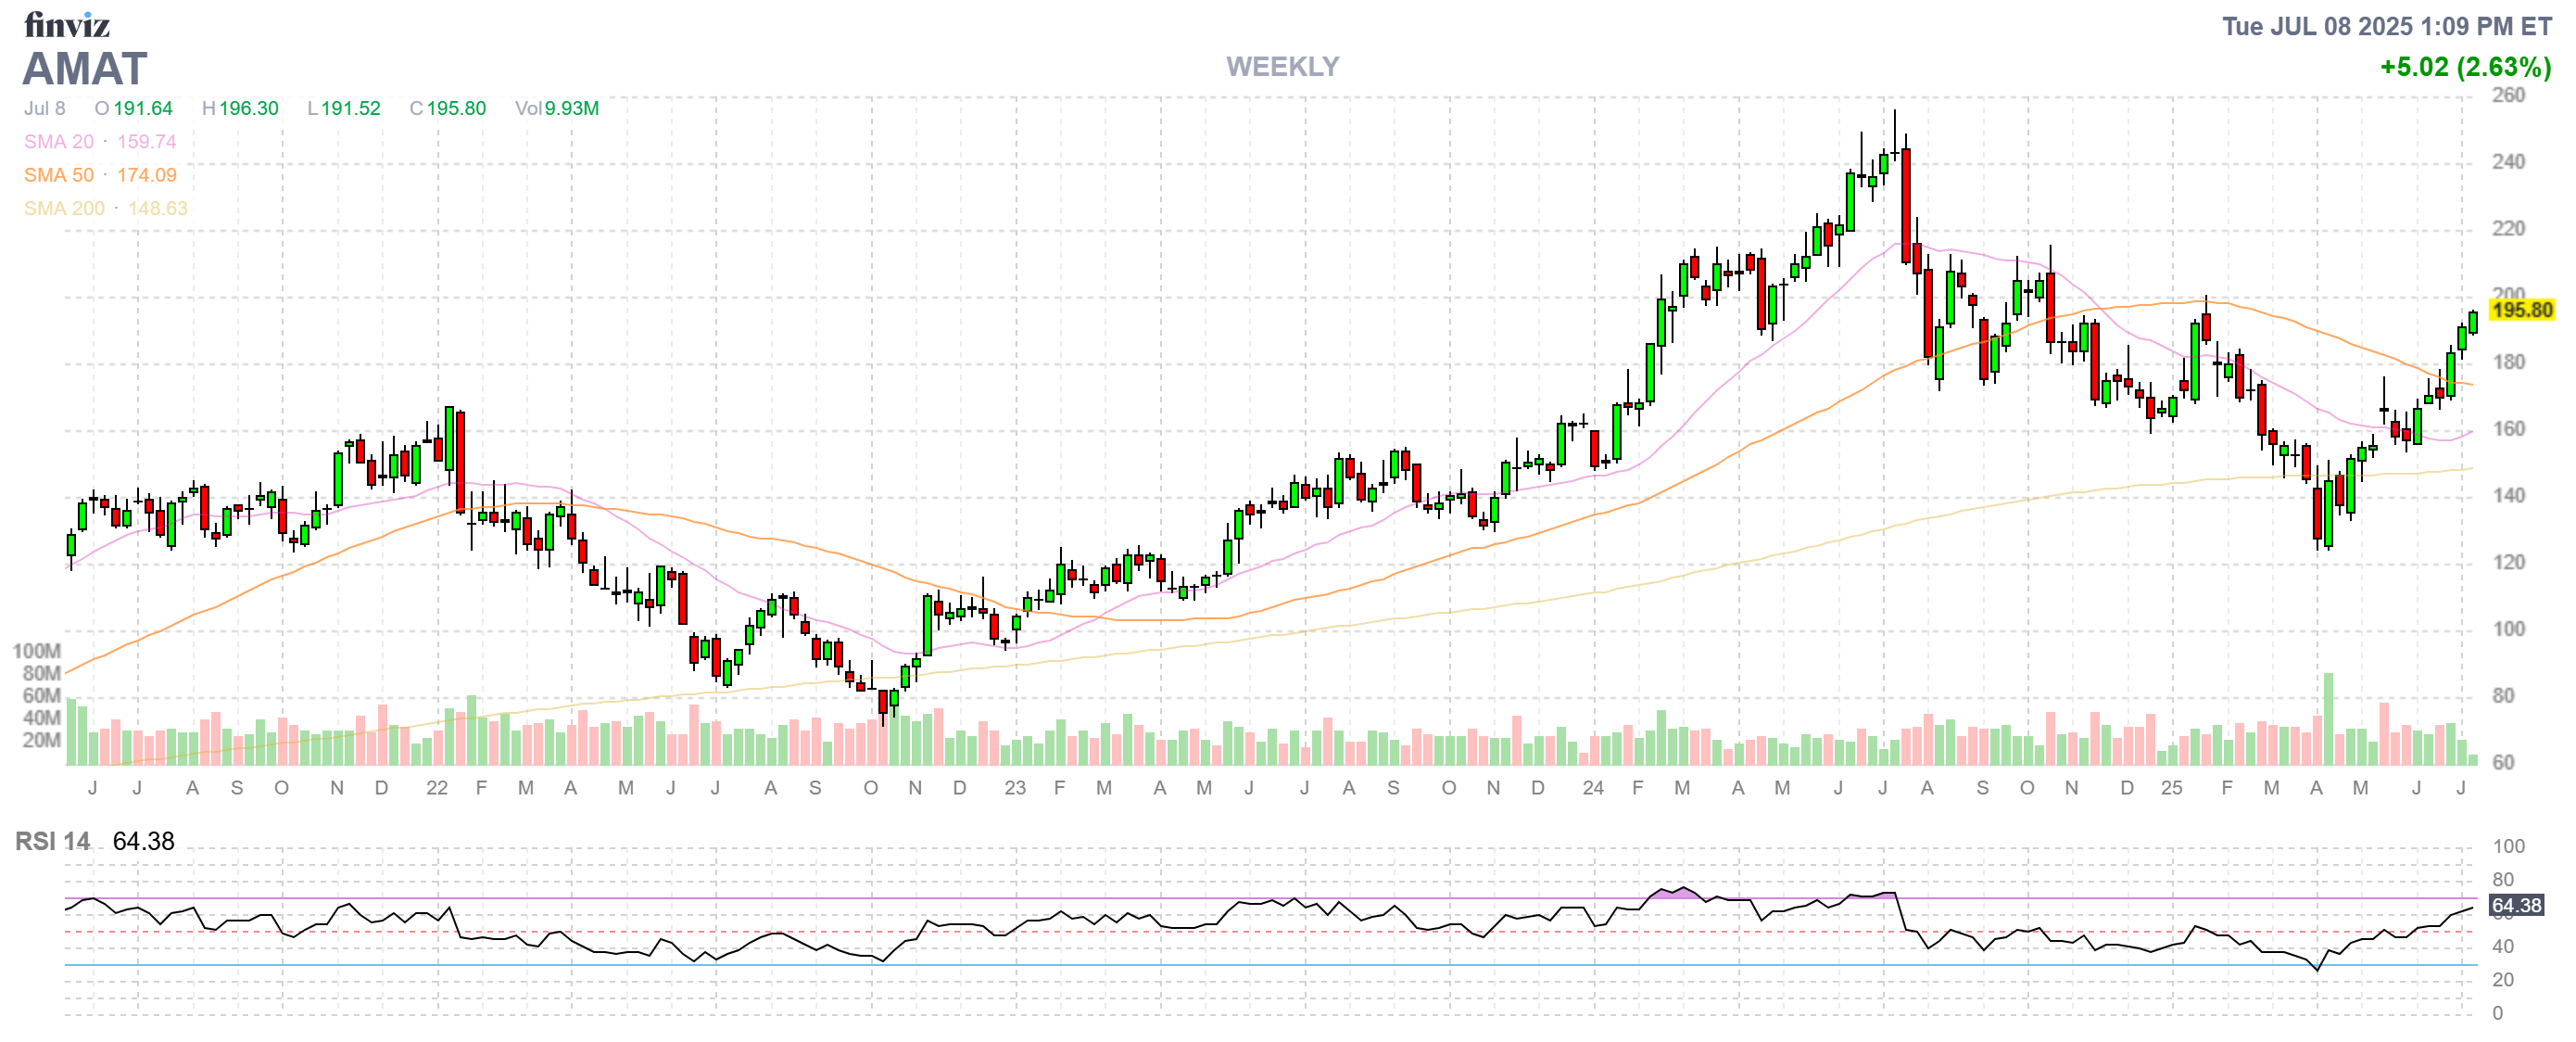
- Sell 2 AMAT Dec 2027 $150 puts for $17.25 ($3,450)
- Buy 3 AMAT Dec 2027 $180 calls for $56.50 ($16,950)
- Sell 3 Oct $200 calls for $12.75 ($3,825)
- Sell 2 Oct $180 puts for $7 ($1,400)
-
That’s net $8,275 and our target is $300+ and that would be $120 on the Dec 2027 calls ($36,000) with an upside potential of $22,725 (335%). The Dec 2027 $280 calls (as high as they go) are $22 – miles more than the short Oct $200 calls so that would be an easy roll if we had to so no worries to the upside and many more sales to go (2.5 years) for income while we wait. The risk is being assigned 200 shares at $150 ($30,000) and 200 shares at $180 ($36,000) so stops would be a good idea if $170 fails and I would expect roughly a $10 loss ($5,000 total) if that should happen.
The upside potential is $27,725 (335%) PLUS additional short-term sales and, if we limit our puts to a $5,000 loss plus the $8,275 cash we start with – then the reward outweighs the risk by 2:1 and, if we do that consistently, we only need to be right 1/3 of the time to break even!
-
-
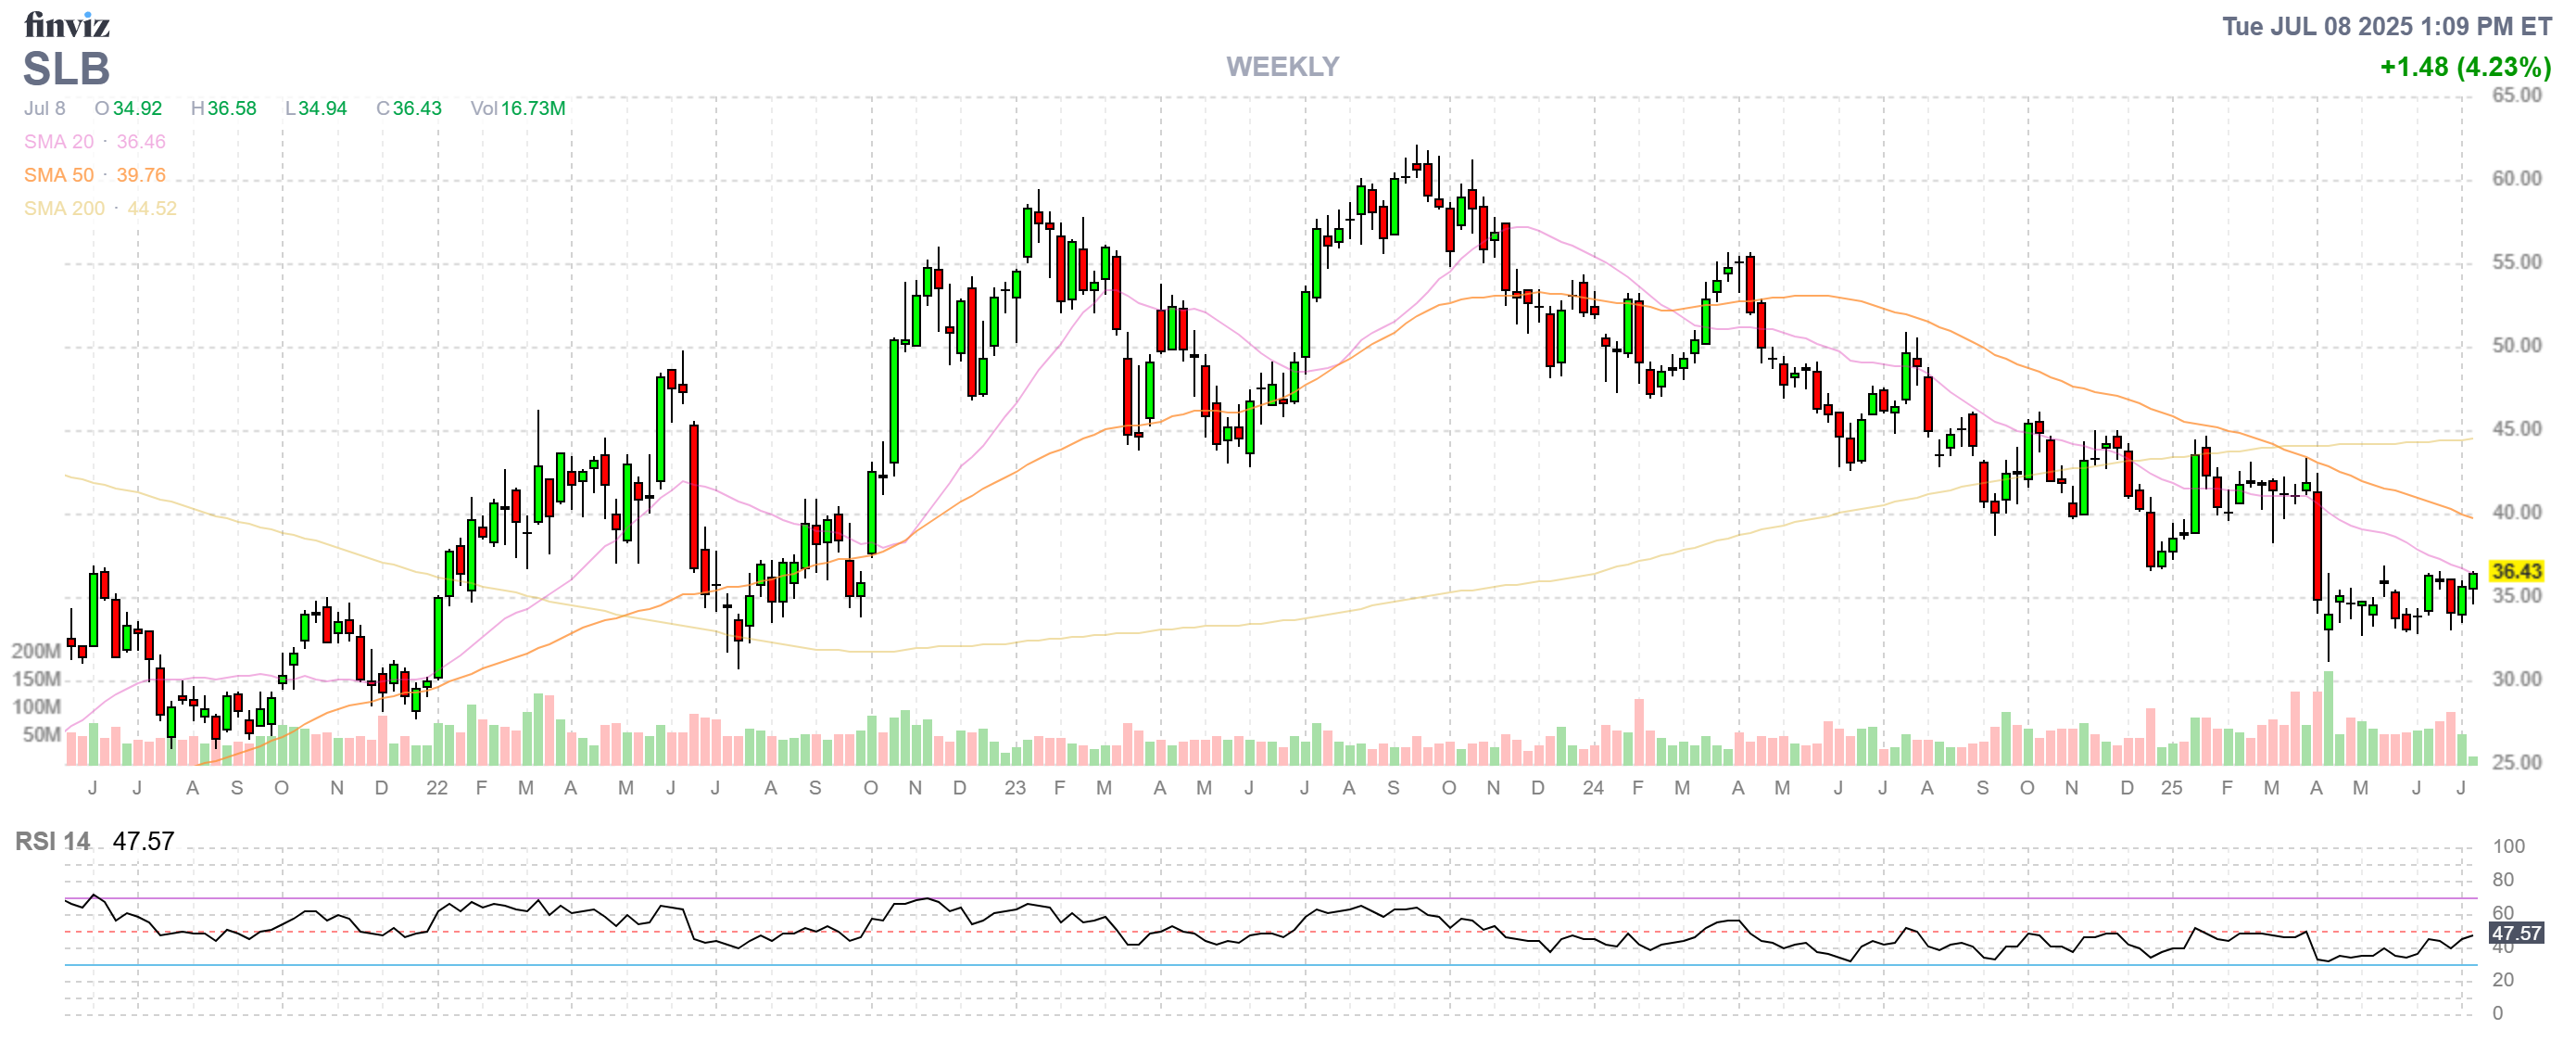
- Sell 5 SLB 2027 $37.50 puts for $5.80 ($2,900)
- Buy 20 SLB 2027 $30 calls for $9.80 ($19,600)
- Sell 20 SLB 2027 $50 calls for $2 ($4,000)
- Sell 5 SLB Sept $37.50 calls for $1.70 ($850)
- Sell 5 SLB Sept $37.50 puts for $2.55 ($1,275)
-
That’s net $10,575 on the $40,000 spread with $29,425 (278%) of upside potential at $50. The short calls are well-covered so the real risk is being assigned 1,000 shares of SLB at $37.50 ($37,500) and let’s say it falls to $20 ($20,000) and, if the spread is a total loss, you would be down ($15,325 + $4,675 =) $20,000.
Meanwhile, we collected $2,125 using 72 if the 555 days we have to sell – so there is great income potential while we wait.
So we spent $18,850 – LESS than the cash we collected above and we added two new positions with $52,150 (276%) of upside potential AND another $7,350 (38.9%) of potential quarterly income as well!
See how that works?


