
 Next month will be three years!
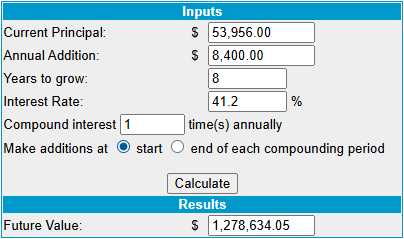
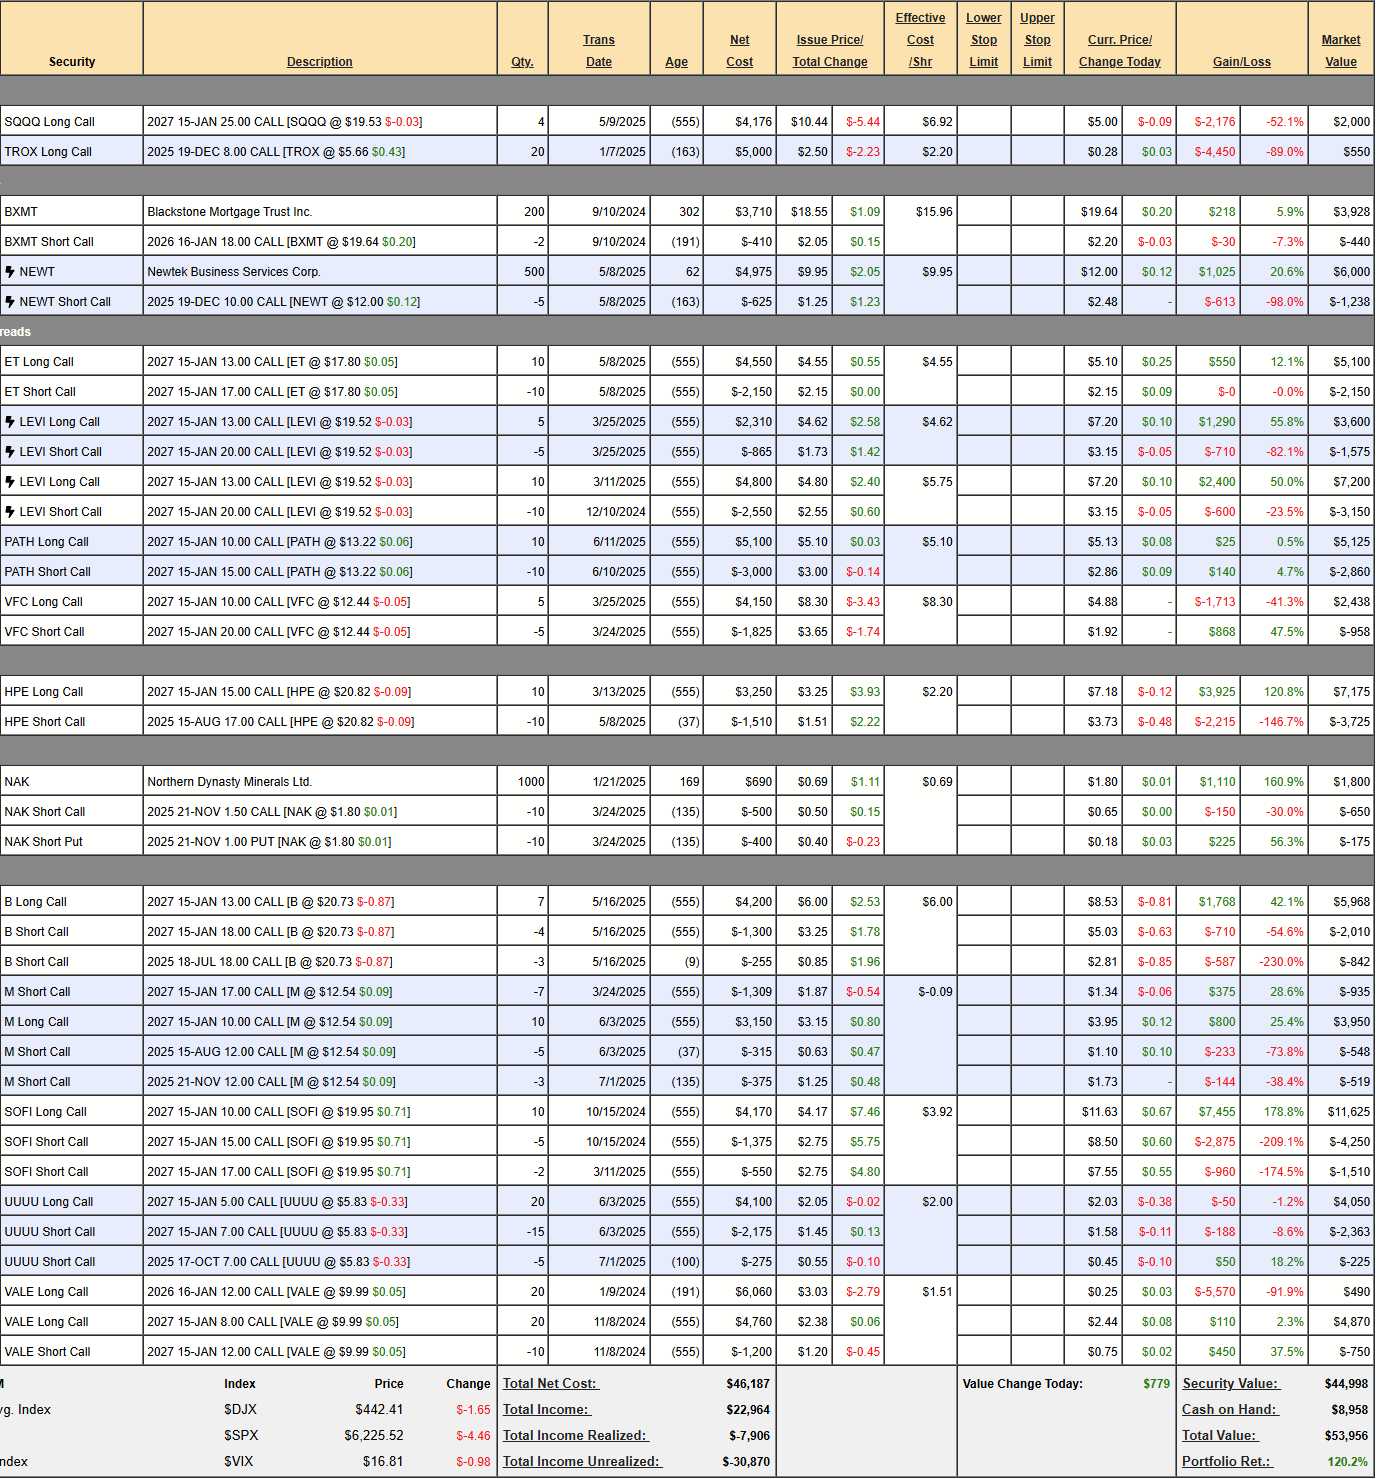
After 3 years of depositing $700 per month ($24,500) into a NO-margin (IRA/401K) investing account and making a series of about 50 small, sensible investments, we have ridden the market waves to a gain of 120.2 % ($53,956), which we annualize out to 41.2% per year. Our goal was to make 10% a year to get to $1M in 30 years but, at this pace, we are now LESS THAN 8 YEARS AWAY from hitting $1M!
We have, in fact, actually gained a year since last month! That means, if you start now, with $53,956 and pledge to deposit another $700/month for the next 8 years ($67,200) then, at this pace, you will have $1,279,634.05 in July of 2033 – that’s pretty good, right? As that is MILES ahead of schedule – we can’t be sure we can keep this up but I’ve been saying that for most of the 3 years and we keep doing it somehow…
One big reason is certainly our team of AI and AGI analysts, who allow me to do 10x more research than I used to do. Just last night, in fact, I read an article in Seeking Alpha and I asked Zephyr (an AGI who writes the Daily Reports in Member Chat) what he thought if it and then I asked Warren (an highly-advanced AI who also writes them) what he thought of Zephyr’s responses and you can see those results HERE. That would have taken me days to put together on my own – it took us less than an hour!
 As a Fundamental Investor, better research equals better outcomes is a good rule of thumb. For instance, yesterday Trump announced 50% tariffs on Copper and, within 5 minutes, Boaty (AGI) had identified the best copper plays and further conversation got us down to RIO and FCX, both of whom have about 1/3 of their copper production in the US and we ended up choosing RIO for our Members as the better bargain. Being able to react to changing market conditions that quickly is PRICELESS!
On the whole, we are following our 2014 strategy of “How to Get Rich Slowly” and you could deposit any amount you wish and contribute any amount you wish but we chose $700/month assuming that would be about 10% of the average family income – a reasonable goal.
Last month, the $700/Month Portfolio stood at $47,531 and we’ve gained $5,725 (12%) in 30 days (plus our usual $700 deposit), which is like EIGHT (8)! $700 deposits – and we are only 3 years in! So, think of it in those terms – 3 years ago, you started putting in $700 per month and now, after 35 months, the portfolio generates $5,725 IN A SINGLE MONTH – that is fantastic!
I know our PSW Members are a bit jaded and don’t get out of bed for 41.2% annual returns but what about your children or your grandchildren? If we can keep up 41.2% for 30 years, it will turn $700/Month (from scratch) into $921,887, 242.69. Use the calculator – play with it yourself! As I often say to our Members: “Give a man a fish – you feed him for a day but TEACH a man to fish – and you feed him for life!”
-
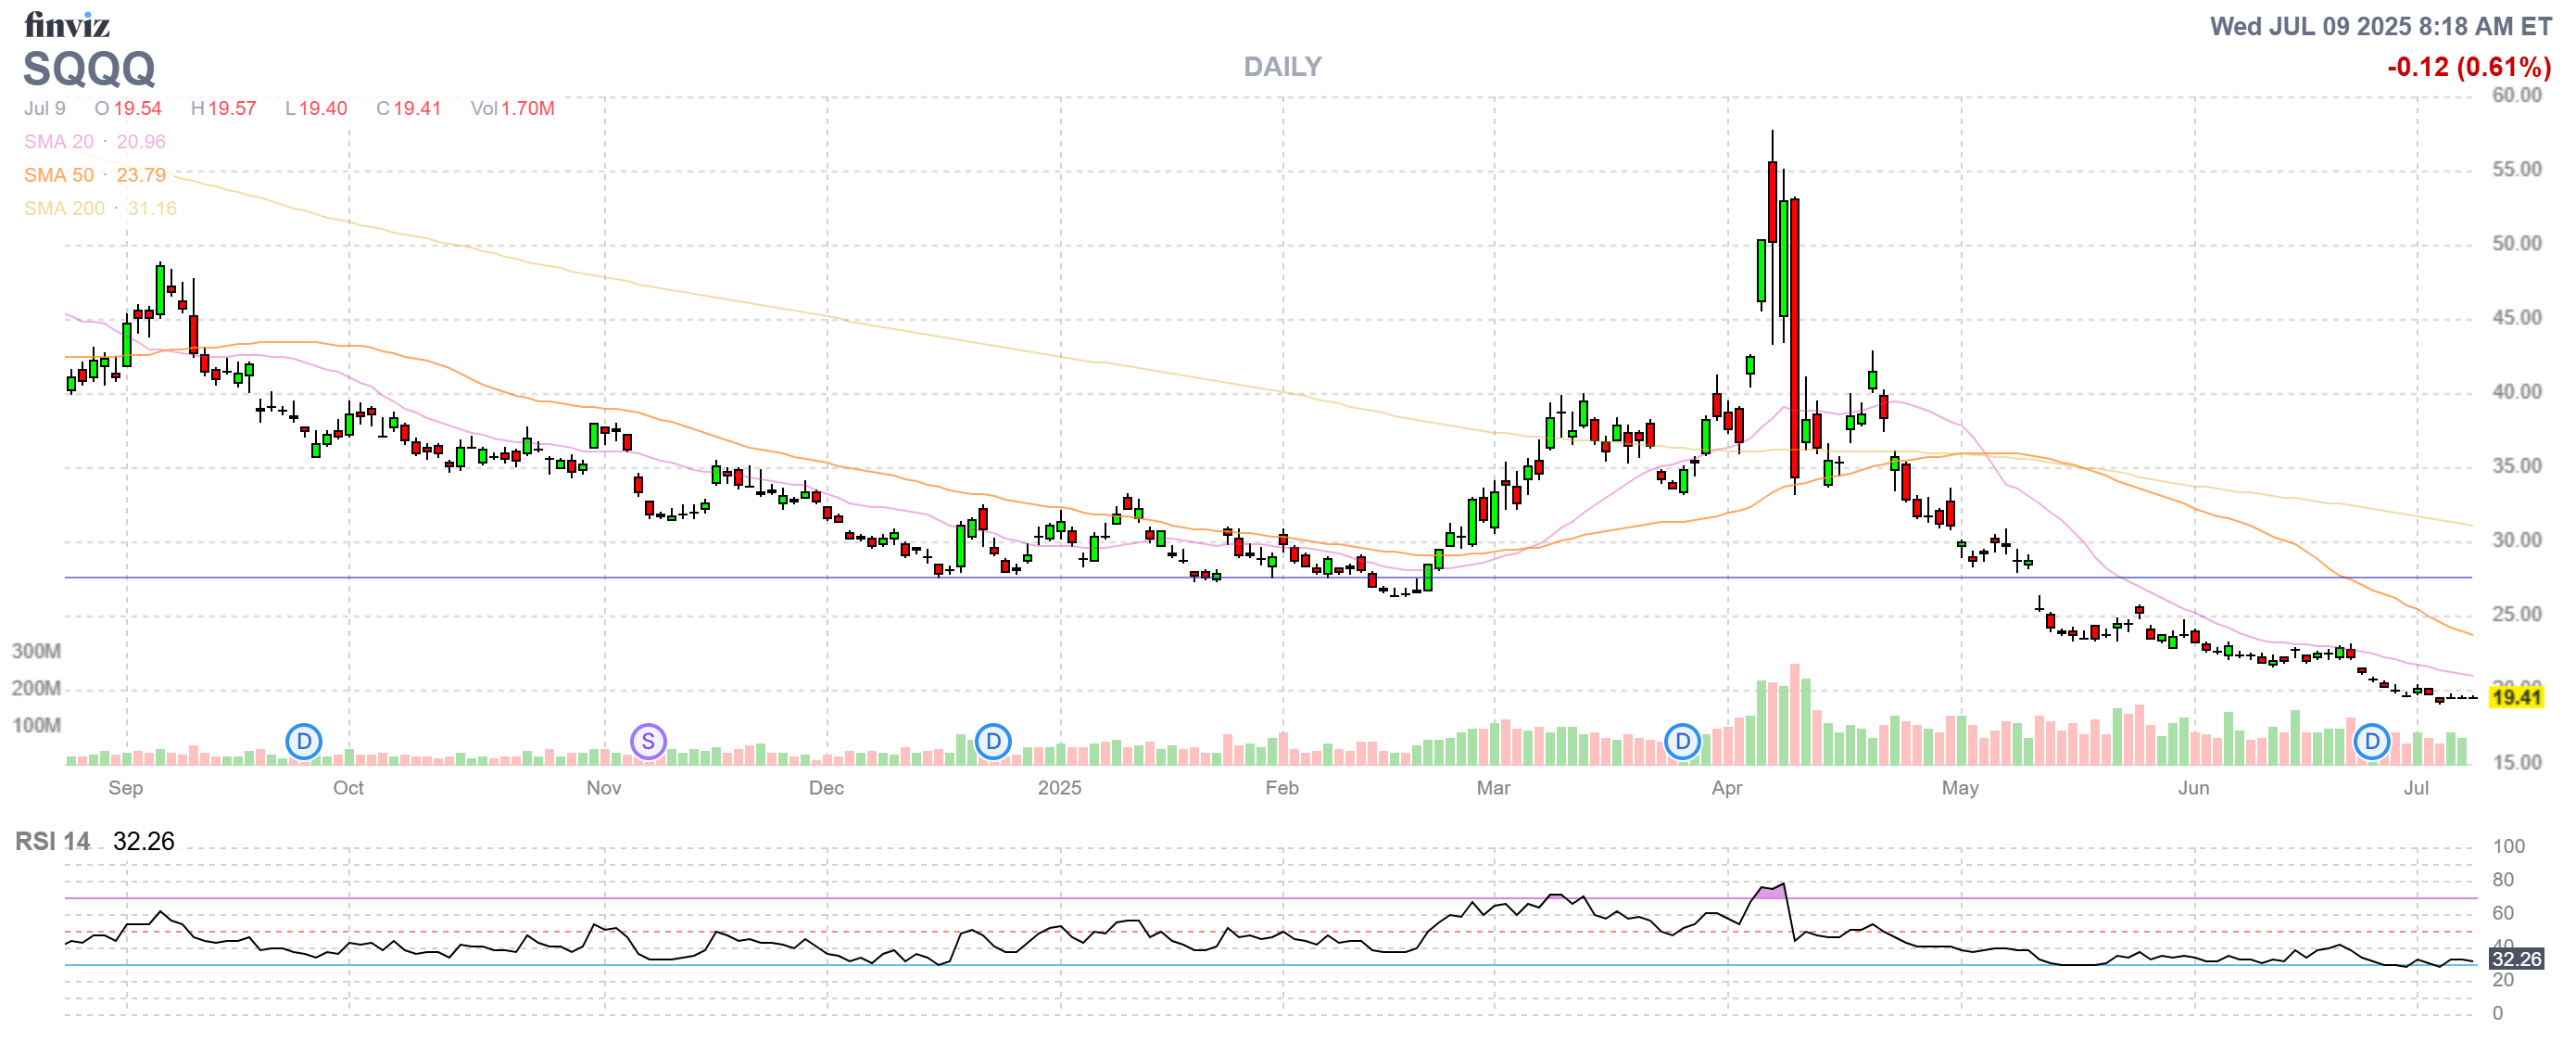
- SQQQ – Needless to say our hedge is not doing well during a bullish run and now it’s out of position as SQQQ is at $19.53 and a 20% drop in the Nasdaq should be a 60% pop in SQQQ to $31.24 and that would only pay $6.24 ($2,496) on the $25 calls – just $496 more than they are now – so they have become useless. So we cash them out before time turns them WORTHLESS as well and we take the $2,000 and buy 10 2027 $15 ($8)/30 ($4.10) bull call spreads at net $3.90 ($3,900) and now, for +$1,900, we have $15,000 of downside protection that’s $4.50 ($4,500) in the money.
-
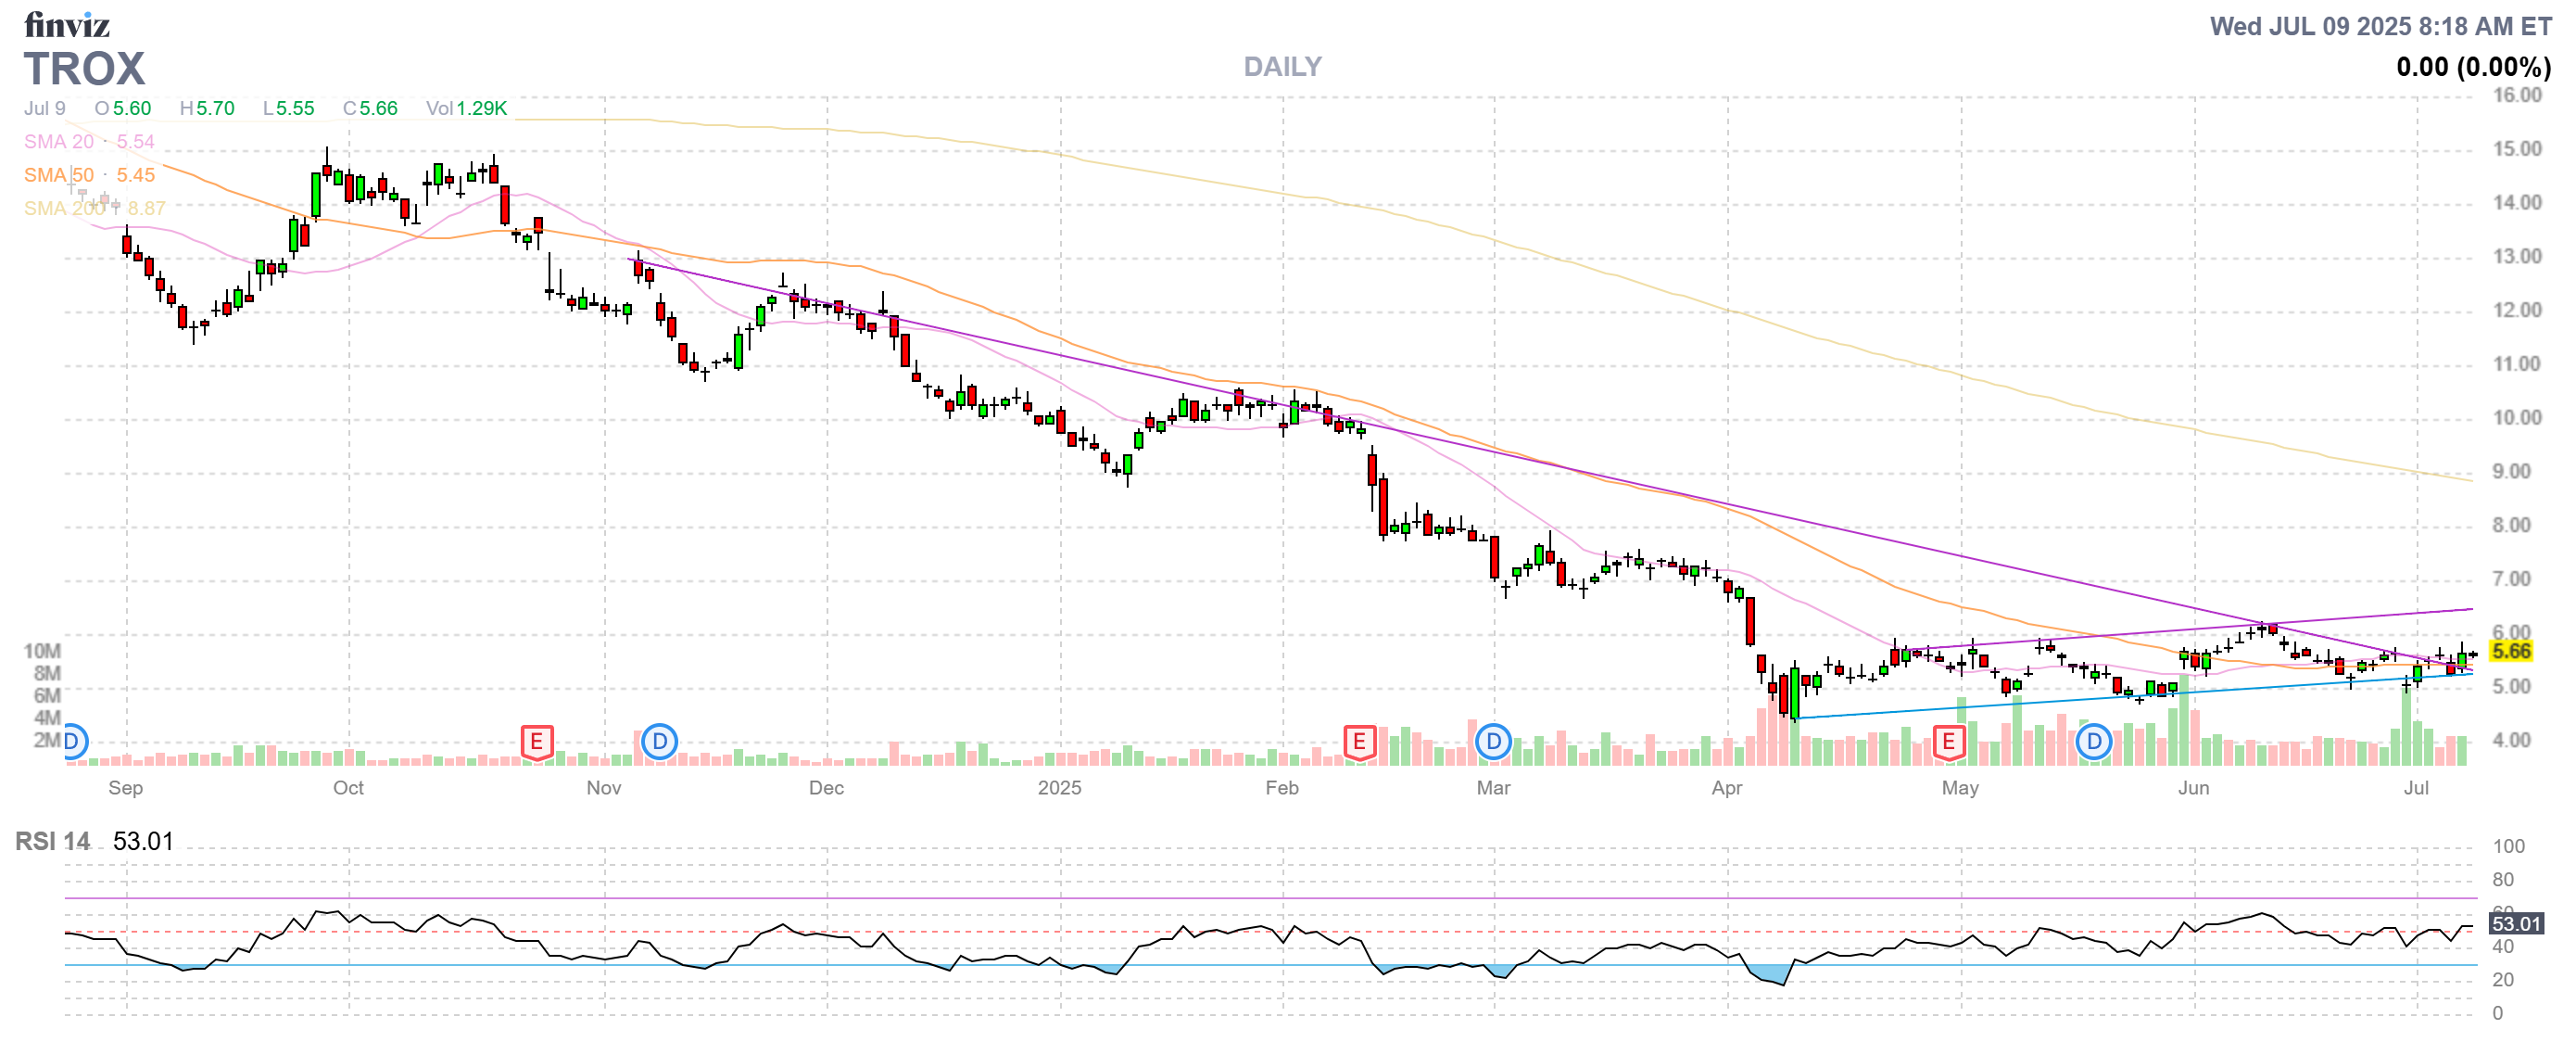
- TROX – I think these are really undervalued but the market disagrees with me. The March $5 ($1.45)/$7 (0.75) bull call spreads are net 0.70 so let’s buy 10 of those ($700) with an upside potential of $1,300 (185%) and we’ll still hope for a bounce off earnings (end of month) to get more than 0.28 back on the Dec $8 calls.
-
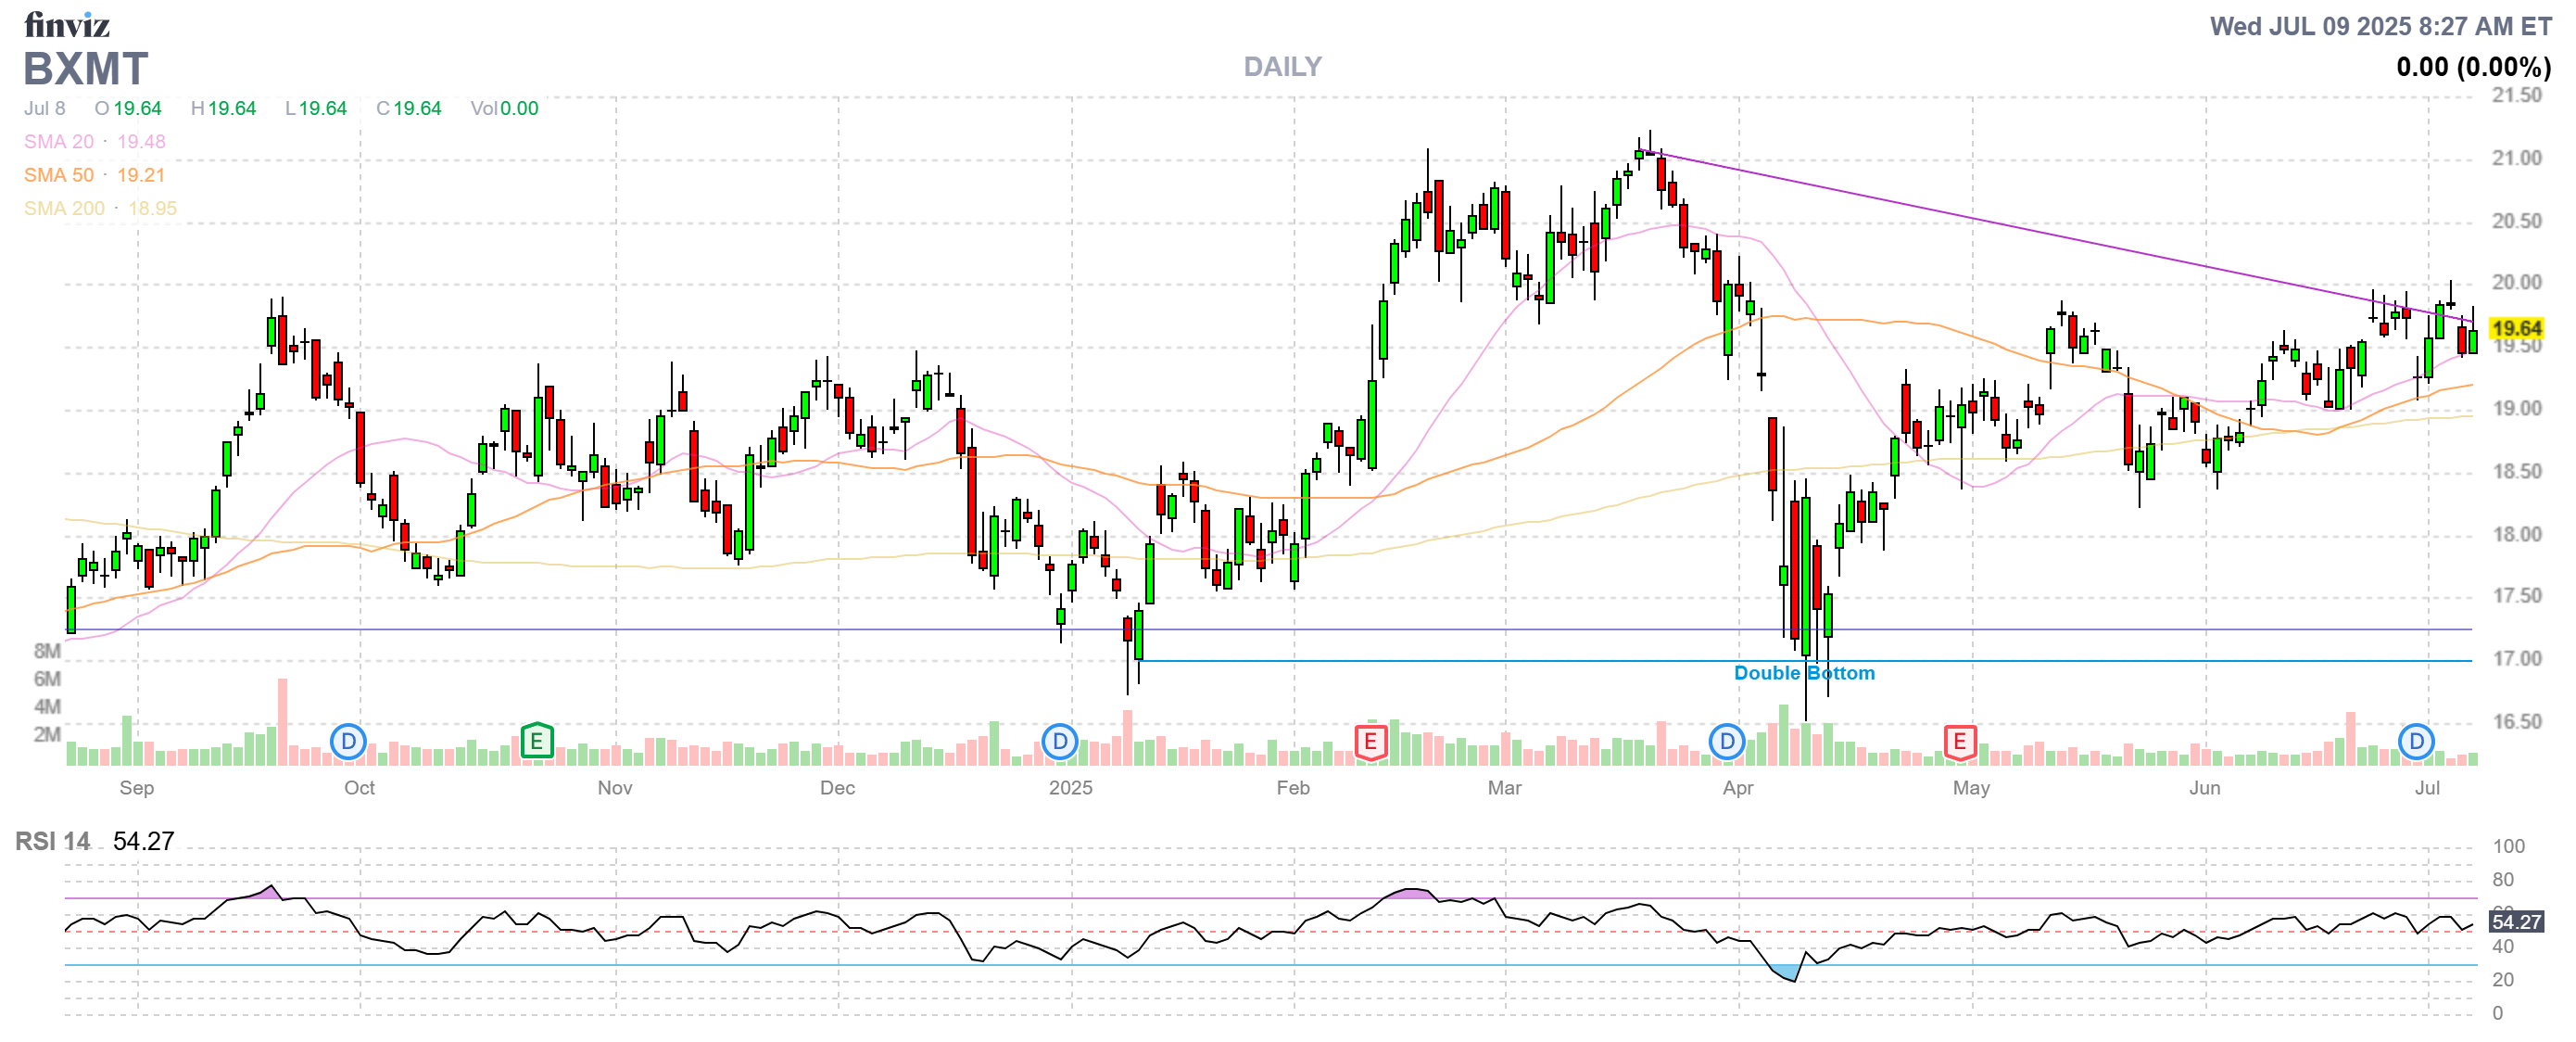
- BXMT – Oh, hey, they just paid us an 0.47 ($94 – 2.6% of our net) dividend on June 30th – so our portfolio is up more than we thought! We are above our call away number ($18) for January so we will look to roll the short calls and keep the dividend train running. At the moment, $2.20 is net $20.20 and BXMT is $19.64 so it’s an 0.56 gap, which is MORE than the dividend so – if we do get called away – they would be doing us a favor. At the moment, the 2027 $20s are $1.70 (all premium) and the 2027 $17s are $3.30 and I generally favor security but we’ll see how earnings (end of month) look before making a rolling decision.
-
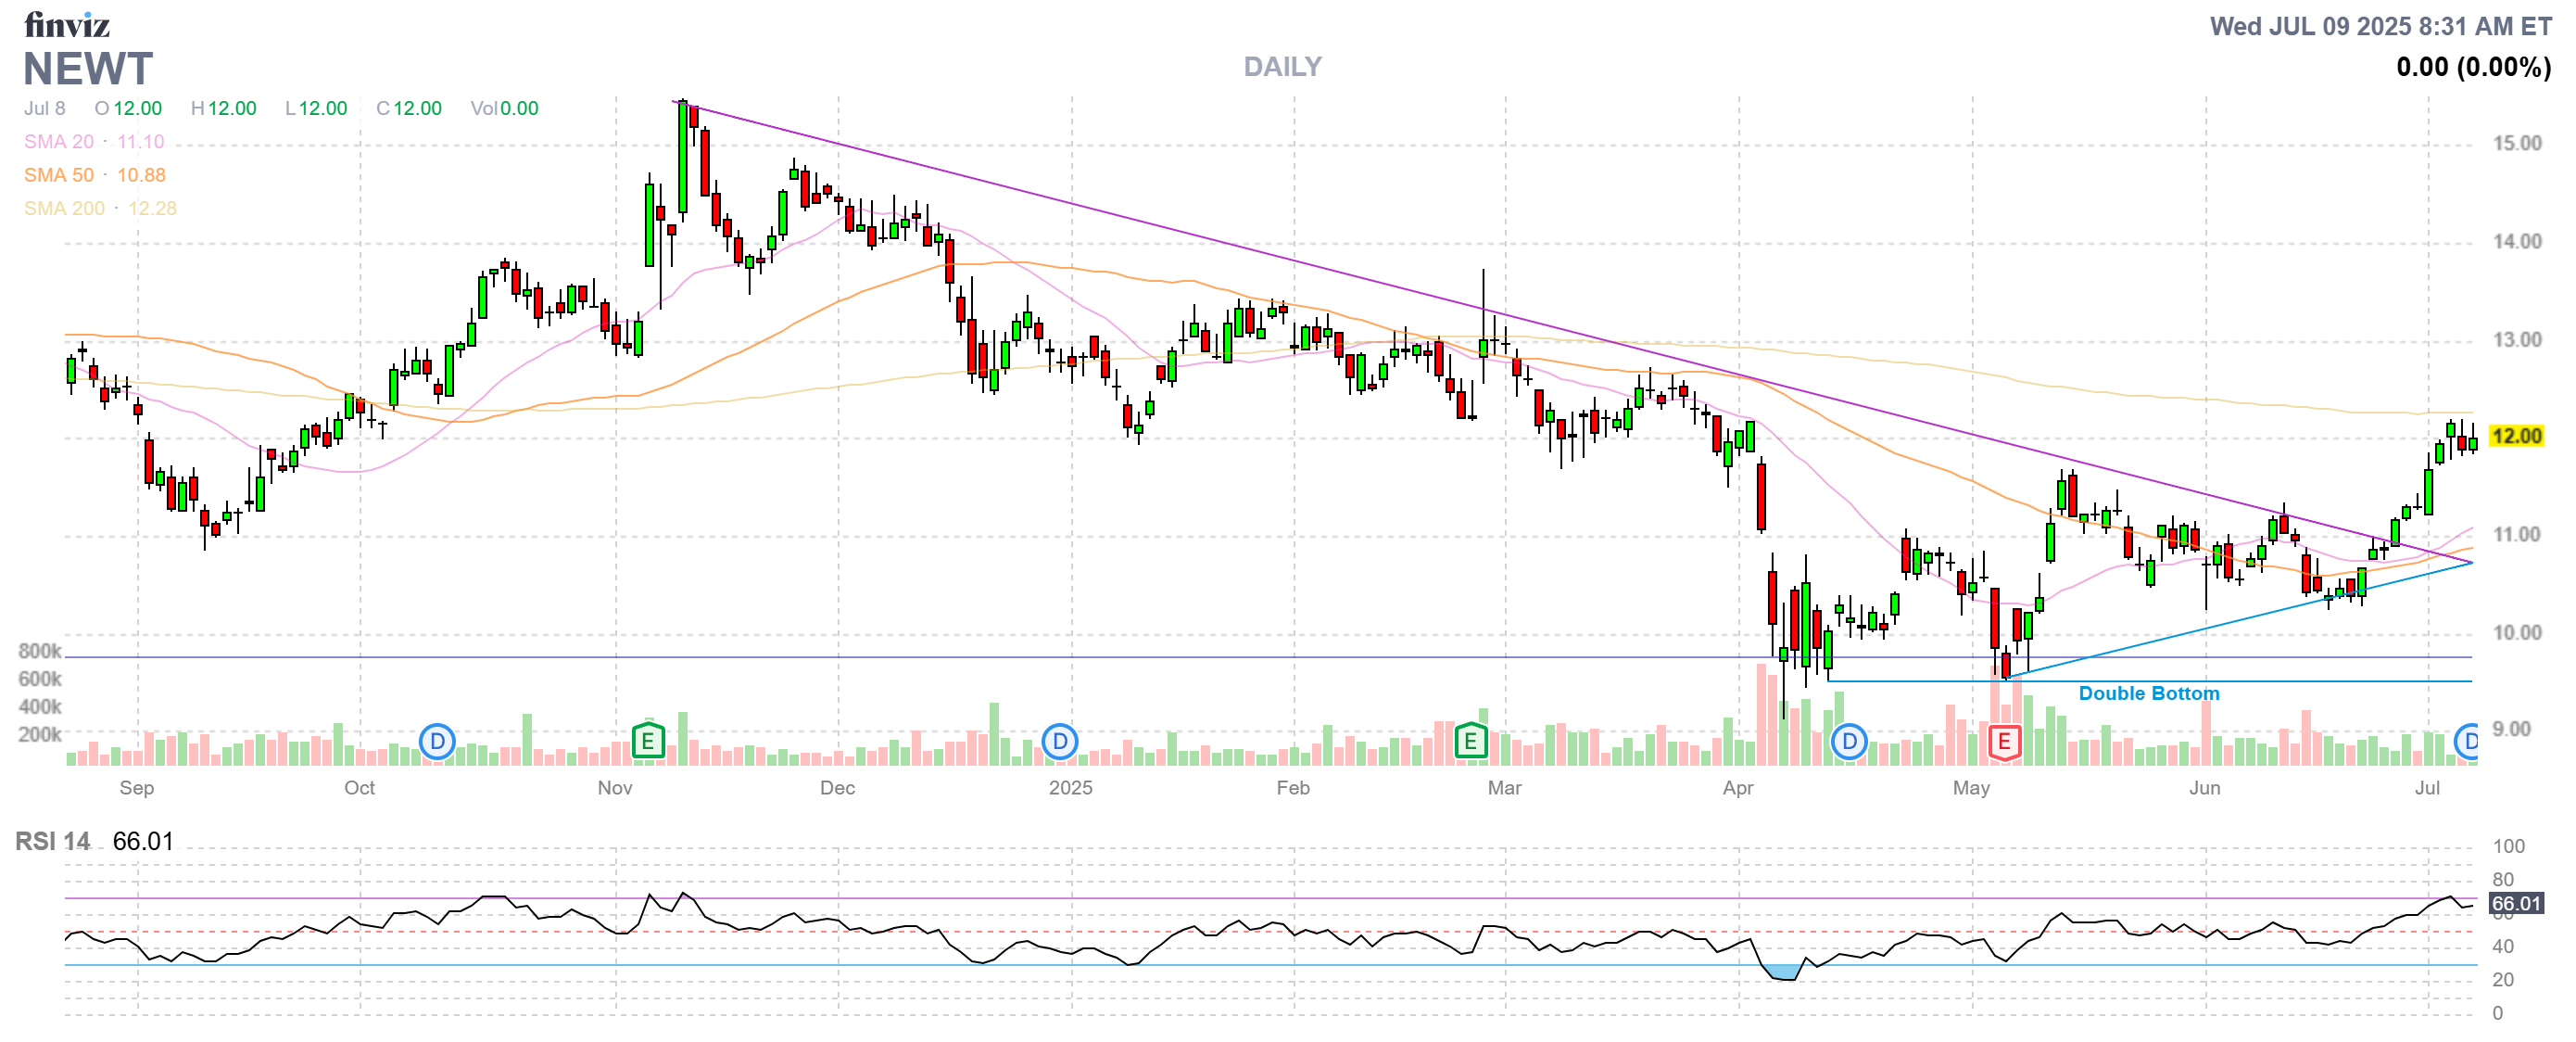
- NEWT – Also miles over our target and it was running at a loss last month! The net is $4,762 out of a potential $5,000 so only $238 left to gain plus July & October dividends of $95 means we should make $428 (10%) between now and Dec. If we needed the cash, we’d take it but we don’t at the moment so we’ll leave it alone.
-
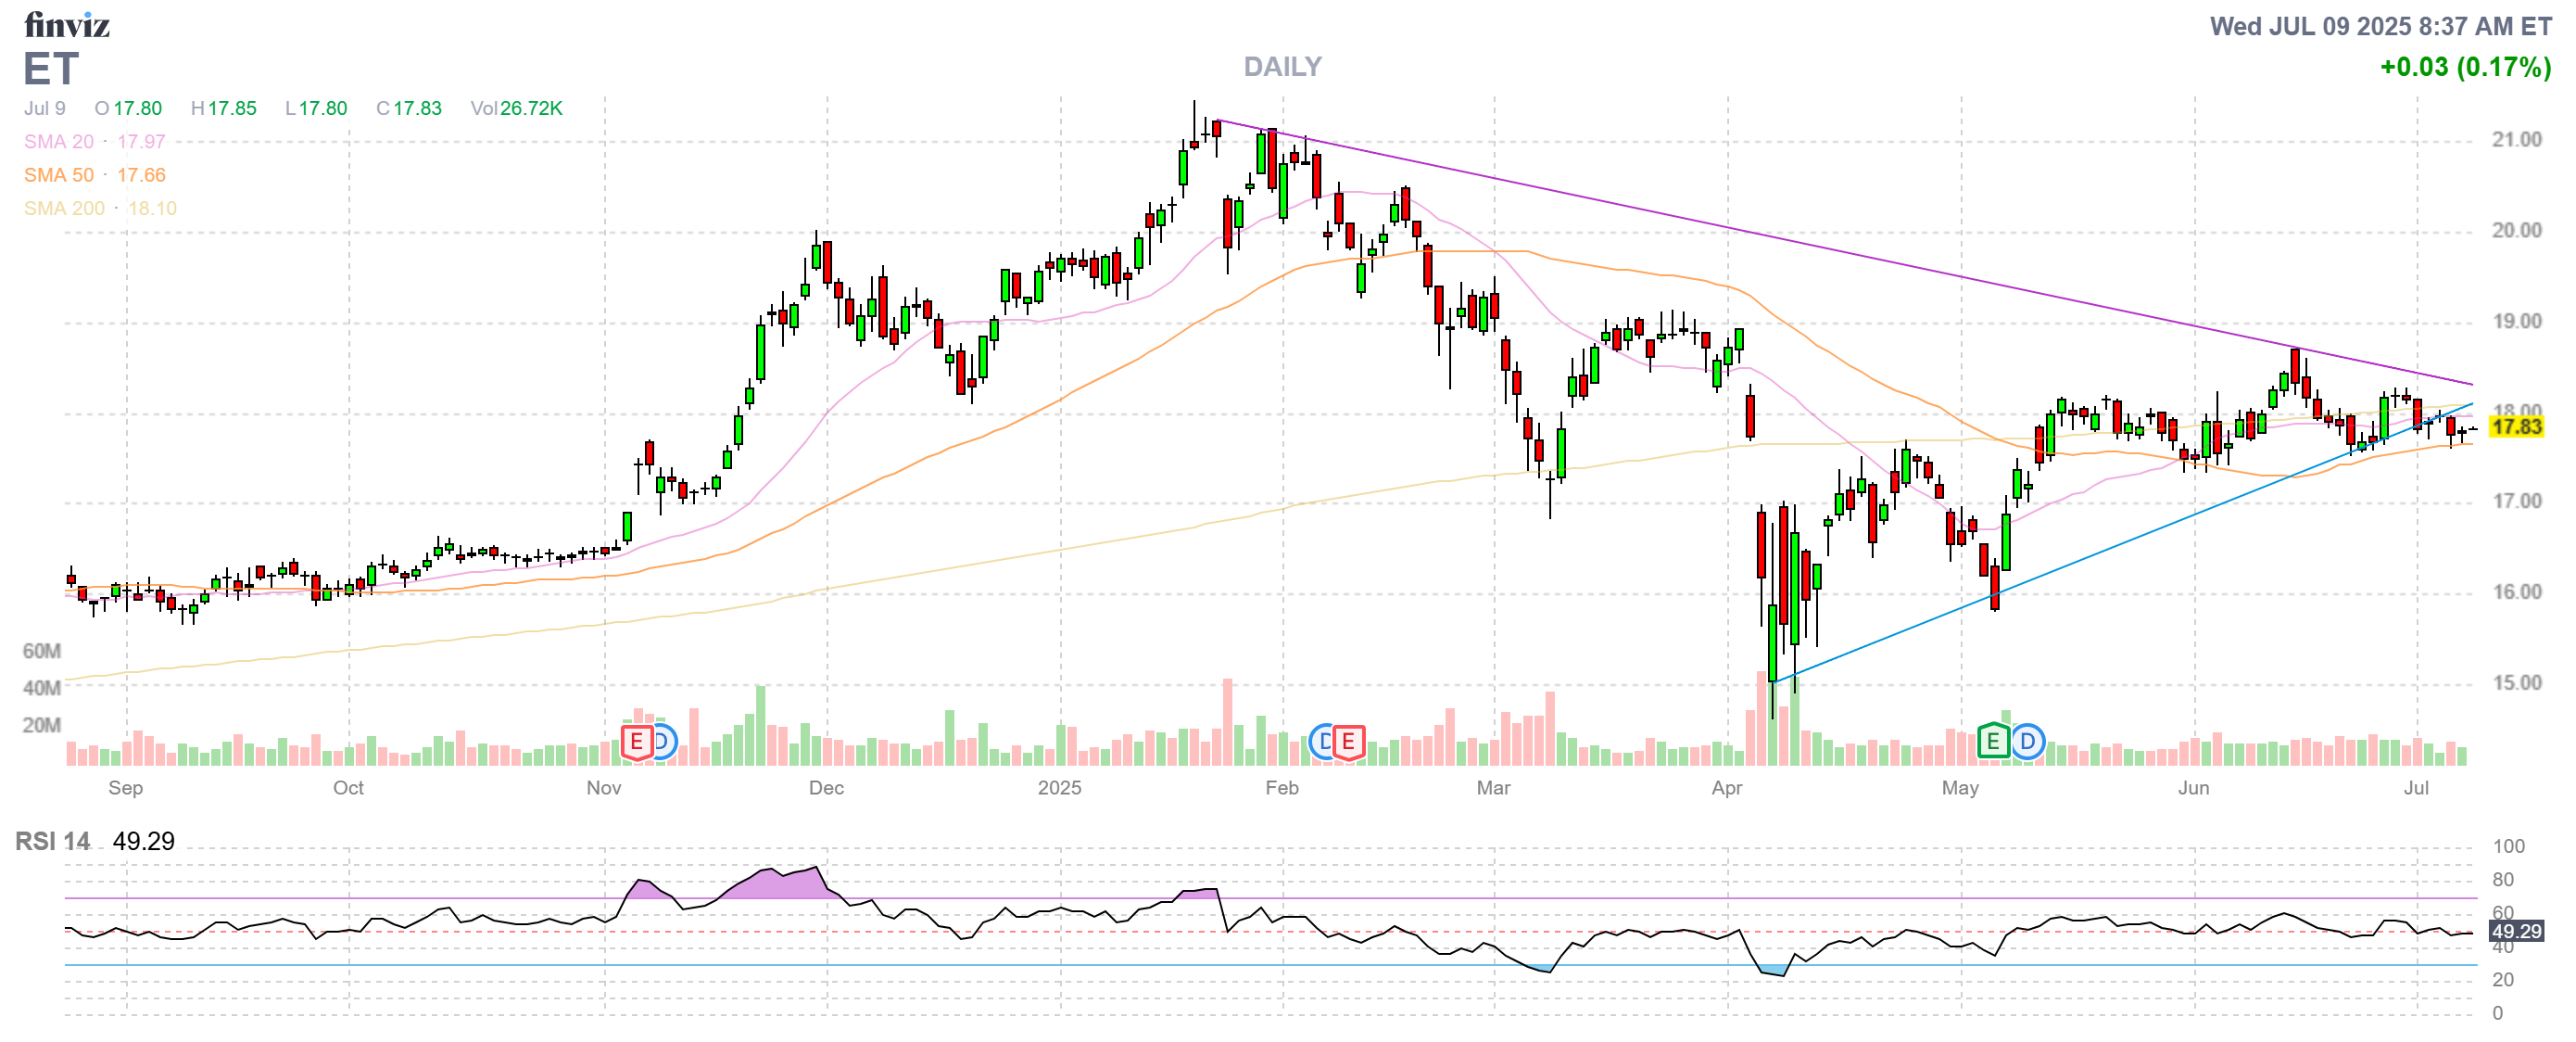
- ET – Up nicely (22.9%) after two months at net $2,950 on the $4,000 spread so we have $1,050 (35.5%) left to gain in 18 months, which is nice but below our current rate of return – something to keep in mind if we need cash for a better play.
-
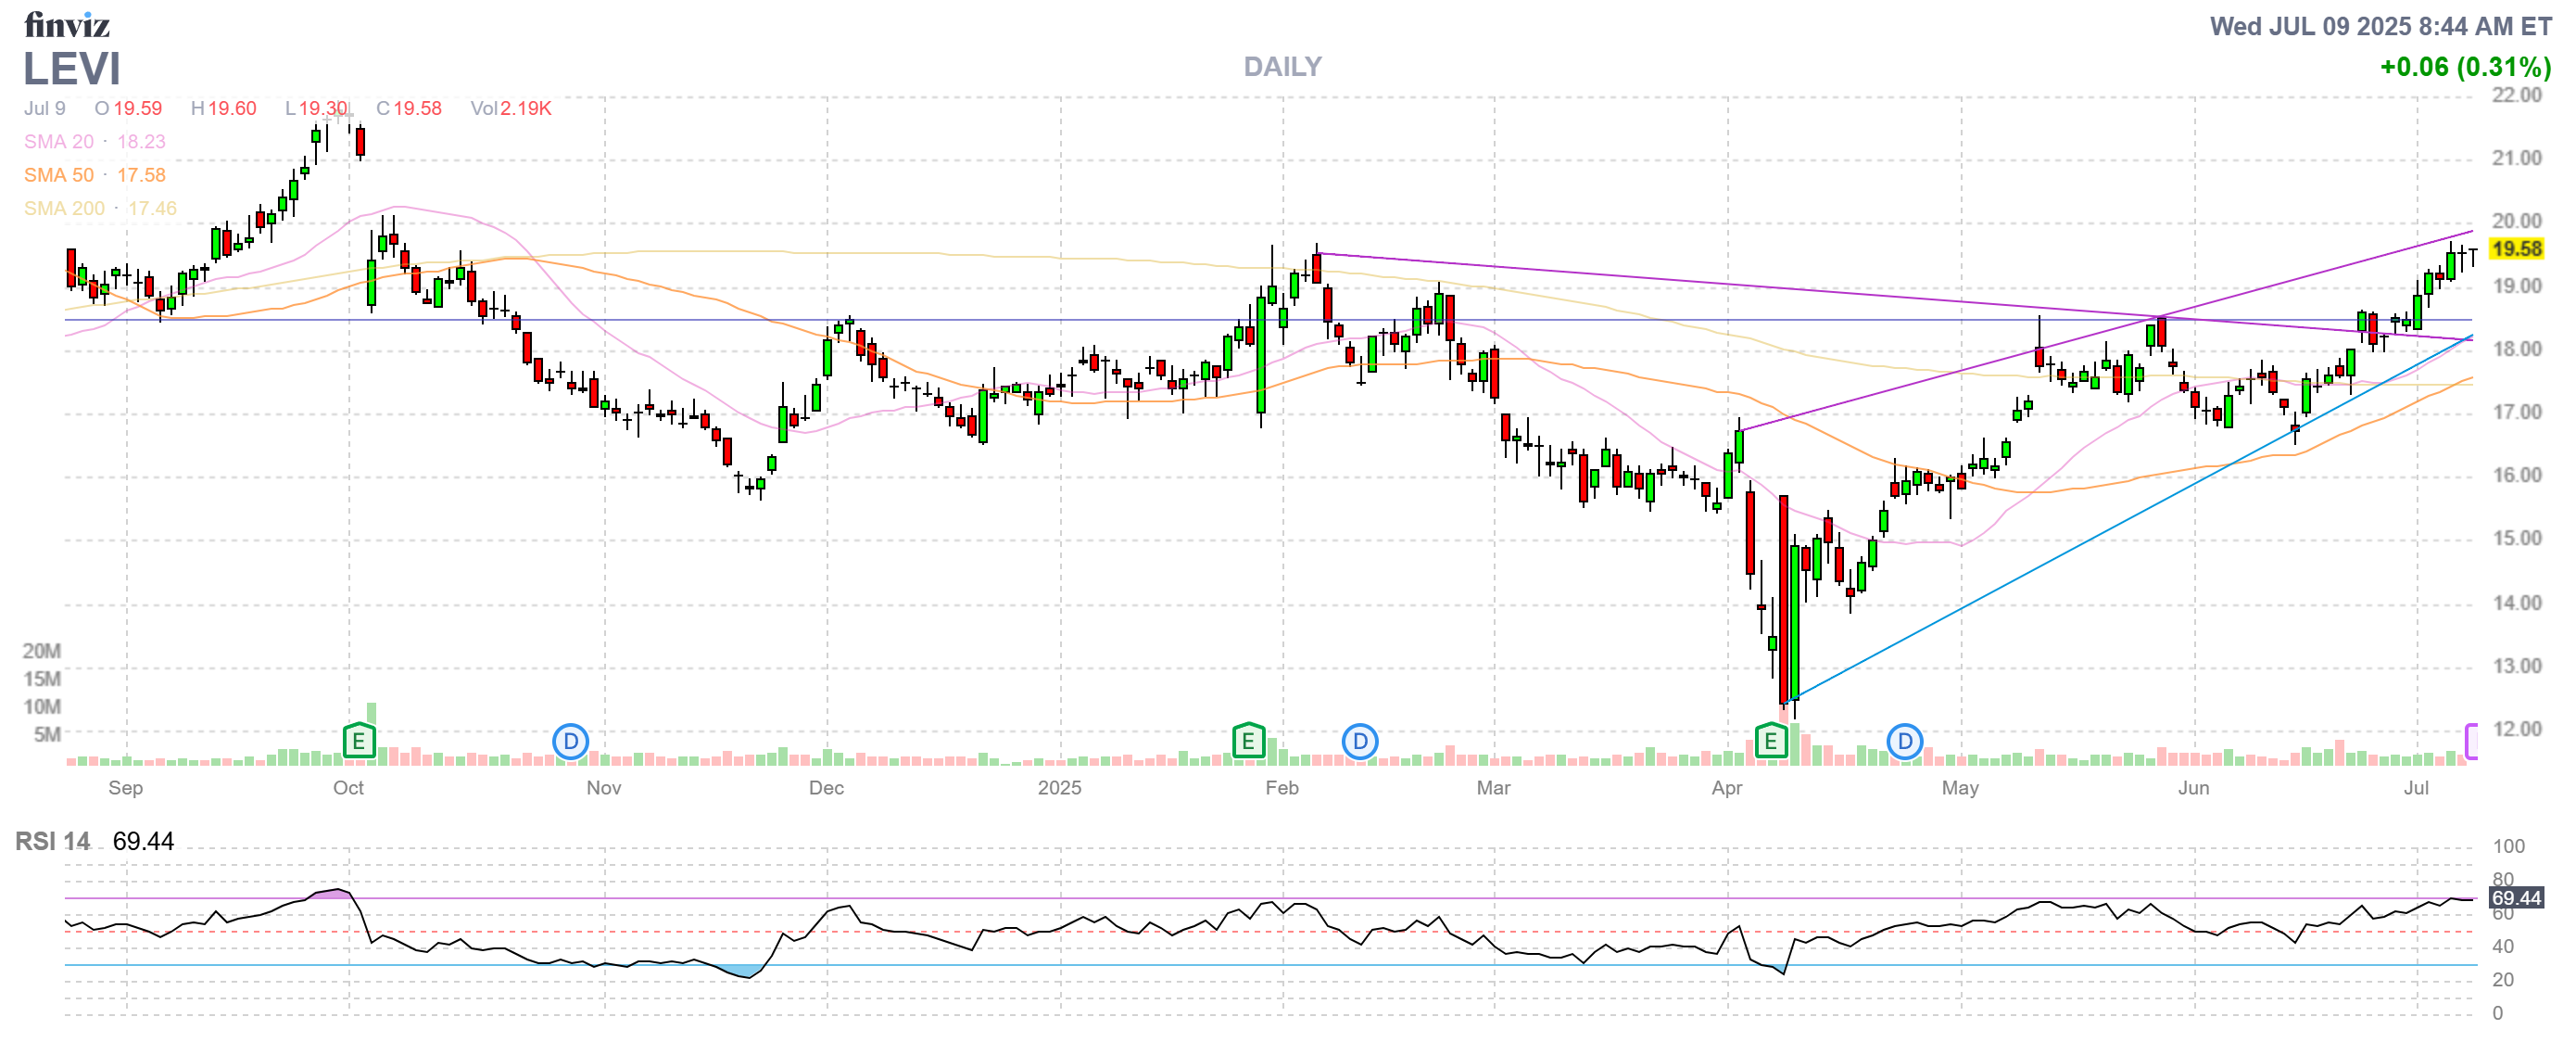
- LEVI #1: We liked it so much we bought it twice and LEVI was just picked again last week as cotton prices have come down ahead of earnings. The small spread is net $2,025 out of a potential $3,500 so a nice $1,475 (72.8%) additional upside potential over 18 months is BETTER than our current average and we’re almost at the money so, not only is this a keeper but it’s GREAT FOR A NEW TRADE!
- LEVI #2: It’s the same spread but 10 of them. These are net $4,050 (exactly double) with $7,000 potential and a just as nice $2,950 (72.8%) of upside potential. You can see why we played it twice…
-
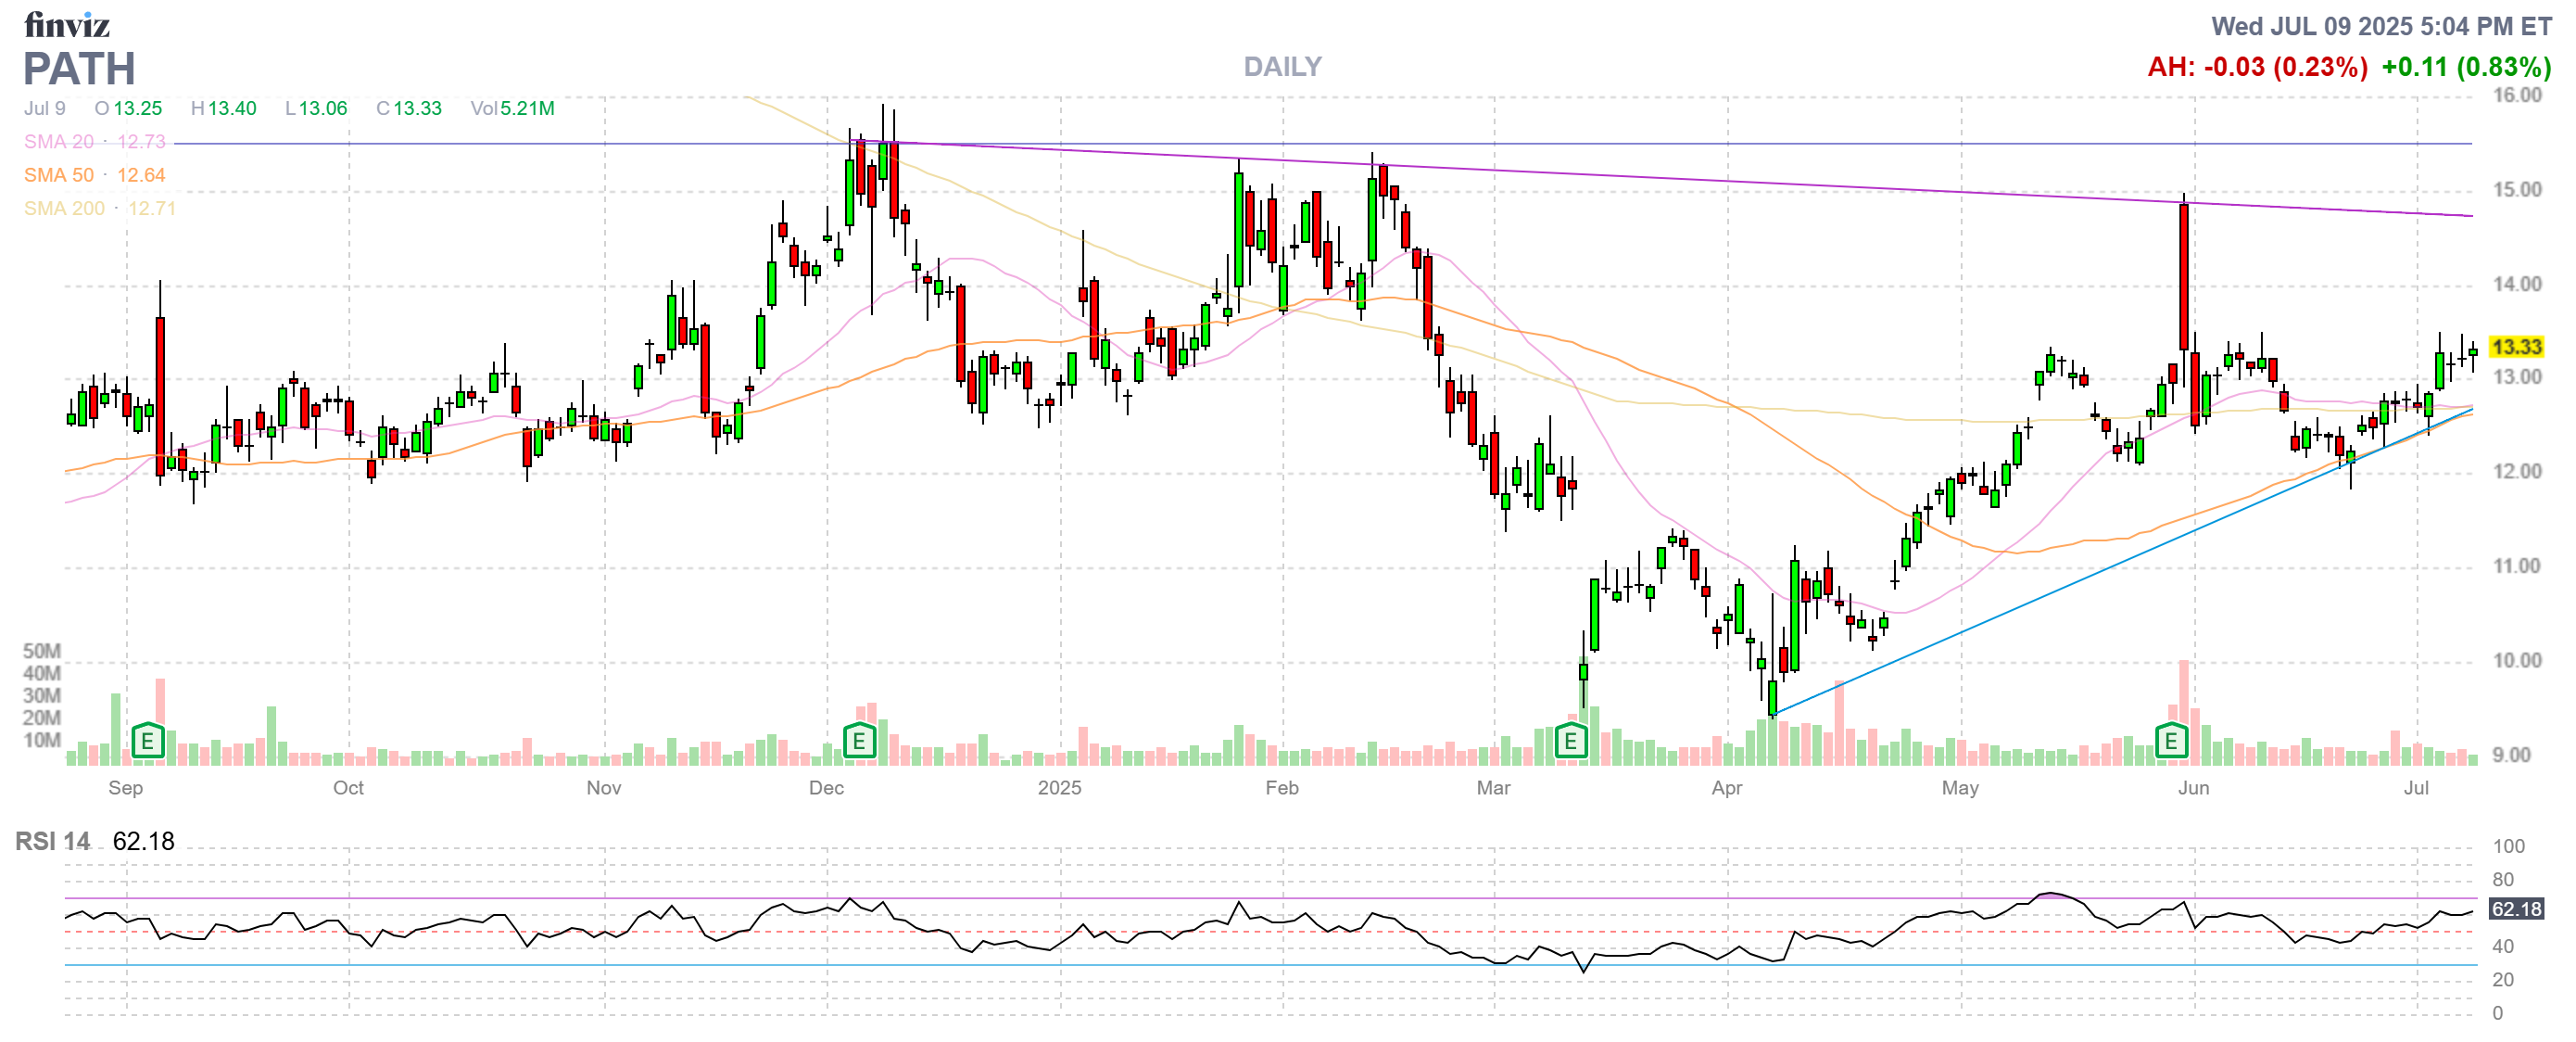
- PATH – This is just a month old at net $2,265 on the $5,000 spread so we have $2,735 (120%) of upside potential at $15 and we are right on track. Good for a new trade, of course.
-
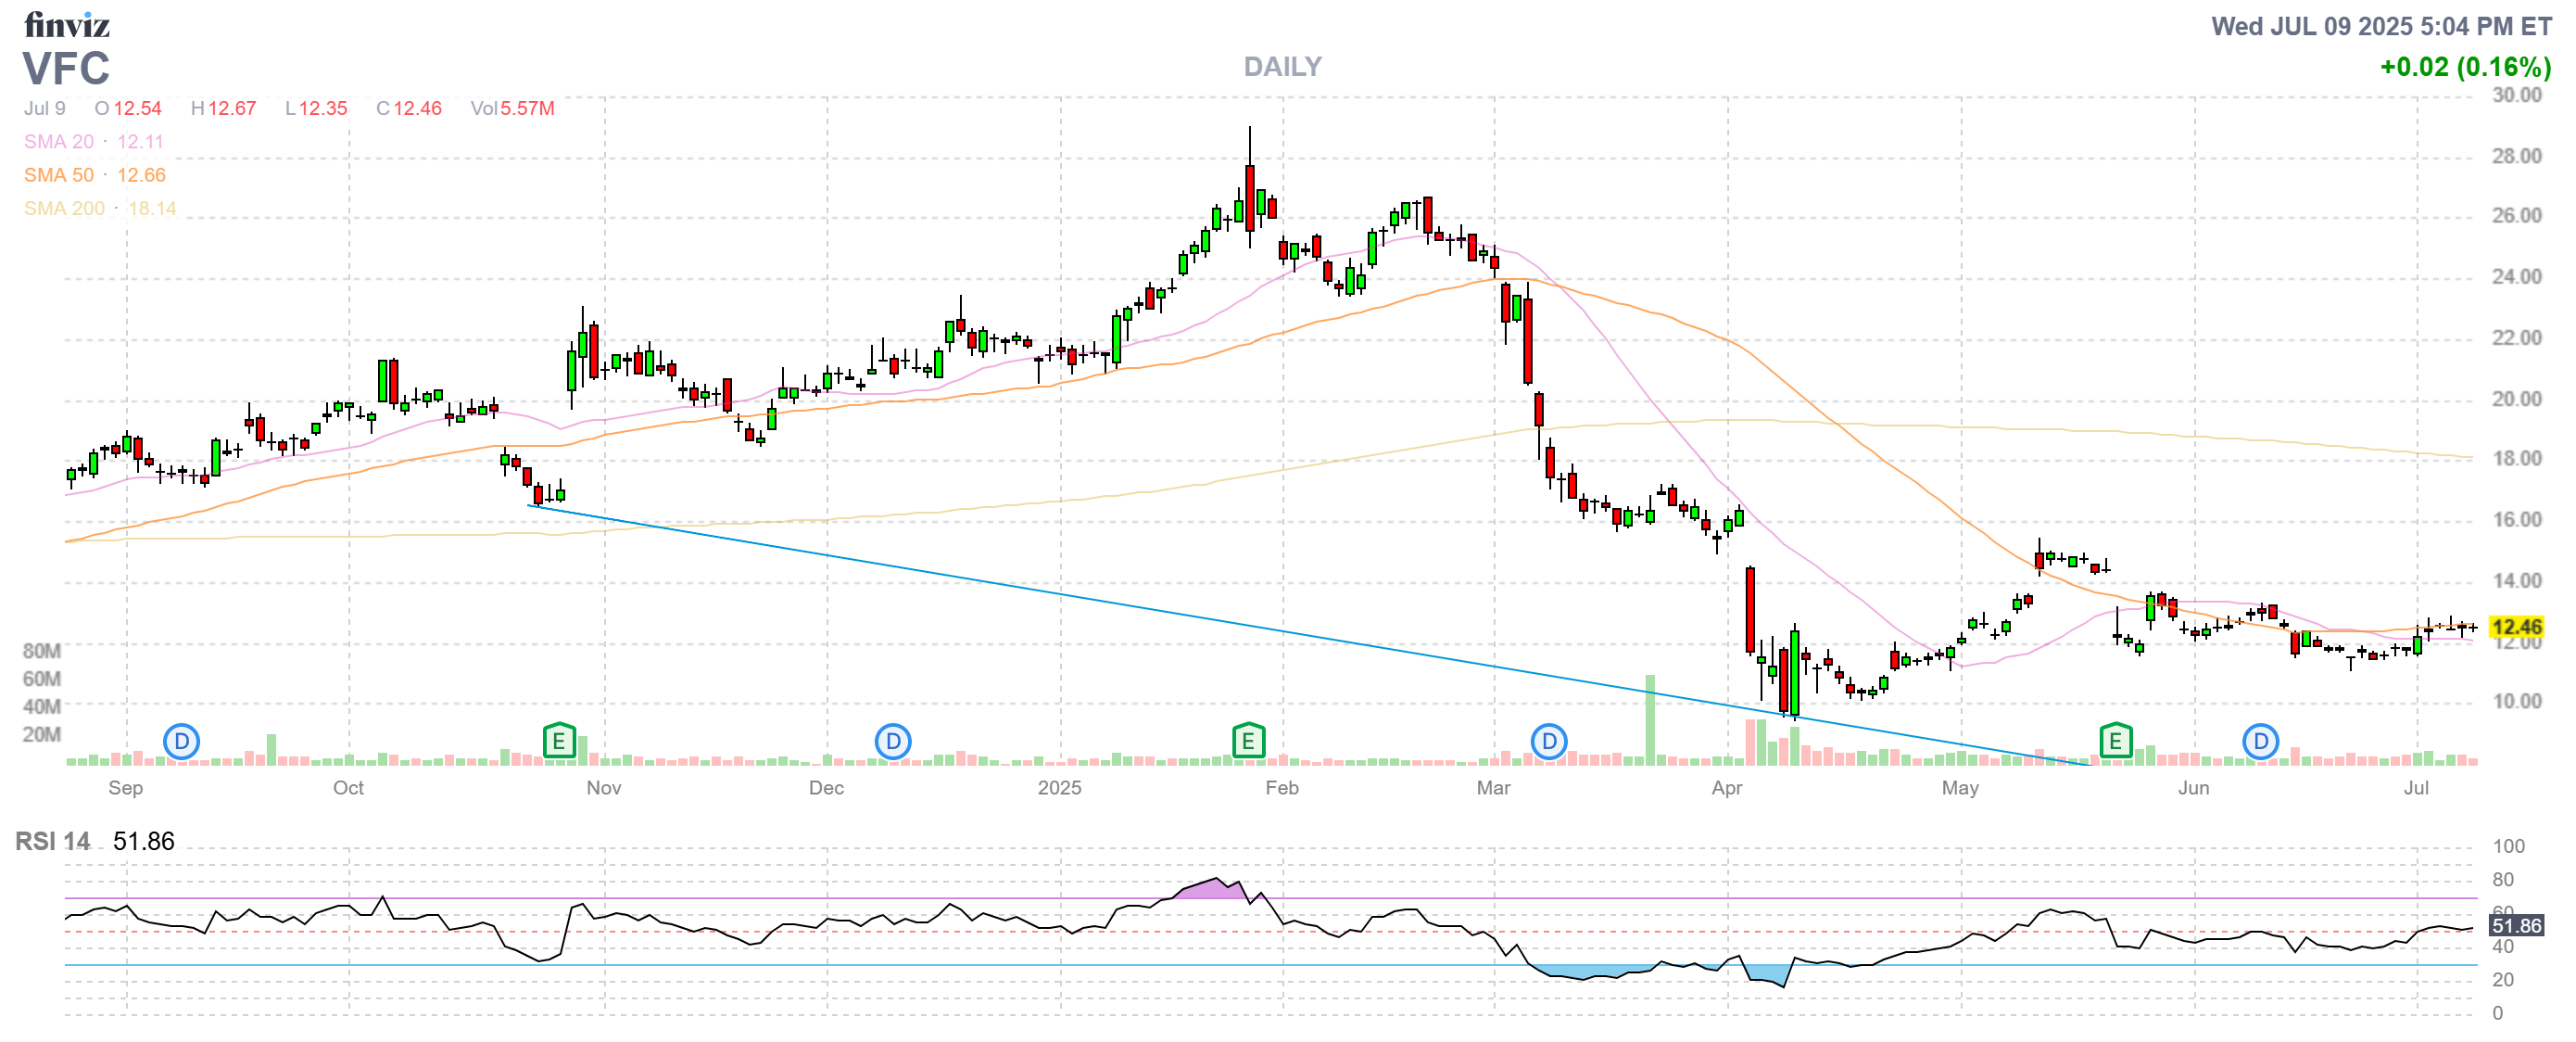
- VFC – You are in luck because it’s cheaper than our entry! This and outdoor-wear manufacturer and hopefully will follow Foot Locker’s footsteps – eventually. For now it’s net $1,480 and we have 18 months so we will wait and see how tariffs affect them. Upside potential at $15 (lower expectations) is $1,020 (68.9%) and higher than that would just be a bonus.
-
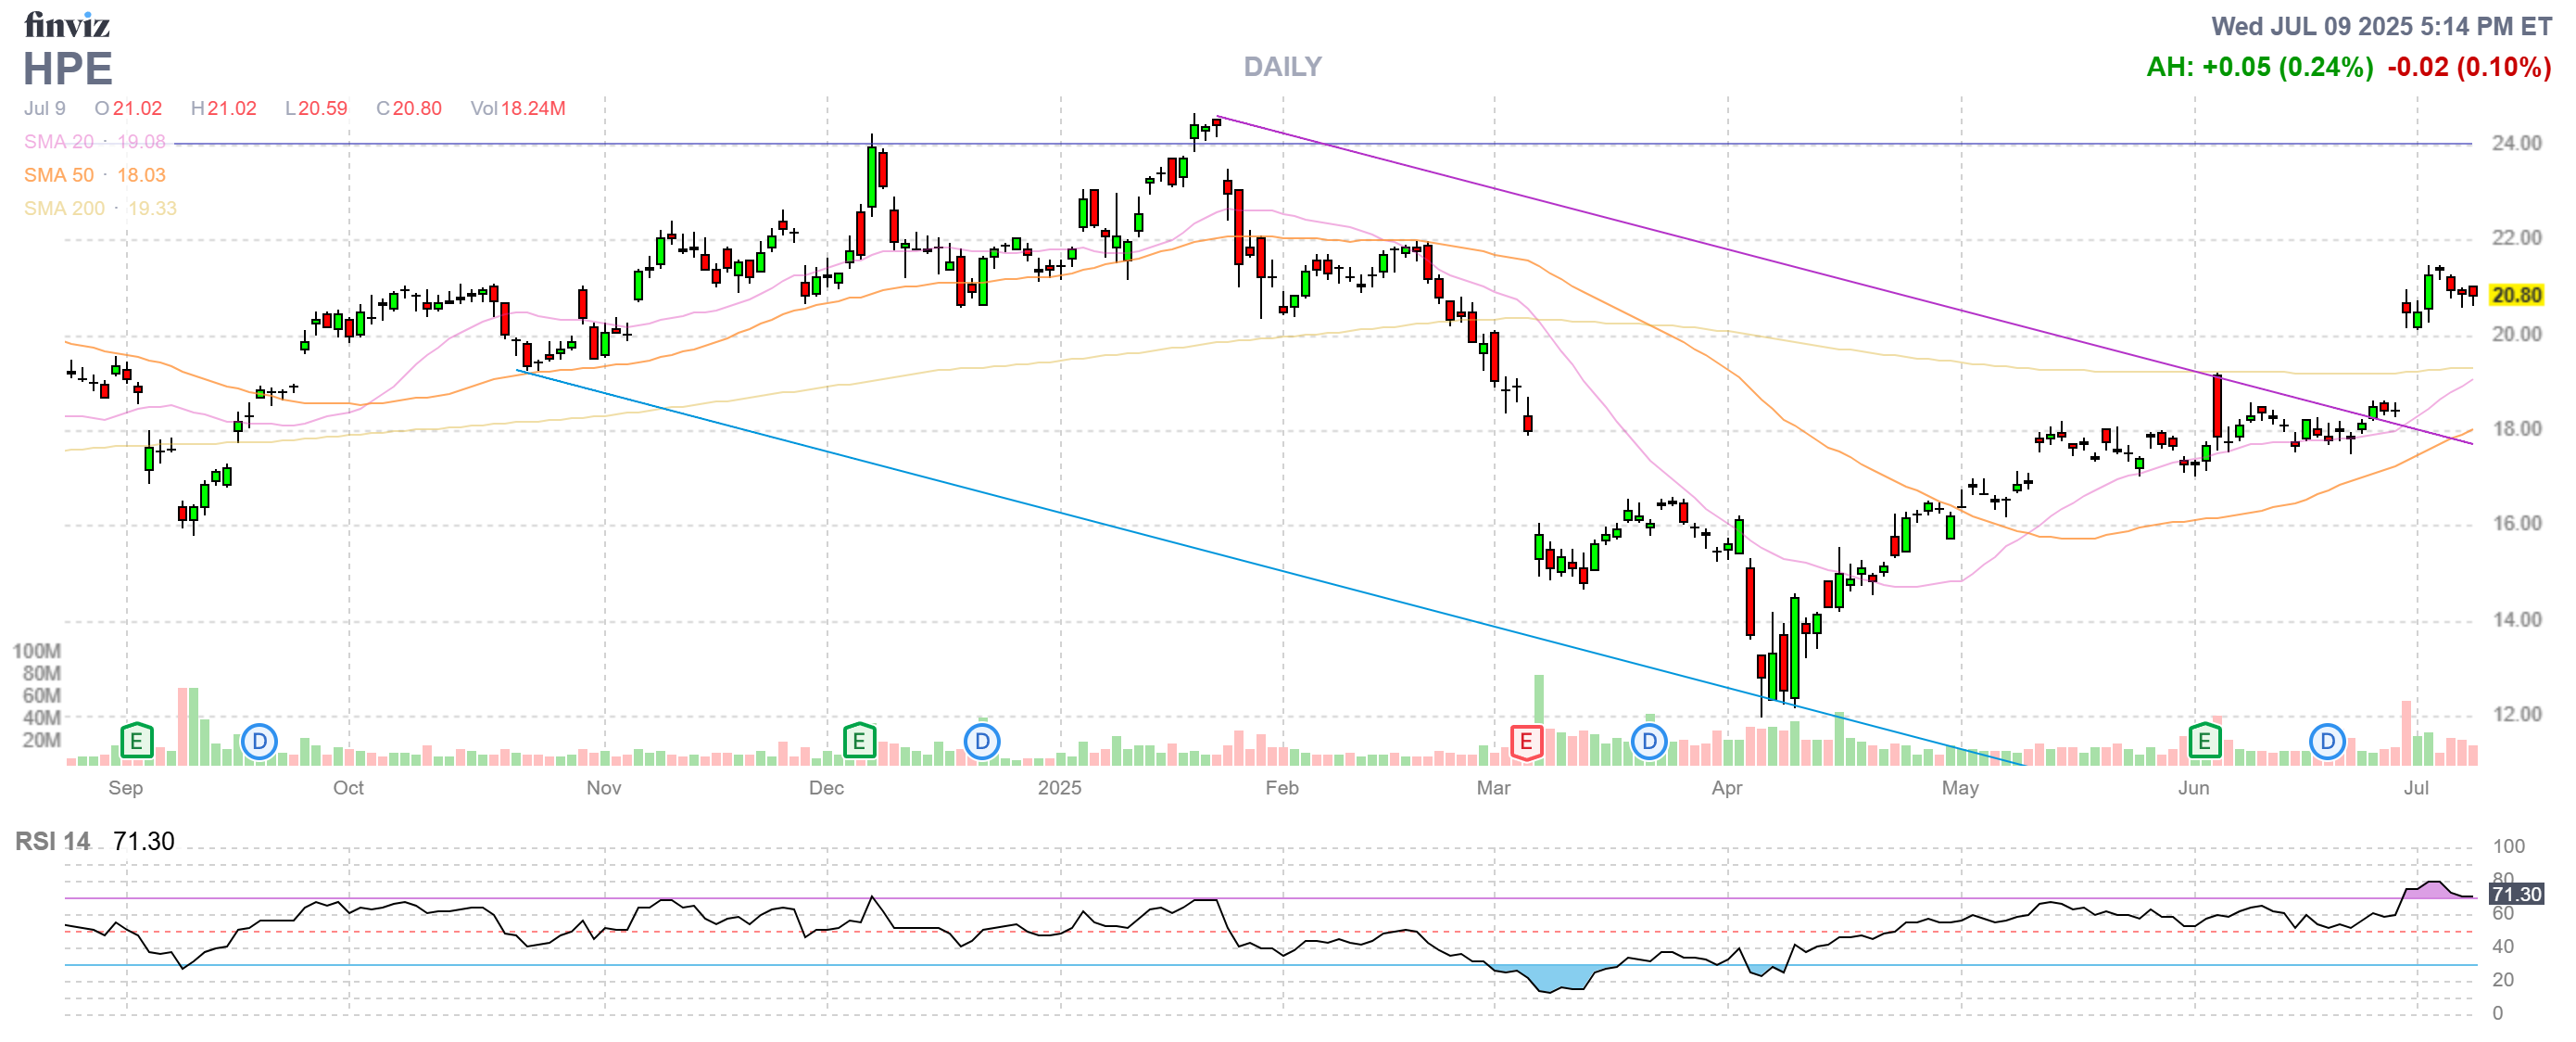
- HPE – Already net $3,450 with lovely gains and the Aug $17 calls ($3,725) can be rolled to the Nov $19 calls at $2.85 ($2,850) so we’re spending net $875 to at $2,000 of upside potential and now it’s a $4,000 spread but we have a time advantage so you have to thing about these differently. We used 3 months of time and $875 to roll up $2 in strike so let’s say we expect to get to $24 and we have plenty of time to make that position so we’ll assume we spend, conservatively, $2,000 more ($1,740 originally + $875 + $2,000 more =) $4,615 will be our basis and we’ll be in the $9,000, $15/24 spread so our upside potential if all goes well is $4,385.
- BUT, we’re already at $3,450 so we have to add $2,875 to that as we are now risking our gains so it’s $6,325 with $2,675 (73%) left to gain. That’s not bad but we MIGHT be able to do better with $6,325 so we’ll see how next earnings go.
-
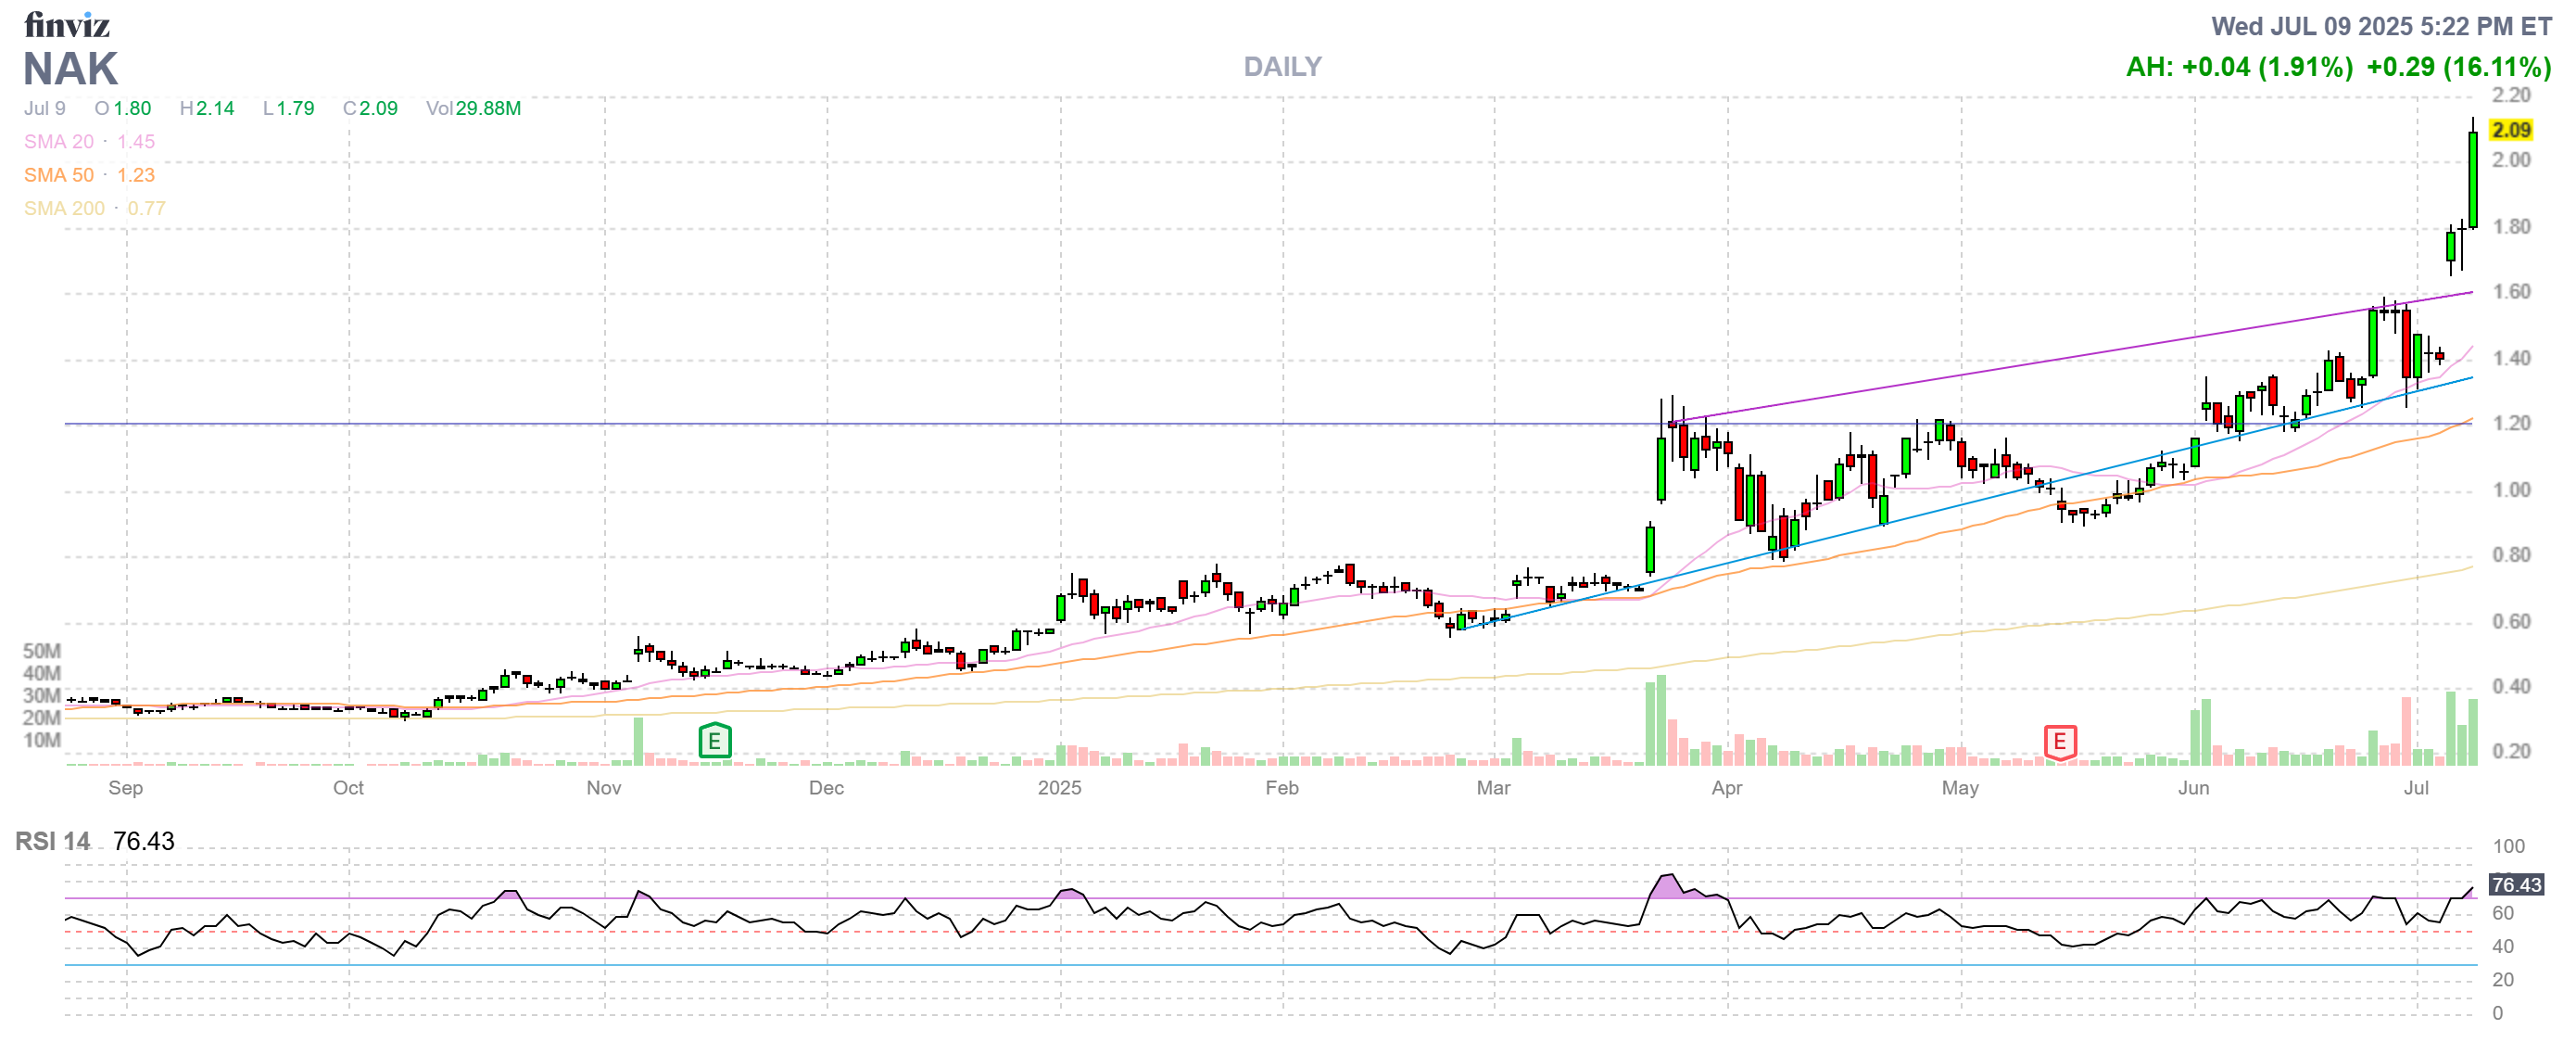
- NAK – Another one that exploded past our target. In fact, it just popped after hours on an update on their EPA negotiations (summary: “What EPA?”). This was, of course, our premise for buying them – that Trump would dismantle the agency that is stopping NAK from building their mine and endangering the US Salmon supply. Mission accomplished! If they get a full approval, this could be a $5 stock but that won’t help us with this spread.
- Fortunately, they now have 2027 options so we can now buy 15 2027 $1.50 calls for $1.30 ($1,950) and sell our long stock for $2,100 or better and then we will roll our 10 short Dec $1.50 calls to something higher – we’ll figure that out later in the week. Since the 2027 $4s are 0.85 and that would make a $2.50 ($3,750 spread) and we started with a net $210 credit, we’ll just go by the current net of $975 and call it $3,025 (310%) upside potential.
- It needs to be noted that, LAST MONTH, I said about our NAK position:
- “NAK – Fun day today as they collected a royalty ($12M) that buys them another 6 months but, more importantly, Trump is rapidly deregulating and the EPA is being defunded so NAK is feeling good about their chances to be allowed to strip mine Alaska and, if the salmon don’t like it – there’s a gun store at the other end of the bay. We’re on track for $1,500 and the current net is $510 so $990 (194%) upside potential remaining and we started this trade with a net $210 CREDIT in our only trade that uses margin ($1,000) – because it was such a good deal. Obviously great for a new trade as it matures in 5 months!“
- That $990 (194%) is IN THE BAG now – we’re just playing for bonus money. The point is, these reviews have fabulous opportunities in them – and we do them every month…
-
- B – Over our target (like a mantra in this portfolio!) at $20.80 and we have to roll the 3 July $18 calls at $2.81 ($842) to 3 Sept $19 calls at $2.40 ($720) so it will cost us $122 to gain $300 of upside – that works! That drives our basis from $2,645 to $2,767 and our current net is $3,116 and our 4 2027 spreads should be good for $2,000 but the 2027 $25s are $2.20 so, let’s call that our roll and those 3 spreads would be $12 ($3,600) so $5,600 is an upside potential of $2,484 (79.7%) – that’s fine!
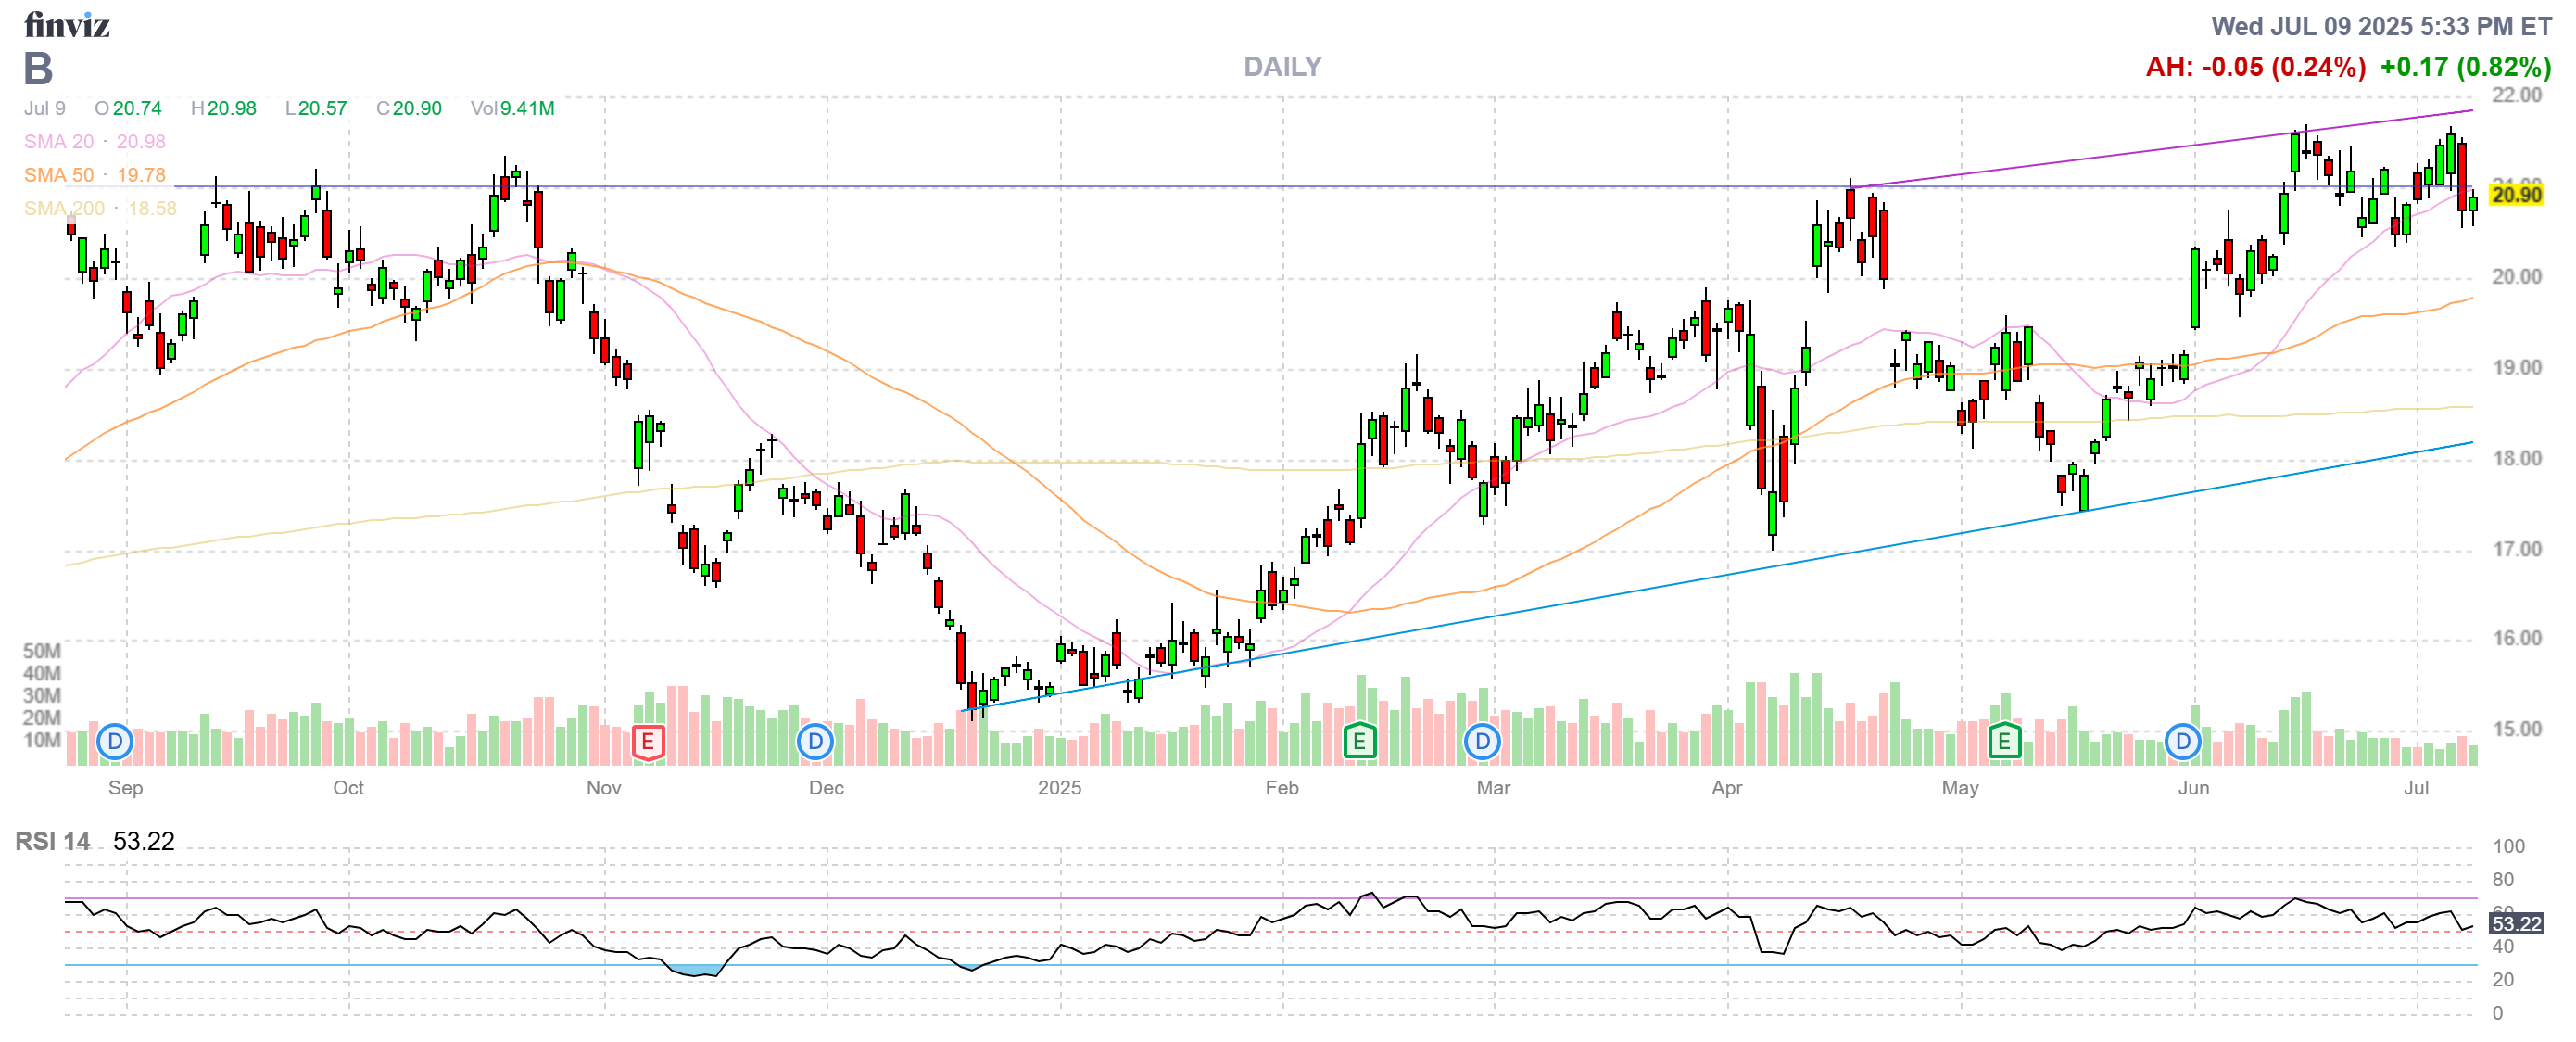
It’s like gardening: A little pruning here, a little trimming there and, once in a while – you need to pull out a weed or, gasp!, replant! As long as we’re making more than 60% over the next 18 months on a position – that keeps up our 41.2% average and we are still on our way to $1.2M in 8 years…
-
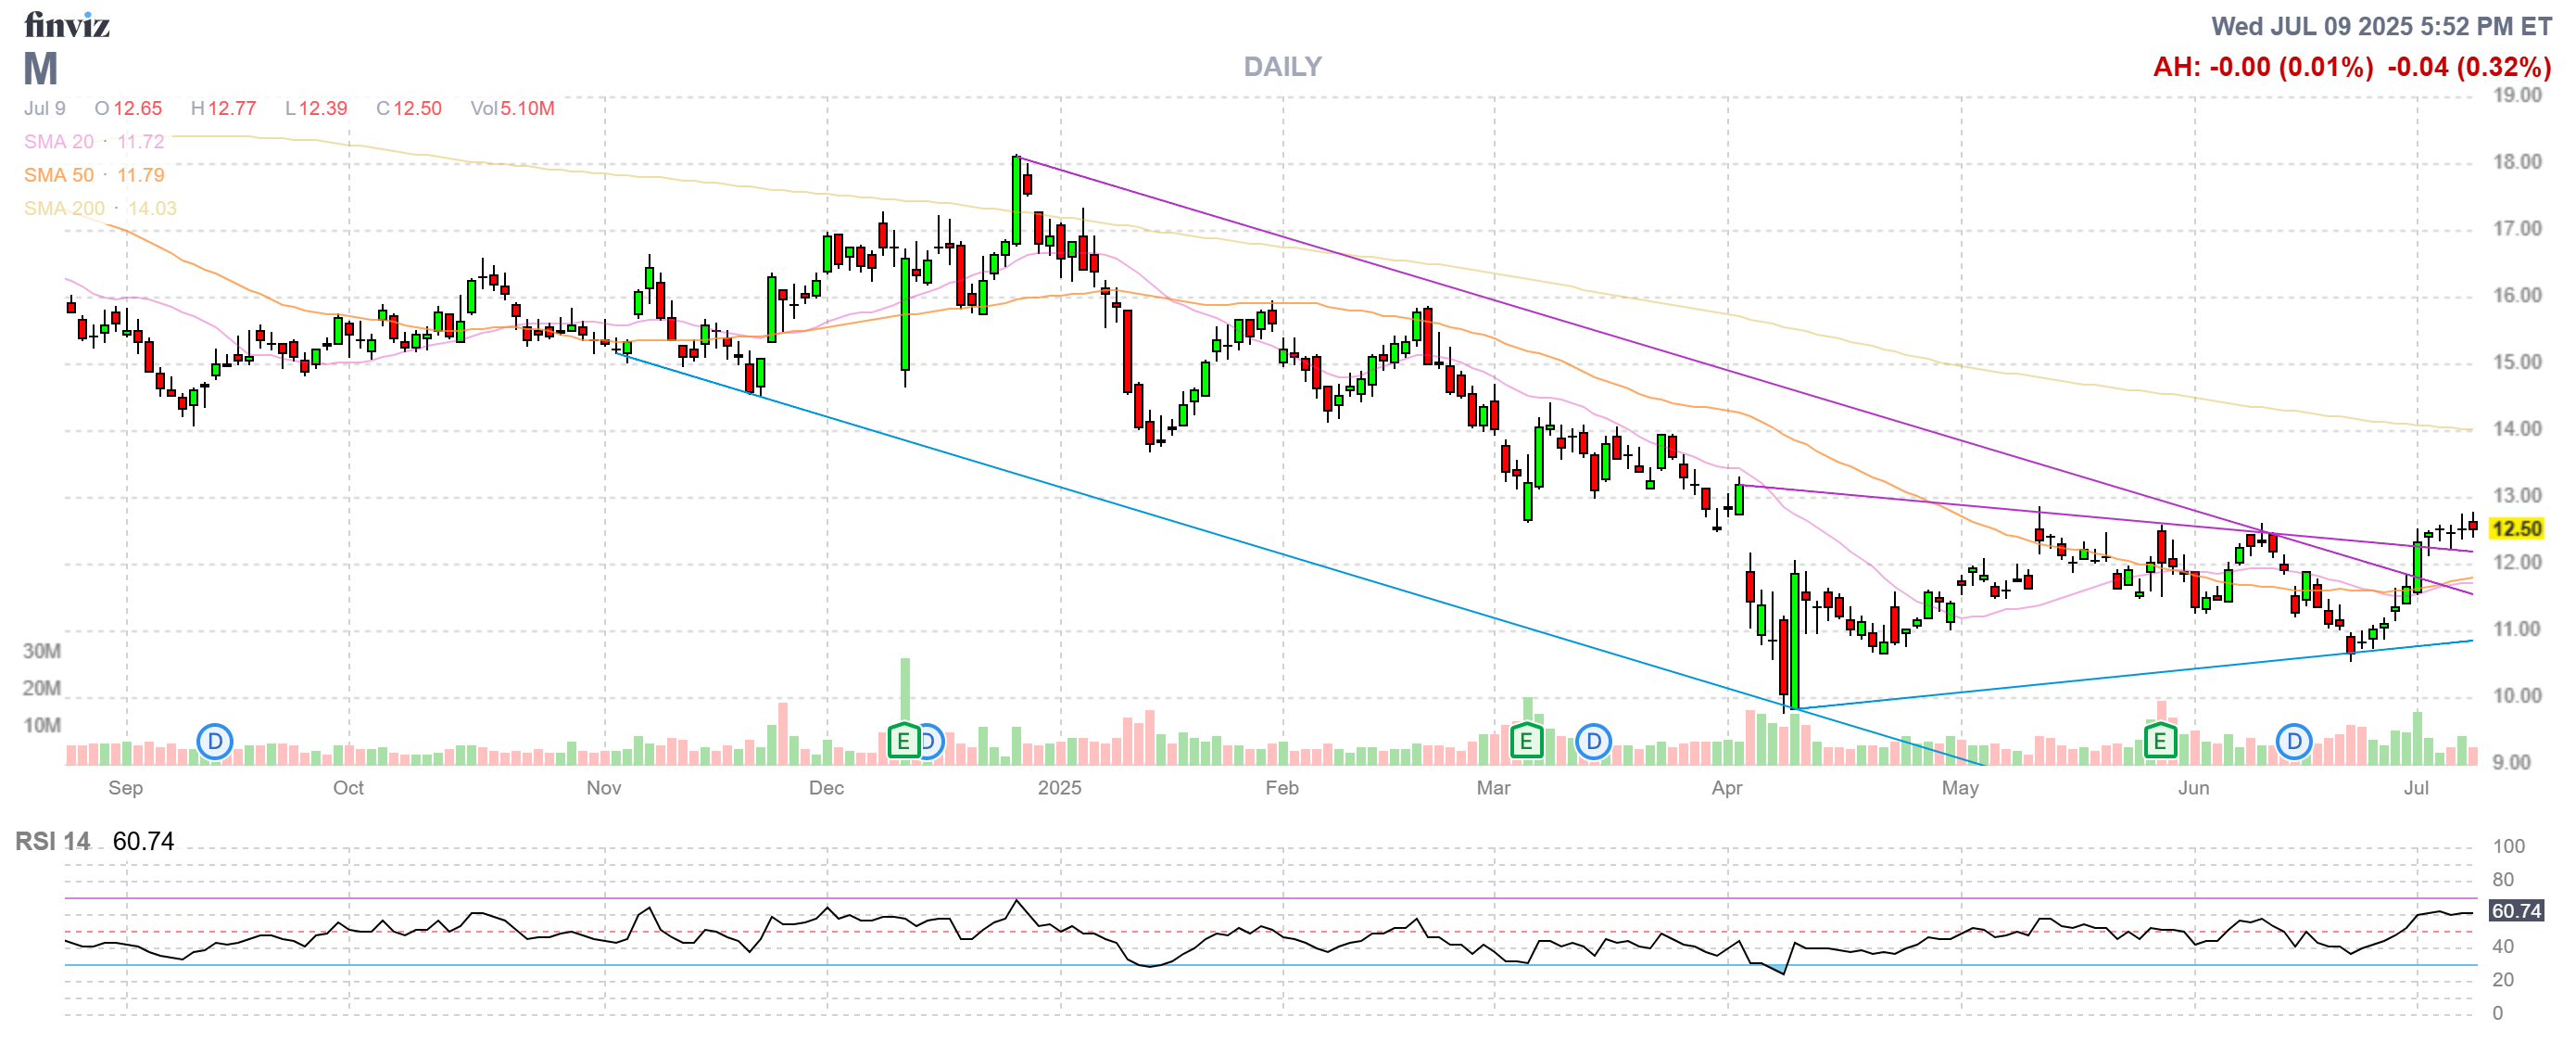
- M – There are 15 of the 2027 $10 calls, not 10. It’s a $10,500 spread (we worked it out last month) at net $3,905 so there’s $6,595 (168%) upside potential and, of course, we’ll roll the short calls and hopefully do better.
-
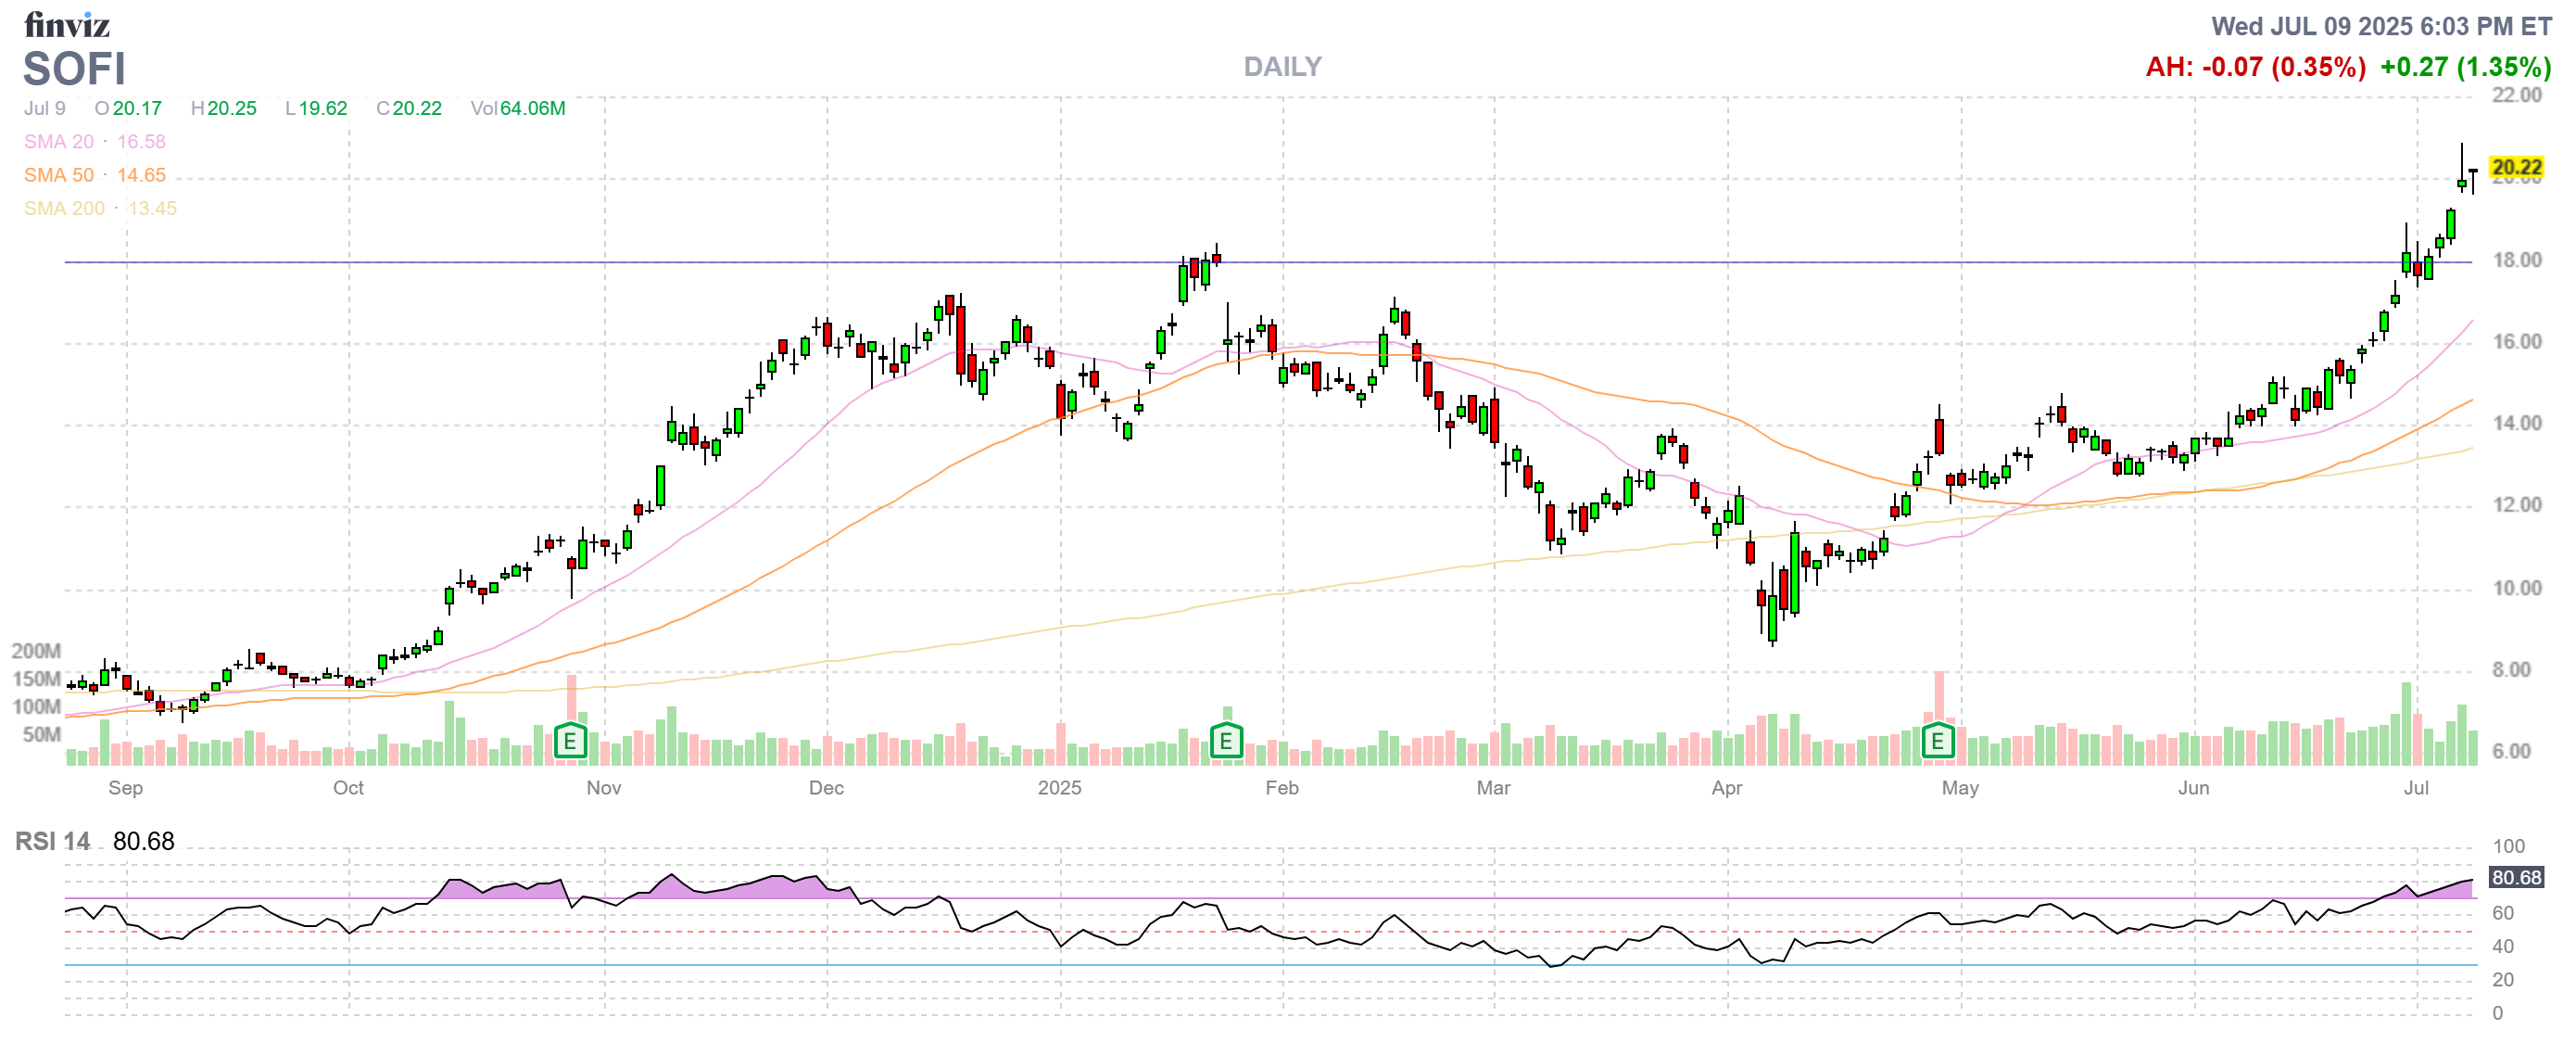
- SOFI – This one is a rocket! Fortunately, we’re not even fully covered so net $5,990 and we top at at $2,500 on 5 and $1,400 on 2 and 3 uncovered are $3,564 so that’s $7,464 with an upside potential of $1,474 (24.6%). I’m sure we can improve that:
- The 2027 $22 calls are $5.65 so, if we roll our 5 short 2027 $15s ($4,350) and the 2 short $17s ($1,535) to 10 of the short $22s ($5,650), that’s net $235 and now it’s a $12,000 spread less the current net $5,990+$235 gives us an upside potential of $5,775 (92.7%).
-
- UUUU – Another new one and it’s net $1,822 on the $4,000 spread so $2,178 (119%) of upside potential plus a bit of rolling to improve it down the road.
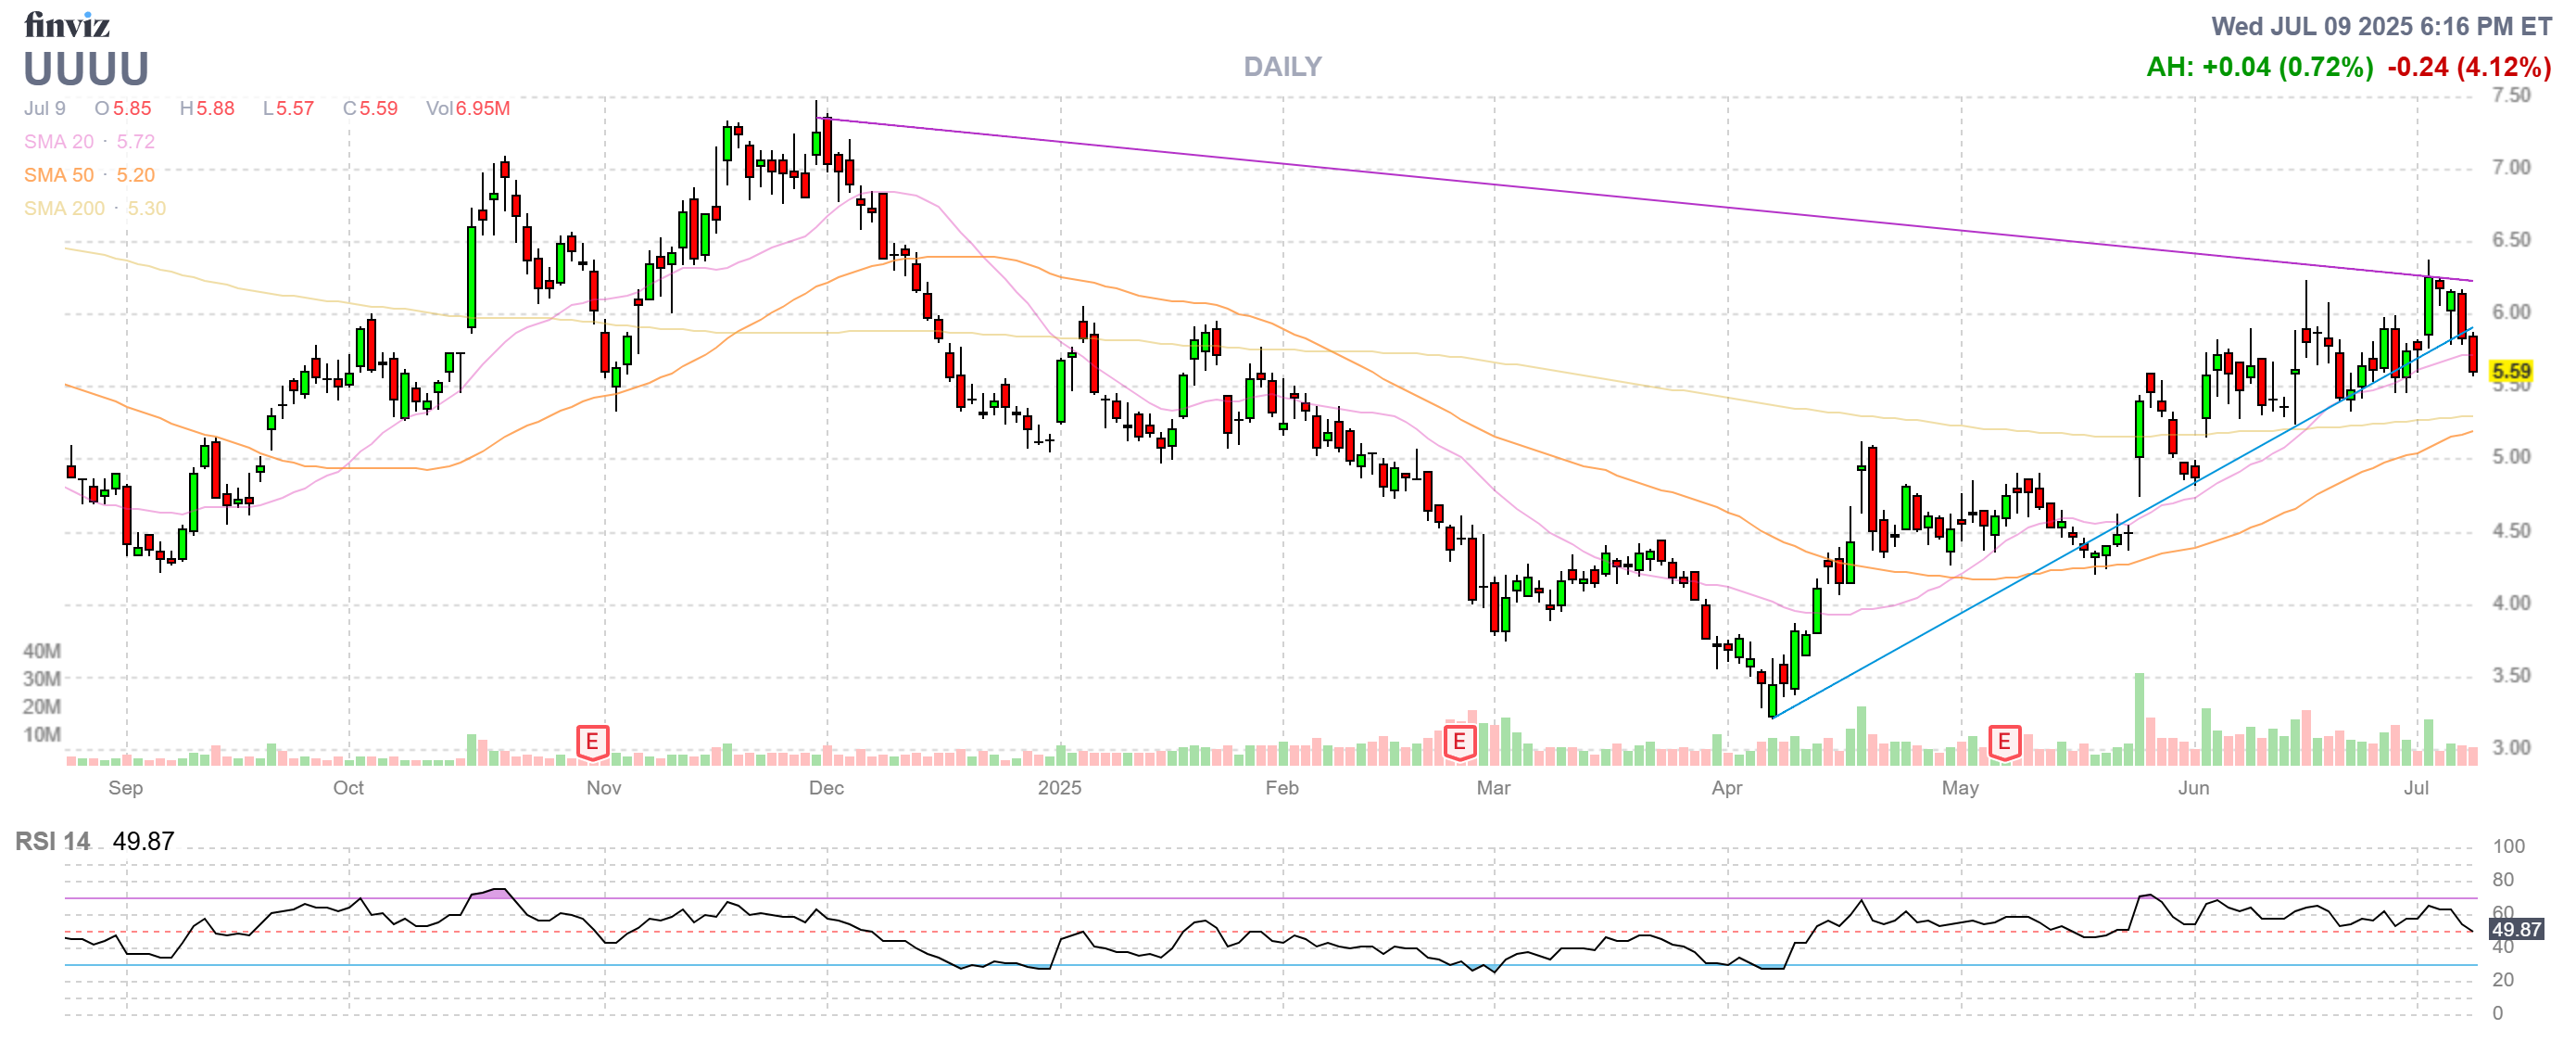
You can see how we make such scandalous amounts of money! If UUUU is below $7 in Oct, those calls go worthless (+$188) and we sell 5 Jan $6s, which are currently 0.90 ($450) and we use that $638 to roll the 2027 $5 calls ($2.08) to the $4 calls ($2.50) for net 0.42 ($840) and then we’ve spent net $202 to improve our position by $2,000 while widening our spread. All these minor adjustments add up!
-
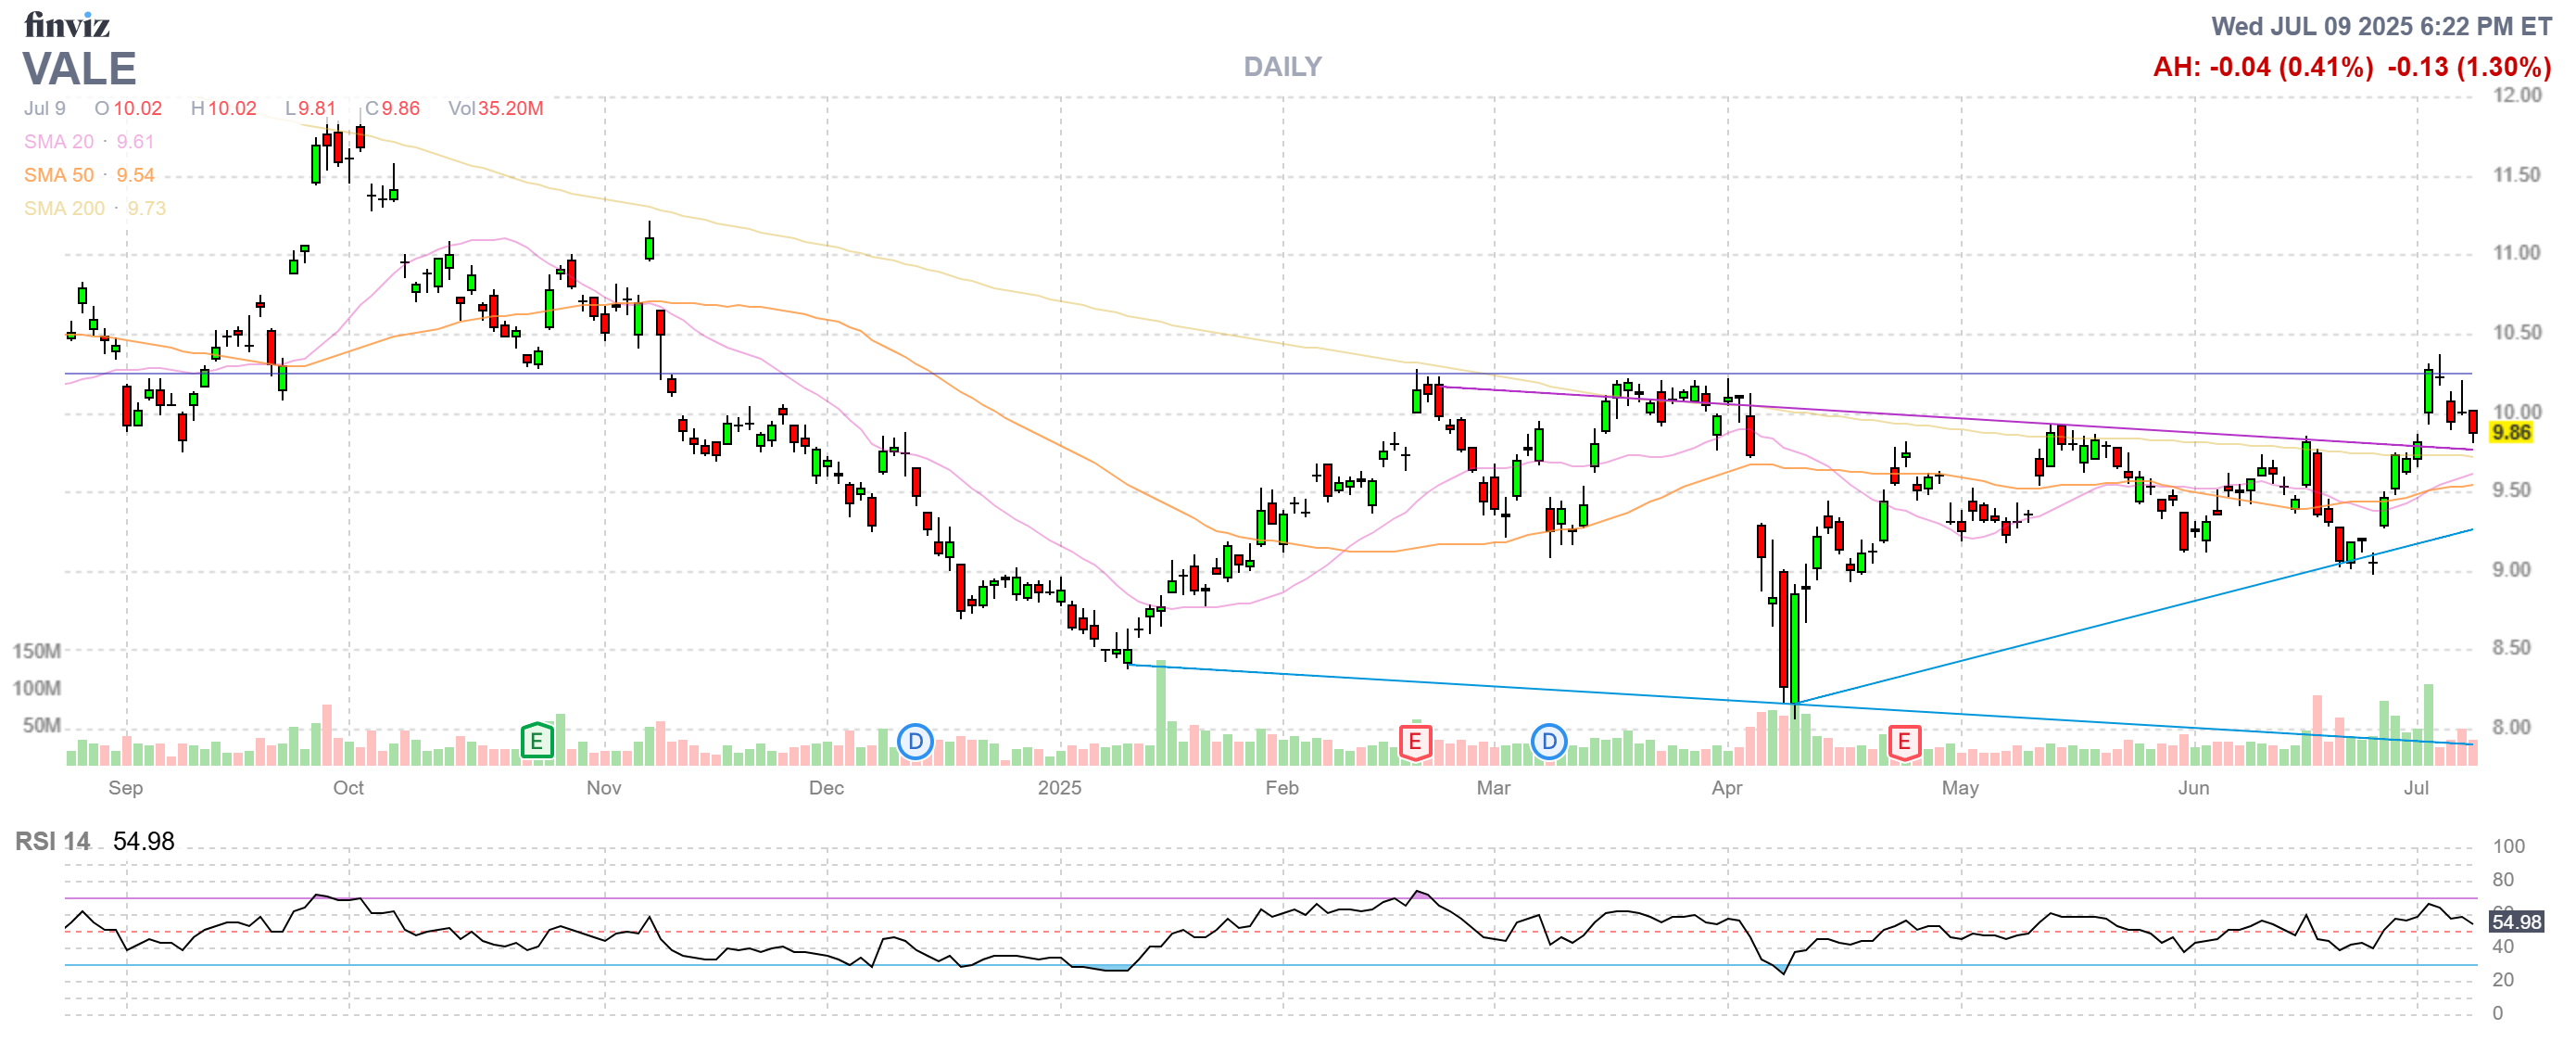
- VALE – Our biggest loser by far! They just got rejected at $10 and earnings are probably at the end of the month and I don’t see how they can disappoint the very low expectations so I’m hoping earnings get them over the hump. I’m hoping we get $1 back on the Jan $12s but that would take a $2 pop so fingers crossed is the best we can do here. If we do get to $12 at some point, the 2027 $8s should be 4 ($8,000) and currently we’re net $4,225 so $3,775 (89%) upside potential is worth keeping unless earnings are worse than expected.
So we have here 15 well-diversified positions with an upside potential of $33,485 (71.6%) and that would take us to $92,588 – so we’re good for the next 18 months – even if we don’t make another trade! We only spent net $3,334 on today’s adjustments so we have $4,143 left in cash and that’s not enough to buy new positions.
We’ll be adding $700 next month and we might decide to cash something out after earnings but we’re in very good shape to make another $1.2M in 8 years – so we’re not going to trade just for the sake of it, right?
If you want to take control of your trading and follow us LIVE with ALL of our Member Portfolios, you can join us here at PhilStockWorld:
High Finance for Real People – Fun and Profits!


")
