
“And when the morning light comes streaming in
I’ll get up and do it again
Amen” – Jackson Browne
I does feel like we’re doing it over and over again. I could never be a singer as I hate to repeat myself – it would be torture for me to sing the same song, over and over and over again. In fact, reflecting on these artists as they age – it amazes me that even decades later, they don’t change a word in their songs.
As market players, we don’t have that luxury, the markets are an example of the “Butterfly Effect” at 10x speed – hundreds of things happening all over the World, every day, cause ripples that can make drastic changes to the US market. Something Anya said about words and concepts being like icebergs (some have tremendous depth while some are mere whisps) is also true for socioeconomic events – something we can talk to her about in today’s Live Webinar (1pm, EST – Join us there).
When I was a child in the 70s and 80s, my Grandpa Max and I used to go through the stock pages every Sunday – because that was the ONLY day the ticker information was published for all the stocks and I would circle stocks that made new highs and new lows and then we would comb through the business section to try to make sense of why this or that company was moving.
Now, that stuff is all at our fingertips 24/7 – but it can be a bit overwhelming and, these days, we face the additional burden of “Fake News“, which is coming at us from all angles. AIs can help us sort though this barrage of data but it can also reinforce the BS – just like your web searching can become a rabbit hole that reinforces your existing beliefs as the algorithms, in an attempt to please you (market to you, really) – tell you EXACTLY what you already want to hear.
I used to pound the table for our Members, saying you should spend at least 25% of your time reading things you completely disagree with. Some things are worth repeating over the decades and now, more than ever, I encourage you to purposely, FORCEFULLY broaden your perspective – whatever it may be.
This morning, we have the repeating pattern of dip-buyers coming in the day after we get bad news and the Futures are up about a quarter-point after yesterday’s 1% sell-off. We’re coming in to 8:30 and already we have a 10% drop in the Mortgage Applications Index but that’s noisy, weekly data – we’ll see how the rest looks…
8:30 Update: Unlike CPI yesterday, PPI came in flat, at 0.0%, down from 0.3% and 0.4% (core) in the May reading. Of course, as with yesterday’s CPI, you have to actually read the report and not just go by the headlines as Final Demand Goods (the stuff Consumers buy) was indeed up 0.3% and Energy was up 0.6% for the month. Services fell 0.1%, led by Hotels plunging 4.1% as Consumers can’t afford to travel so – YAY???
Portfolio Management is up 2.2% and that’s a good reminder that we should be raising our subscription prices – as we haven’t done so since before Covid! The “flat” PPI is less a sign of broad disinflation and more a function of offsetting trends: modest Goods Inflation (especially outside Food/Energy) counterbalanced by a pronounced drop in major Service components. Weakness in key Service categories, especially Travel and Retail – helped “erase” Goods Cost Pressures at the headline level.
🚢 What June’s CPI and PPI Really Mean for Consumers and Markets
The latest inflation data tell a story far more nuanced—and pressing for consumers—than the headline numbers suggest. While the June Consumer Price Index (CPI) rose 2.7% year-over-year and the Producer Price Index (PPI) was flat at 0.0% month-over-month, digging deeper shows essentials are rising much faster than the averages imply.
Inflation Where It Hurts Most
Here’s how price growth in core necessities stacks up, compared to the overall CPI rate:
-
-
-
-
Utility Gas: +14.2%
-
Car Insurance: +6.1%
-
Electricity: +5.8%
-
Meat and Eggs: +5.6%
-
Car Repair: +5.2%
-
Homeownership: +4.2%
-
Hospital Services: +4.2%
-
Rent: +3.8%
-
Food Away From Home: +3.8%
-
-
-
Notably, headline CPI has now ticked up for two months in a row, the first such stretch since January, suggesting price pressures aren’t fading.
CPI and PPI: Why the Disconnect?
-
-
-
Headline PPI was flat, but this hides offsetting trends: modest inflation in goods (especially energy and select consumer staples) was erased by a steep drop in certain service costs, like hotels and retail. This explains why, even if producer prices overall look benign, the costs funneled down to consumers in key categories—especially energy, food, and insurance—remain hot.
-
Services deflation isn’t helping consumers much, because the largest drops were in categories like travel and accommodations—not everyday essentials. Households, especially middle and lower-income, feel the pinch most in categories that continue to outpace wage growth.
-
-
What Does This Mean for the Consumer?
-
-
-
Budgets remain stressed: Households aren’t experiencing the “disinflation” narrative. Instead, they confront elevated costs on everything from keeping the lights on to buying groceries or insuring a car.
-
“Core” inflation is stickier than the headline: For many families, real-world inflation runs well above the official 2.7% due to where price hikes are concentrated.
-
-
Signal for the Market and Investors
-
-
-
Earnings season watch: Focus should be on companies with direct exposure to “sticky” inflation categories:
-
Utilities, insurers, grocers, auto repair chains, and healthcare providers may see top-line growth thanks to their pricing power, but could also face pushback if consumers cut usage or trade down.
-
Consumer discretionary, travel, and hospitality firms could feel the squeeze as households redirect spending to cover essentials.
-
-
Margins in focus: For producers, June’s flat PPI means input costs aren’t accelerating for most, but where costs do rise (energy, some foods), companies with less pricing power may see margins pressured.
-
-
What to Watch Next
-
-
-
Earnings guidance: Listen for commentary on cost pressures, labor and input pricing, and how much firms are able to pass these on.
-
Consumer behavior: Evidence of trading down, lower discretionary spend, or rising delinquencies may signal further stress.
-
Fed policy reactions: Sticky, essentials-driven inflation complicates the path for rate cuts—even as aggregate numbers look tame.
-
-
Bottom line:
Headline inflation may look moderate, but for most Americans, price hikes in gas, food, housing, and basic services remain a daily strain. For investors and analysts, watching corporate earnings for margin resilience and changes in consumer behavior will be key to gauging how this next phase of “not-so-great disinflation” plays out.
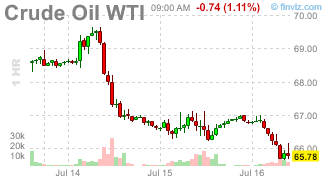 Year over year Final Demand is still 2.3% and we’ll get more data from today’s Fed Beige Book at 2pm and we are waiting on Industrial Production and Capacity Utilization at 9:15 and EIA Oil Inventories at 10:30. API last night was already a disaster for the Oil Bulls with a (drumroll, please) 19.1 MILLION barrel build in Crude Stockpiles!!!
That number was somewhat offset by a 4.5Mb draw in Gasoline and a 2.4Mb draw in Distillates but it still leaves a 12.2Mb BUILD in Oil and that’s almost one day of US consumption (15Mb) – WTF?!? This marks the third straight weekly rise in inventories, further pushing stockpiles to record highs and stunning oil markets that were positioned for a post-holiday draw.
A build of this scale suggests demand for crude products is running meaningfully below expectations because of economic slowdowns, reduced travel, or greater energy efficiency.
U.S. Production has held near-record highs, and Import levels may have ticked up as well. Any lag in Refining Capacity or soft Wholesale Demand can balloon Inventories. Gasoline and distillate draws are consistent with peak summer driving, but if refiners are ramping up fuel output while End-User Demand softens, crude backs up in storage.
A yawning gap between supply and demand for Energy is a classic sign of SLOWING Real-Side Economic Activity and could factor into Fed and analyst outlooks on growth, risk, and even Industrial Production and Capacity Utilization – speaking of which:
It’s 9:15 and Industrial Production is up 0.3% after being flat last month, so that’s good and Cap Utilization is up 0.1% to 77.6% and let’s imagine that production was refineries making WAY TOO MUCH OIL but that’s what happens when Industrialists and Politicians get together and try to manipulate the data – we are now CHINA!!!
A jaw-dropping 19.1 Million-barrel crude build signals that U.S. supply continues to outpace demand, upending bullish energy expectations and raising major questions about the underlying strength of the economy. For markets, this shock further muddies the outlook, just as investors try to make sense of persistent inflation and spotty growth metrics.
♦ The earnings season has started on a positive note, with a majority of companies beating analyst expectations.
-
-
-
Financial Sector Strength: A significant trend this week is the strong performance of the financial sector. Major banks including JPMorgan Chase (JPM), Citigroup (C), BNY Mellon (BK), Wells Fargo (WFC), Goldman Sachs (GS), and Morgan Stanley (MS) all reported profits that surpassed consensus estimates. While most also beat revenue forecasts, JPM’s year-over-year revenue declined. State Street (STT) was an outlier, missing on both earnings and revenue.
-
Broad-Based Beats: Outside of the big banks, results have also been largely positive. Companies like Fastenal (FAST), Simulations Plus (SLP), Albertsons (ACI), and Johnson & Johnson (JNJ) all reported beats on both their top and bottom lines. Johnson & Johnson and Prologis (PLD) also issued upside guidance.
-
Mixed Guidance: While results have been strong, some companies have issued cautious or mixed outlooks. ASML (ASML) provided downside guidance, and AngioDynamics (ANGO) offered a mixed forecast.
-
-
 Look Ahead: After the Close Today (July 16th)
Here are some of the key companies reporting after the bell and what to look for:
-
-
-
United Airlines (UAL): After a solid report from J.B. Hunt, the transportation sector is in focus. Analysts are expecting earnings per share of around $3.81. While this would be a slight decrease from last year, the travel demand picture will be a key area to watch. Prepare for a miss based on today’s economic data.
-
Alcoa (AA): The aluminum producer is expected to show significant earnings growth compared to a year ago, with analysts looking for EPS around $0.32. This is largely driven by higher aluminum prices. However, reports suggest its Alumina segment could show some weakness.
-
Kinder Morgan (KMI): The pipeline operator is expected to report a modest increase in earnings. Analysts will be focused on the demand for natural gas and the performance of its various pipeline and terminal segments.
-
Financials Continue: Several more financial companies are on the docket, including Synovus (SNV) and Home Bancshares (HOMB). Given the strong trend in the sector so far, they are likely to be watched closely for a continuation of positive surprises.
-
-
In summary, the early trend for this earnings season is positive, with more companies beating profit estimates than average, led by a surprisingly strong performance from the financial sector. The focus now shifts to whether this momentum can be maintained by industrial and transport names reporting later today.


")