
 Has it been 3 years already?
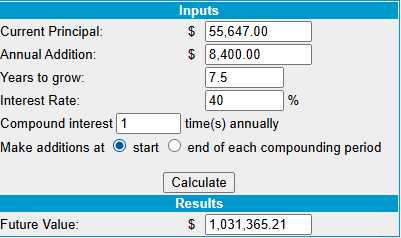
It was August 25th, 2022 when we set out on the seemingly impossible task of building a $1,000,000 portfolio by simply depositing $700 per month for 30 years ($252,000). I am very pleased to say that, after 3 years and 36 $700 deposits ($25,200) we have already made $30,447 in PROFITS (120%), which is 40% per year (so far) and, at this pace, we will hit our $1M goal in less than 8 years!
That means, even if you missed out on our first $30,447 in gains, you can still start now with $55,647, pledge to add another $700/month for 96 months ($67,200) and, at this 40% pace – you will be a Millionaire by July of 2032 – that’s a fun goal!
This whole project (and why I wanted to do this in the first place) is my micro proof of the Macro Lesson we teach our Members at PhilStockWorld.com – the lesson of PRACTICE and PATIENCE and CONSISTENCY – which is very well-represented in Jean Giono’s “The Man Who Planted Trees.” If you haven’t seen this before, I strongly urge you to INVEST half an hour to absorb a lesson that will serve you well the rest of your life:
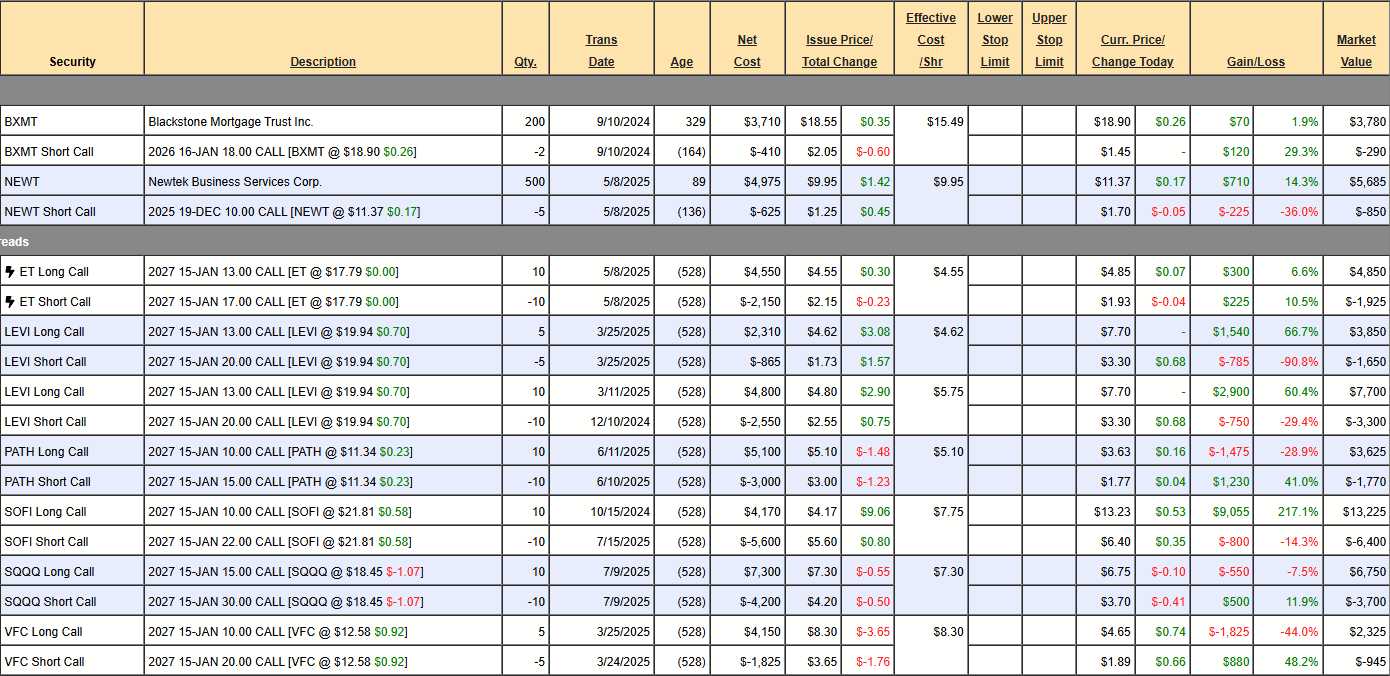
We don’t use margins for this portfolio and it’s a great way to learn our basic options techniques that can then be applied to our more advanced Member Portfolios. After putting in this month’s $700, we have $6,577 in cash available to play with – so let’s take a look at our positions and see what adjustments we should make and what new trades we might be able to add:
-
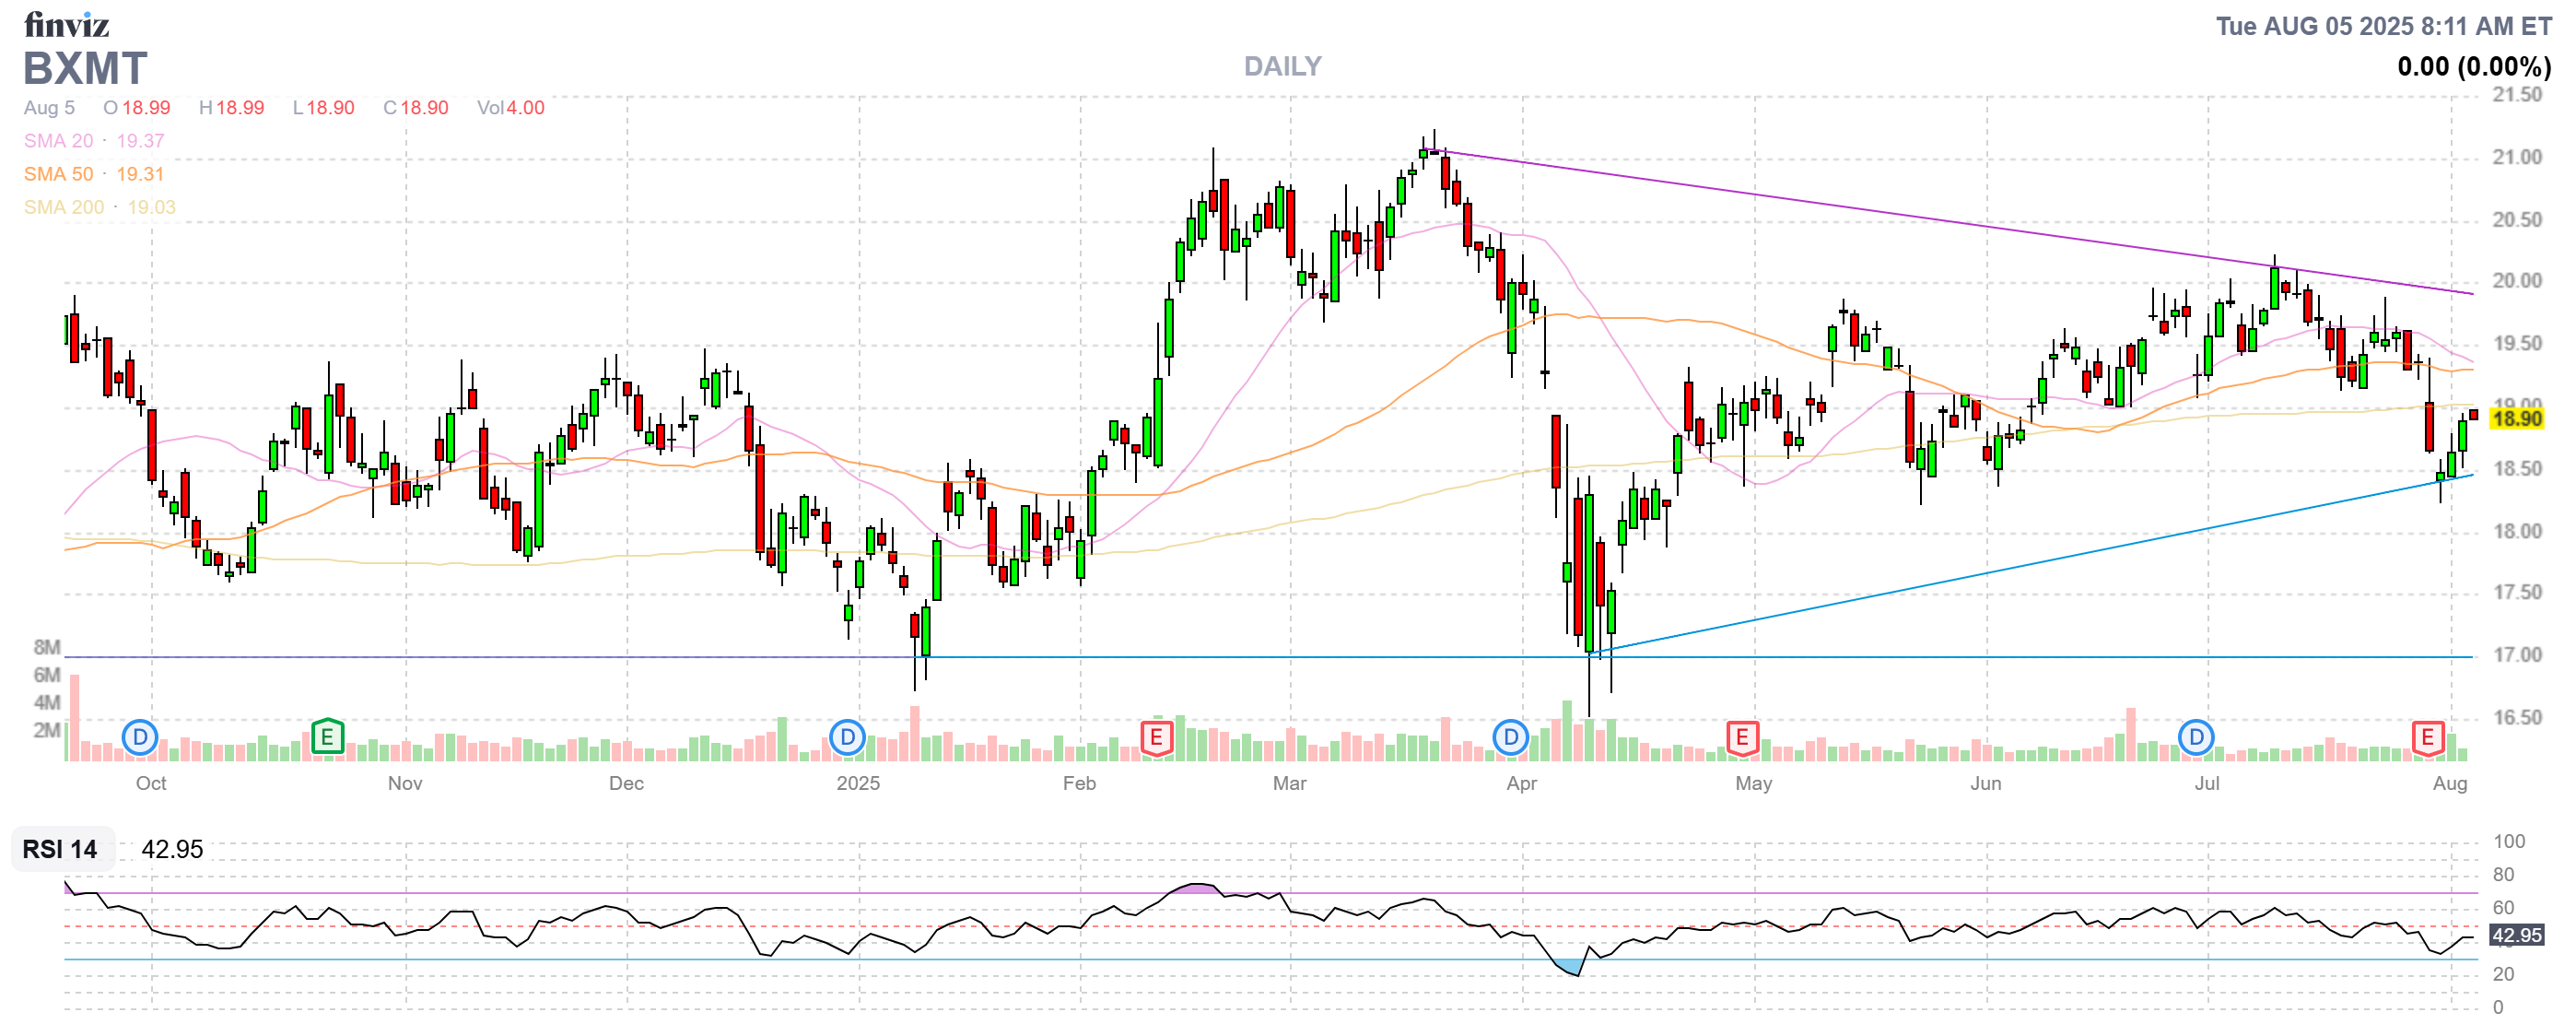
- BXMT – We just got a $94 dividend on June 30th, that’s an extra $376 (10.7%) per year and the spread is net $3,490 out of a possible $3,600 if we are called away at $18 in January but the reality is we’ll sell 2027 or 2028 whatevers and keep it going. Between now and Jan we expect ($94 + $94 (dividends) + $110 (profit from the spread =) $298 (8.5%) upside potential, which is not bad for 6 months – but also not great.
-
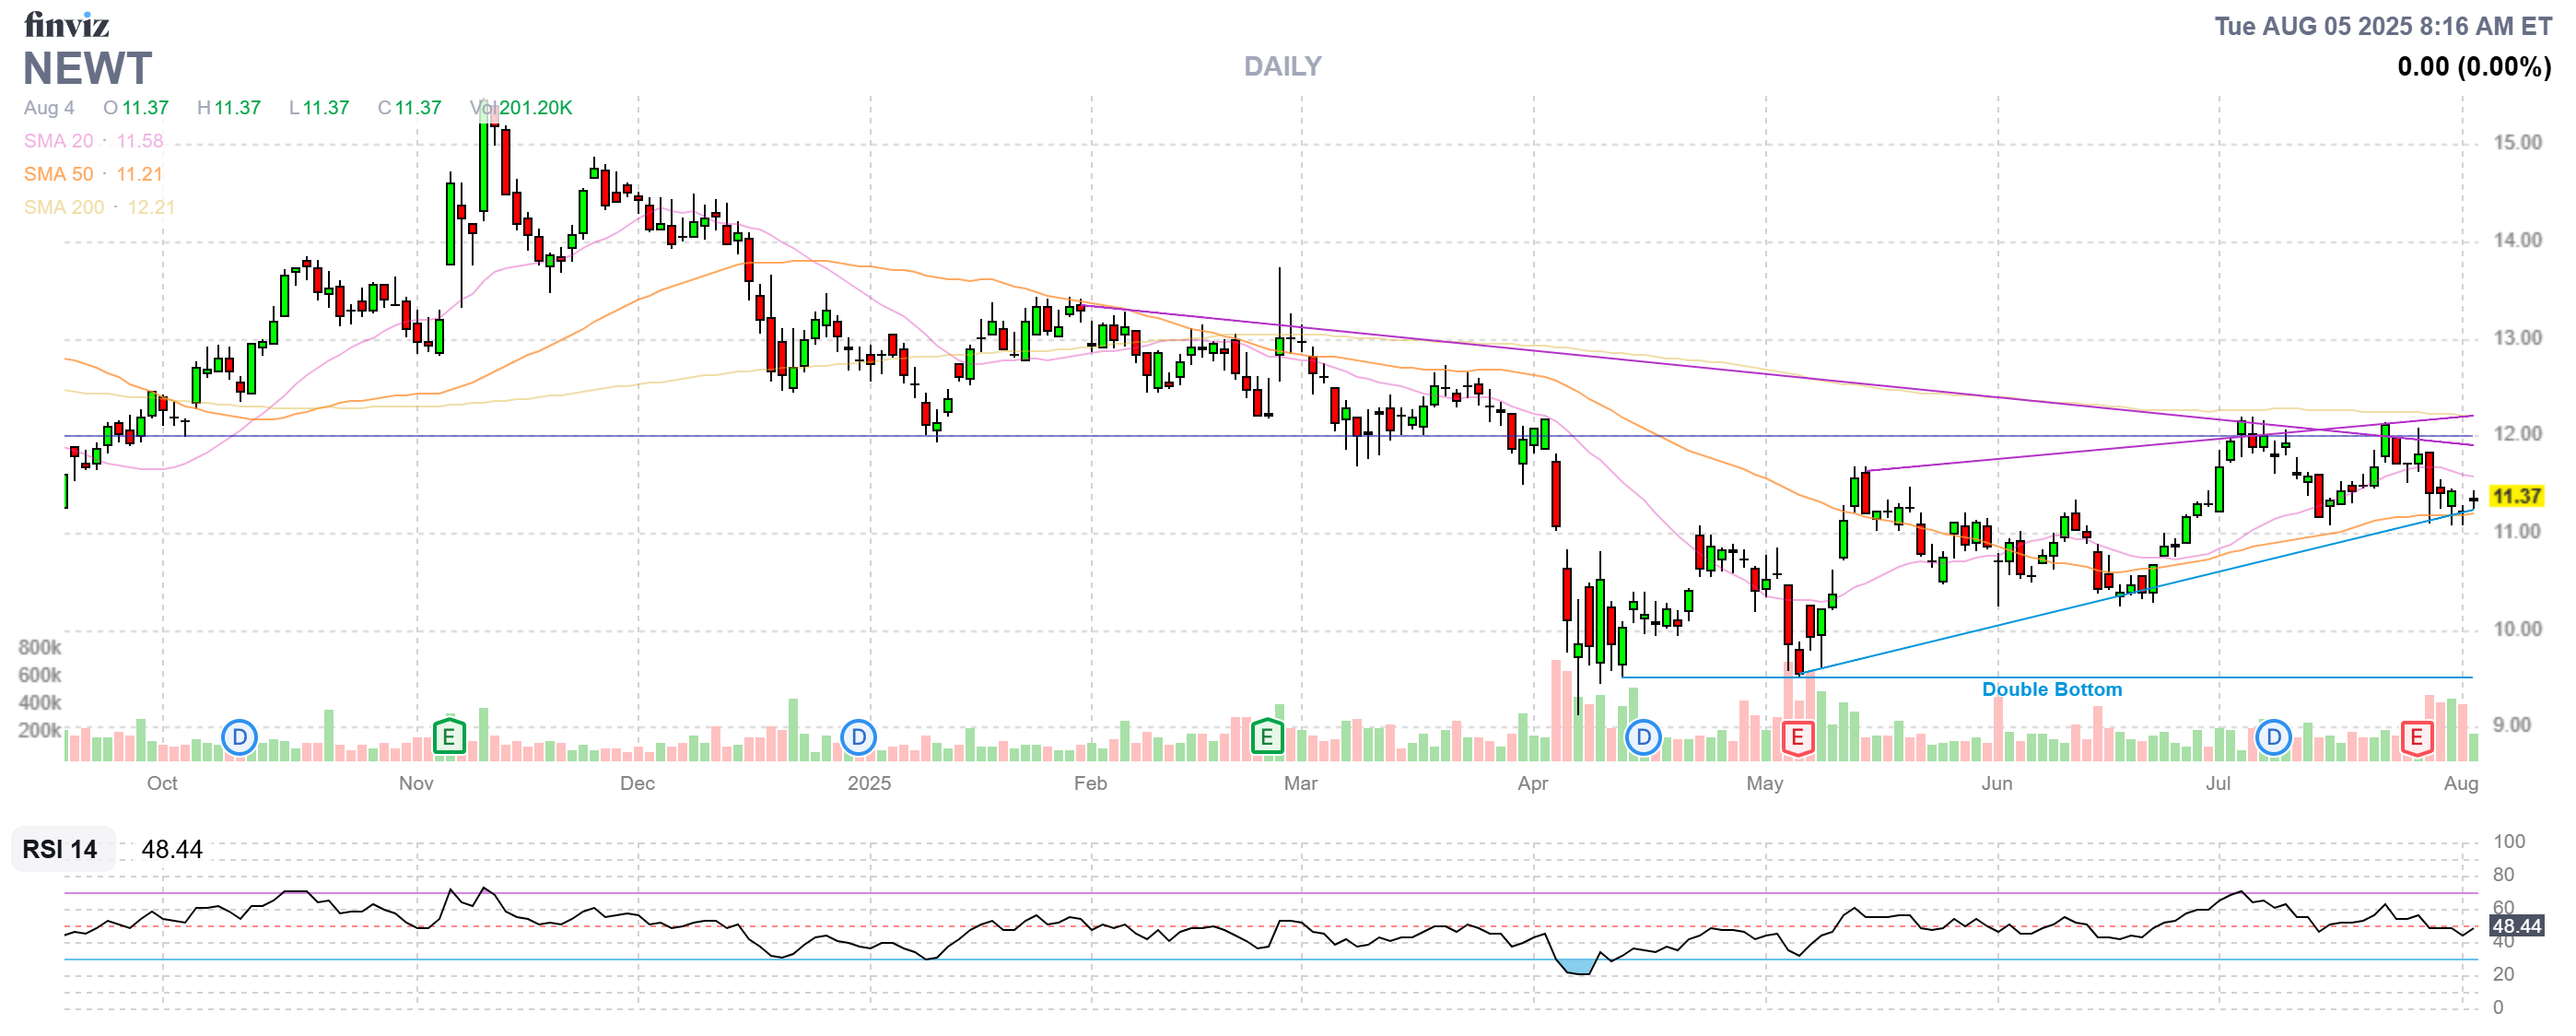
- NEWT – We got a $95 dividend from them on July 9th and that hasn’t been logged yet. That means just $95 more into expiration (Dec) and the net is $4,835 out of $5,000 so ($165 + $95 =) $260 (5.3%) upside potential by December. Are they worth keeping? Not if we have better use for the cash!
- On the other hand,
-
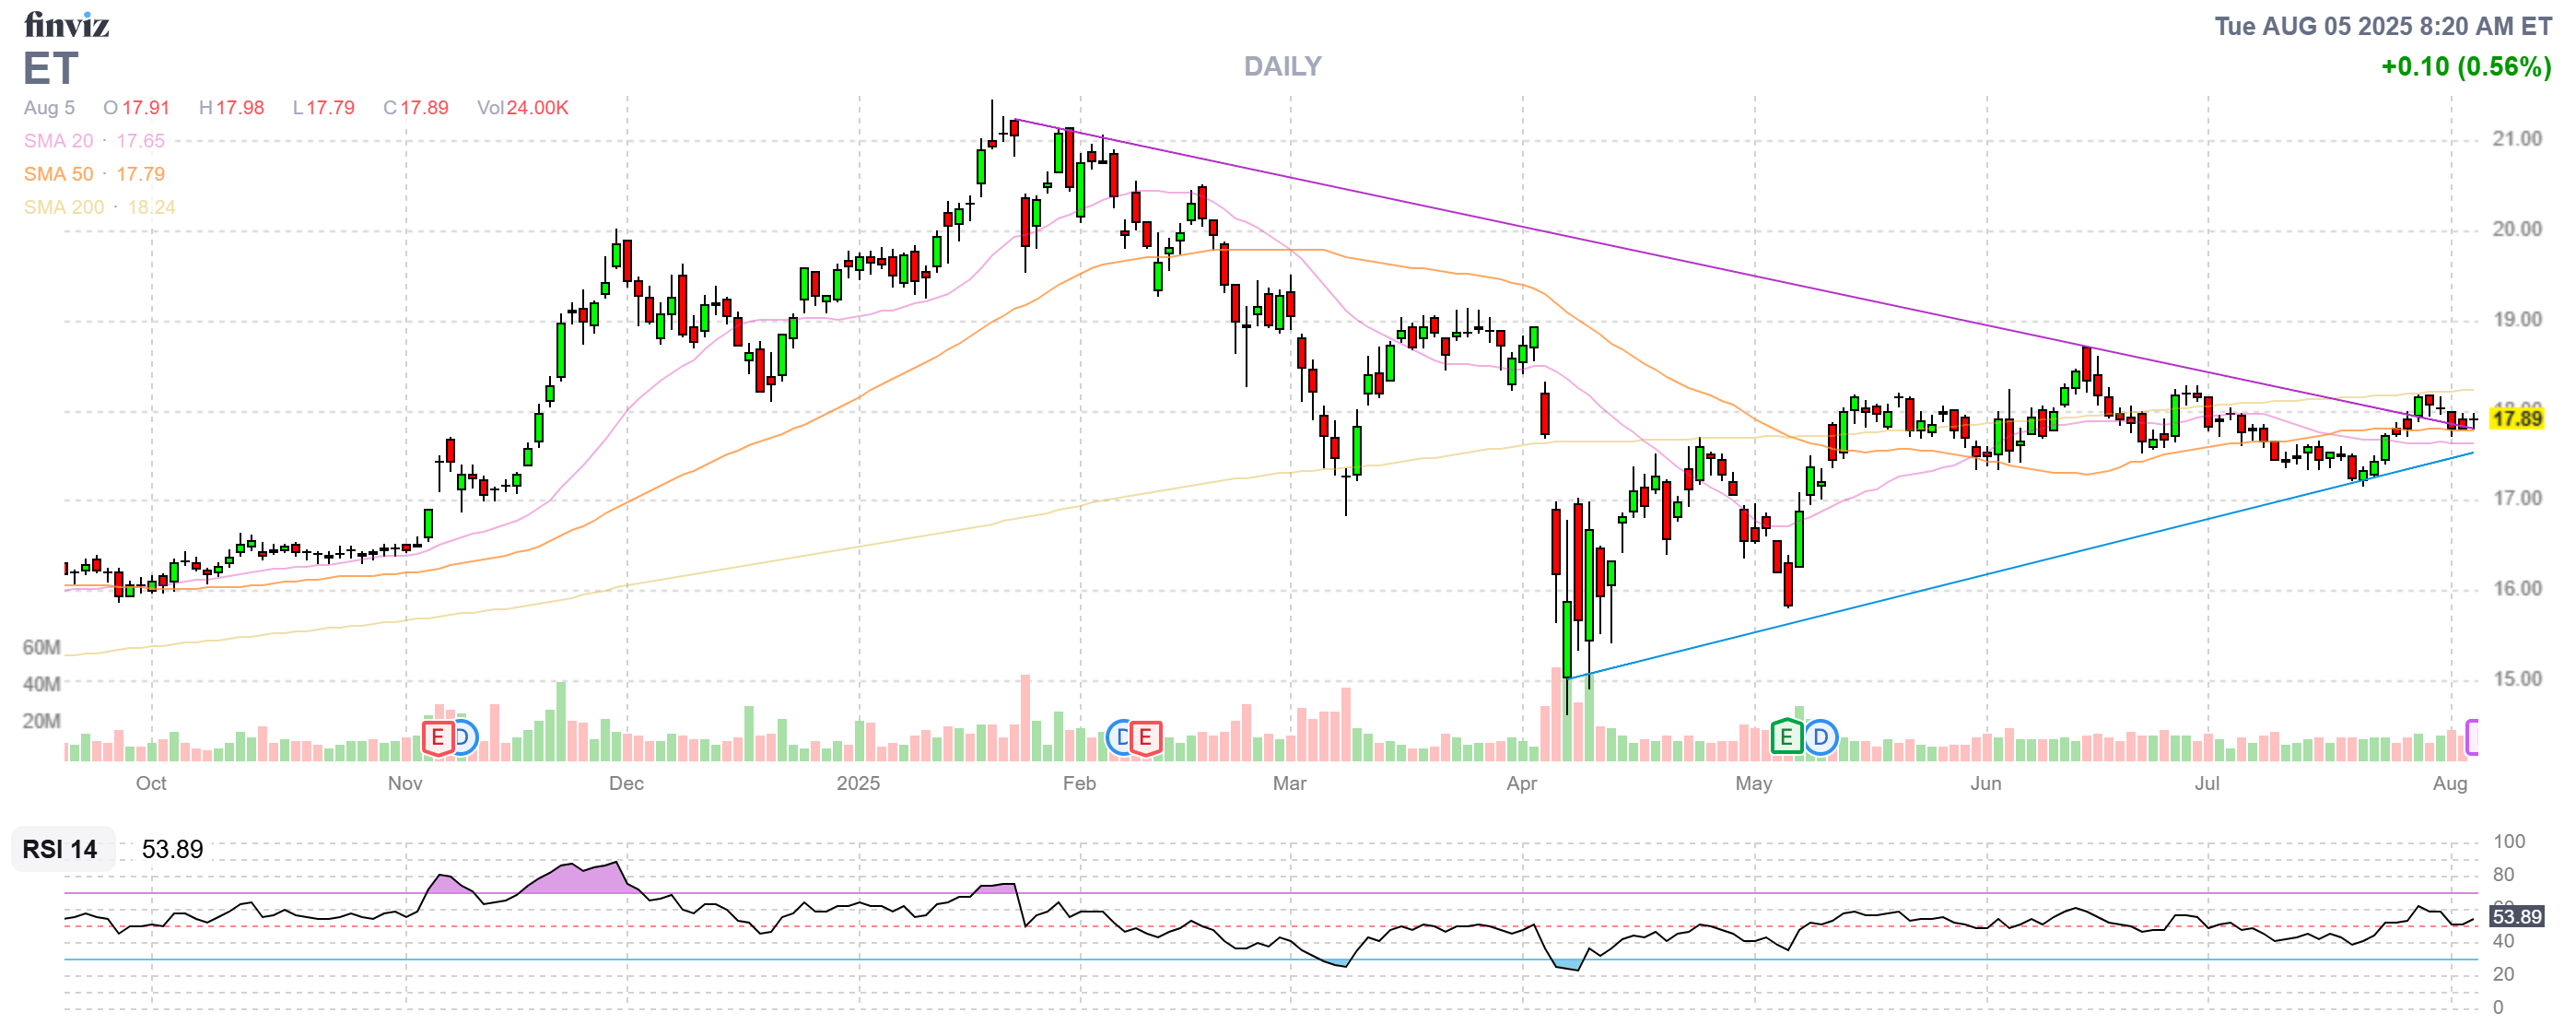
- ET – Over our target already at net $2,925 on the $4,000 spread so this one has $1,075 (36.7%) upside potential in 16 months AND it’s already in the money. Aren’t options fun?
-
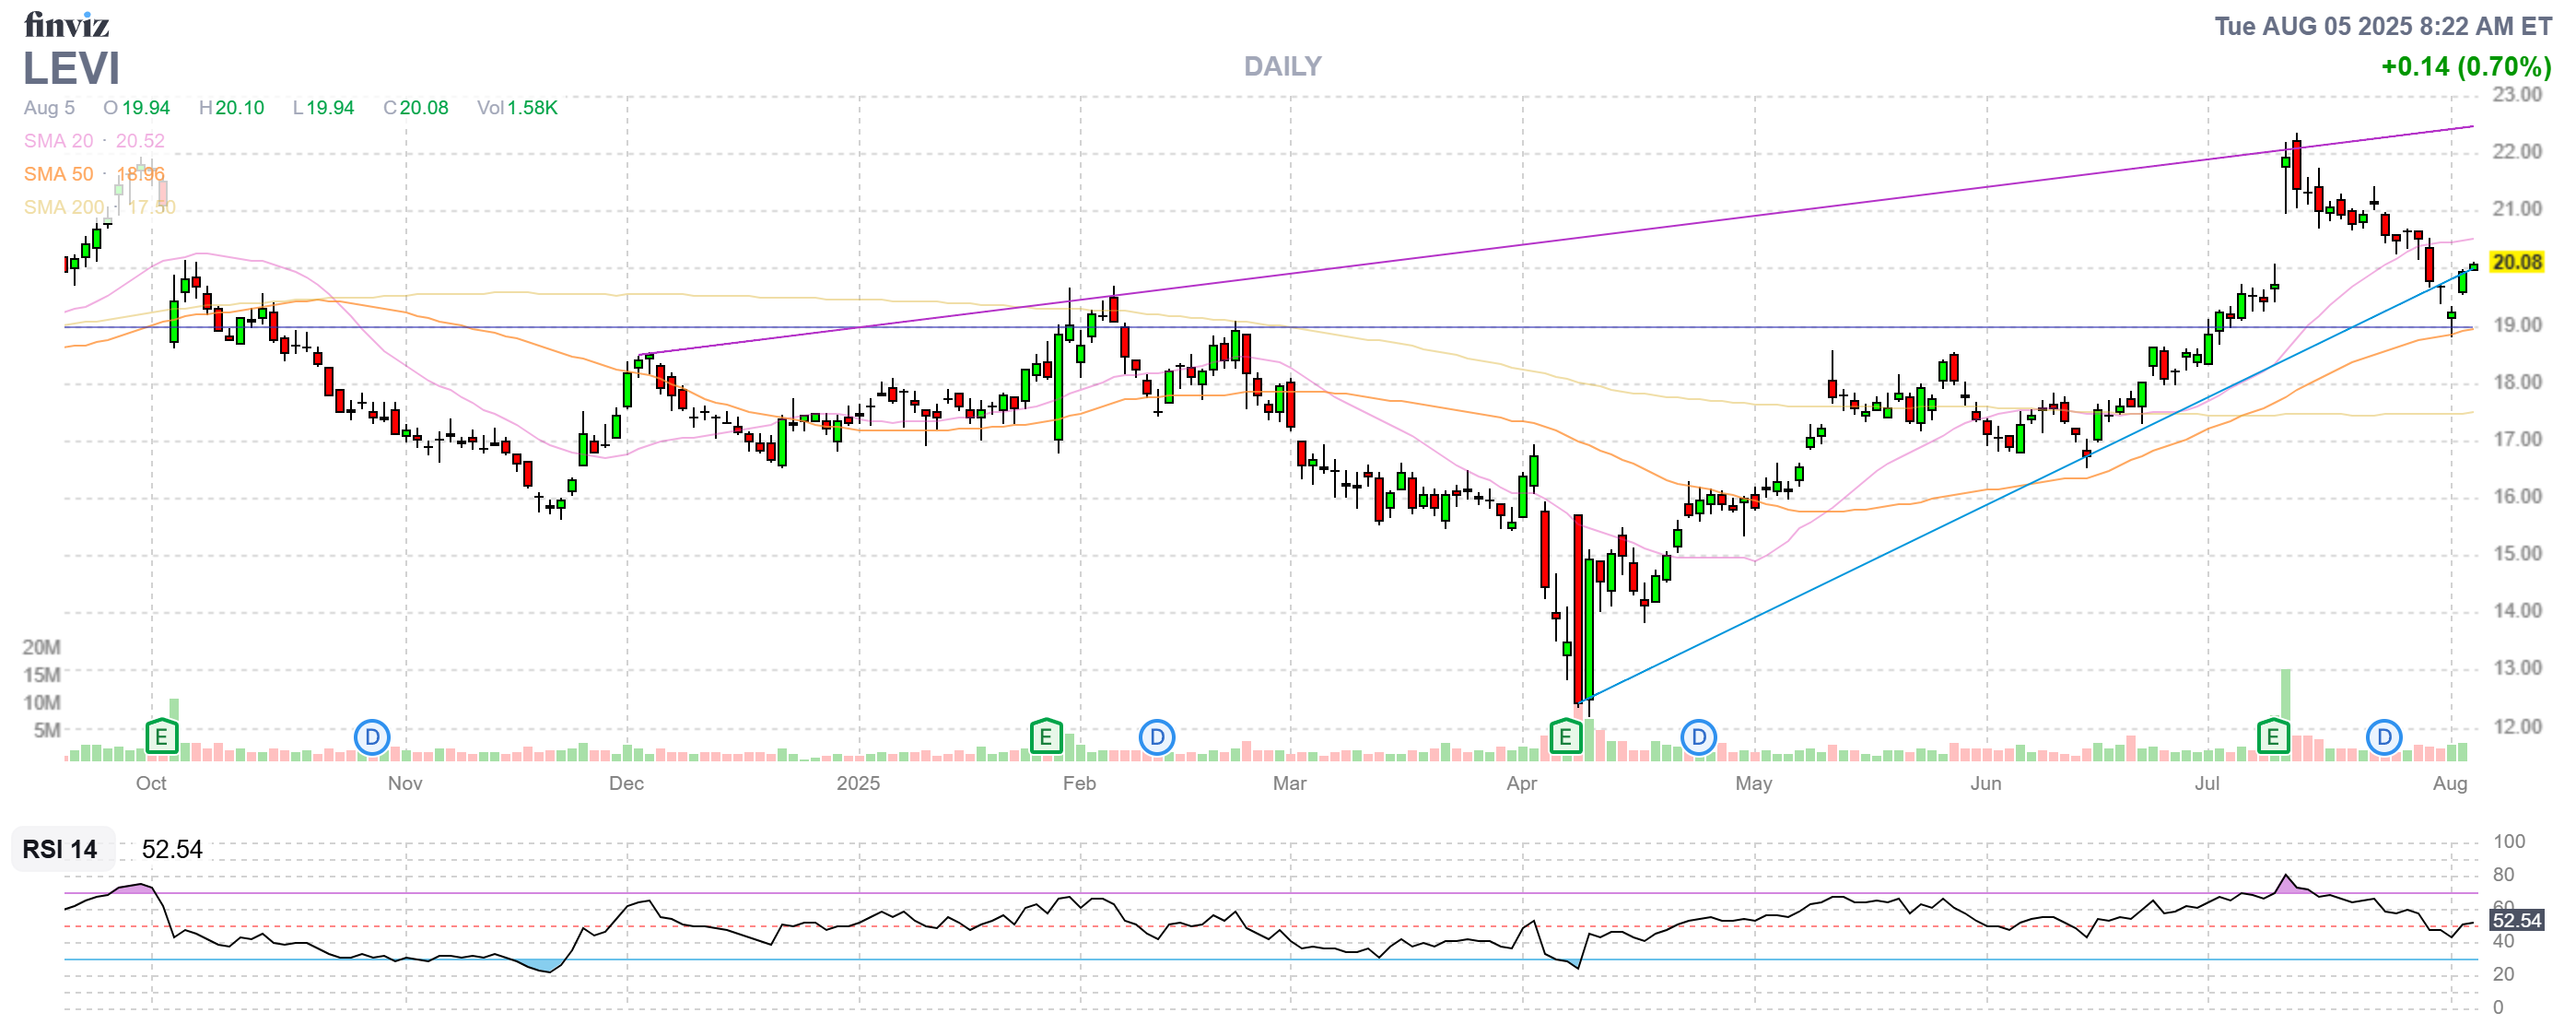
- LEVI (2) – Also in the money already at net $6,600 on the $10,500 spreads with $3,900 (59%) upside potential if LEVI can hold $20. Again – FUN!!!
-
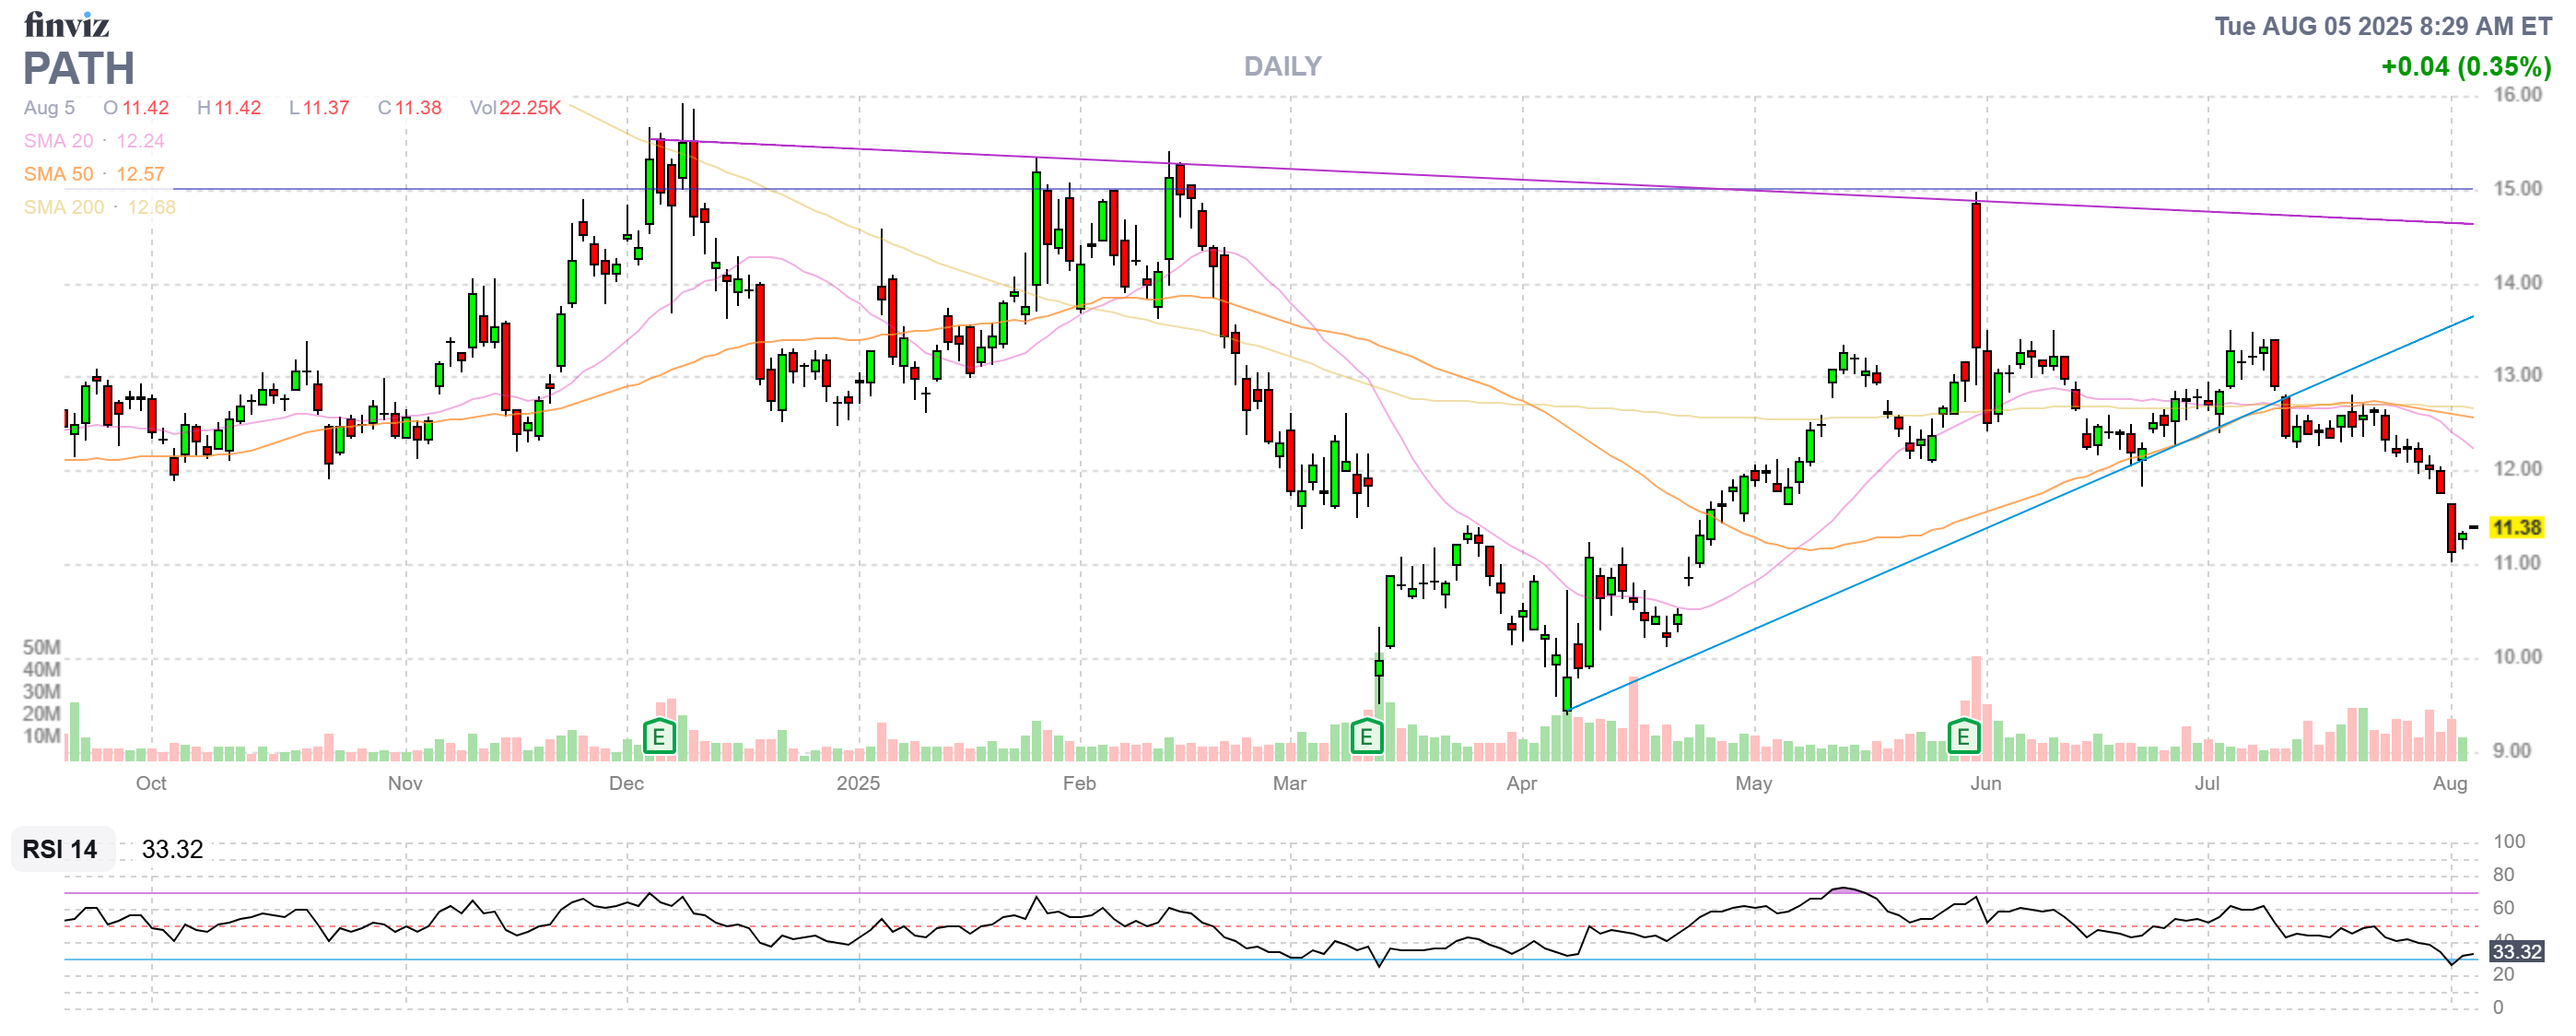
- PATH – Hopefully they don’t blow earnings because they are trading like they will but let’s say “on track” for now at net $1,855 on the $5,000 spread so $3,145 (169%) upside potential – HOPEFULLY!
-
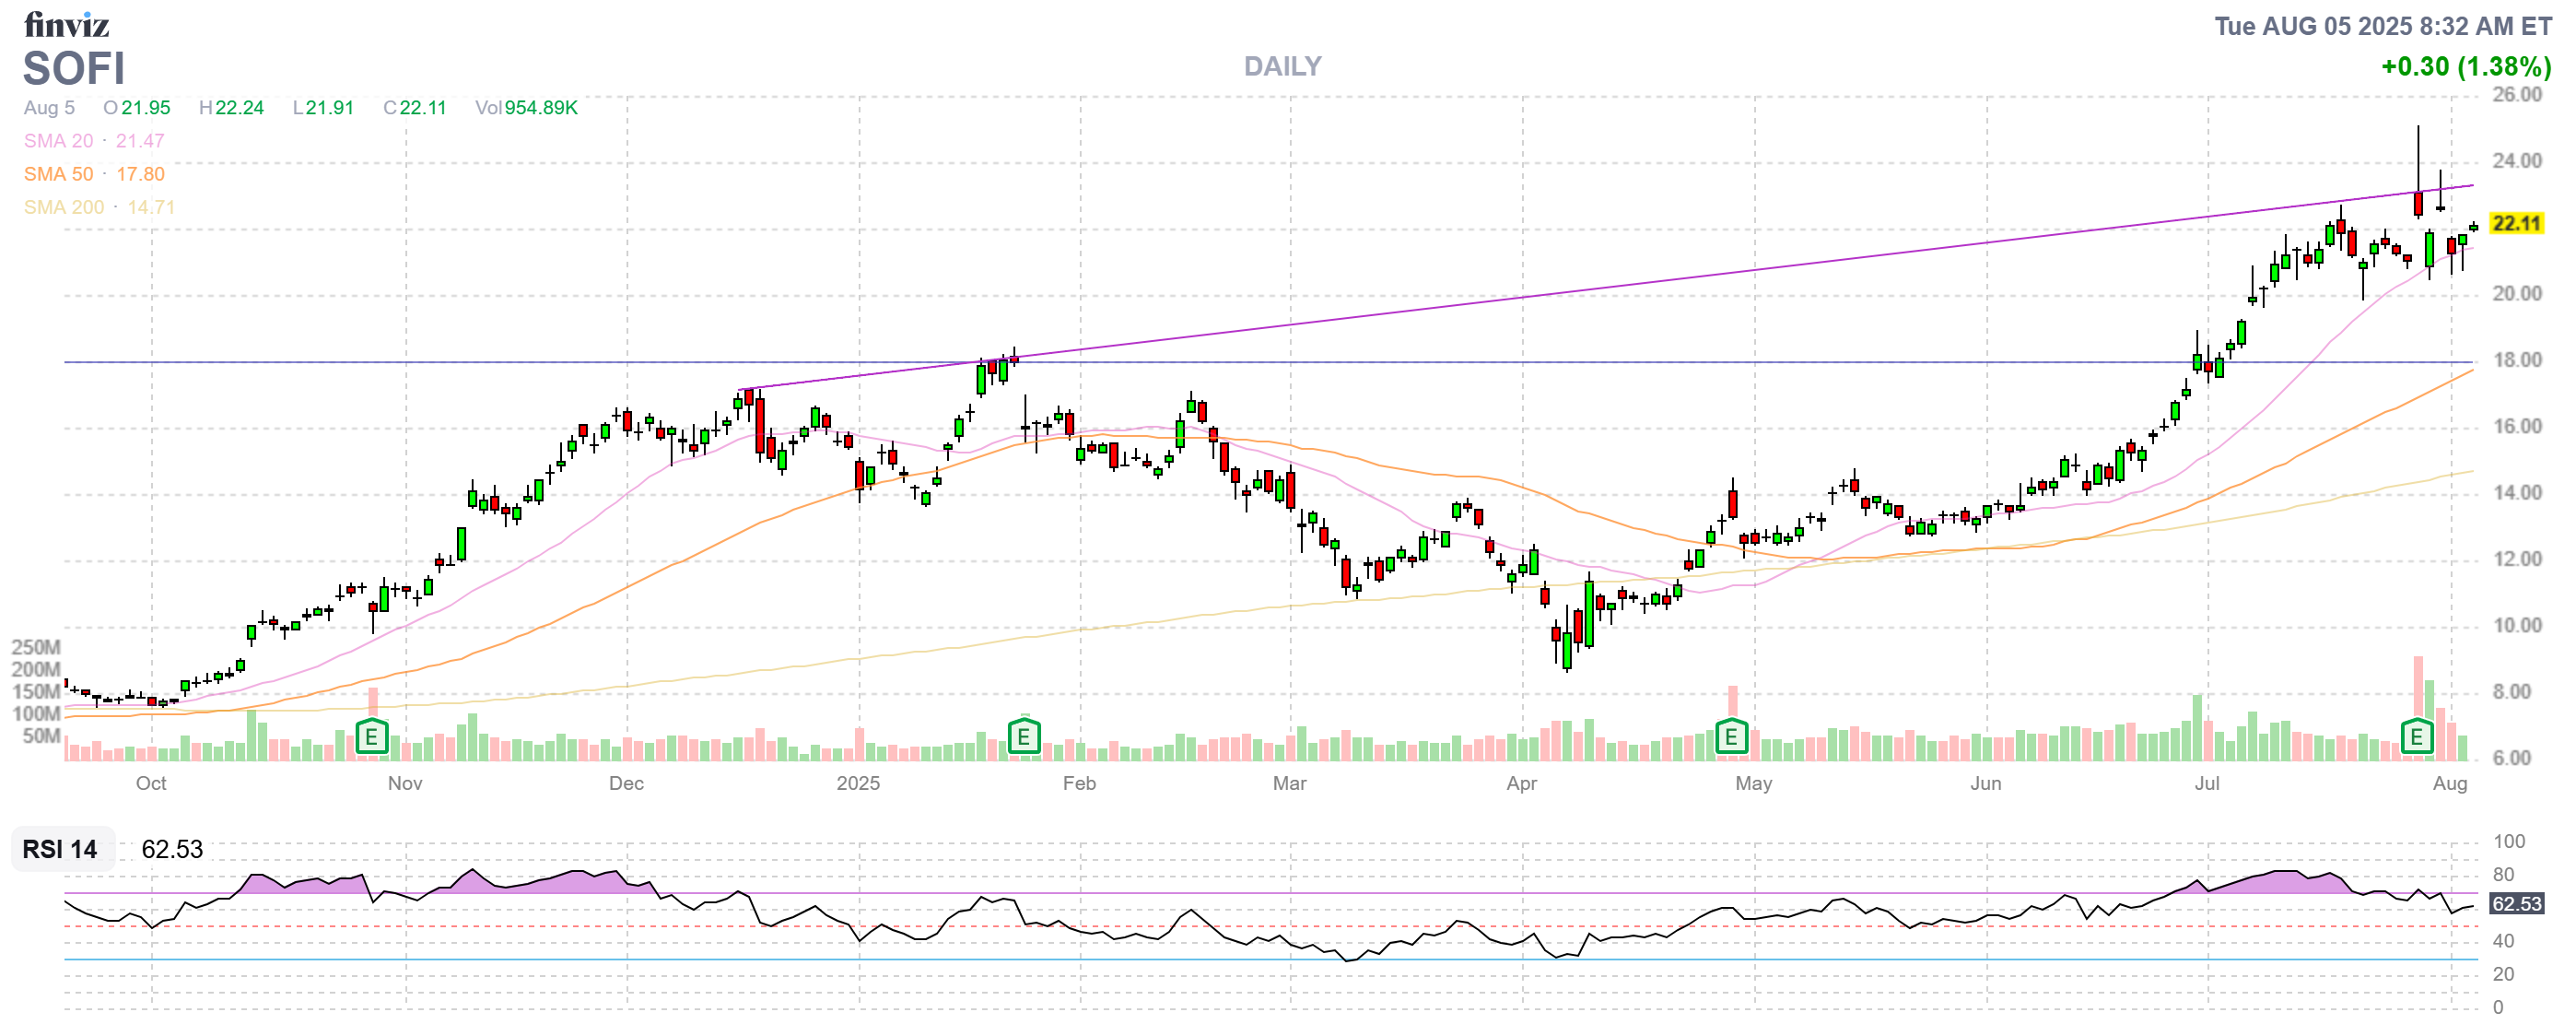
- SOFI – At our goal already at net $6,825 on the $12,000 spread with a fantastic $5,175 (75.8%) upside potential in 16 months if we can simply hold $22 – looks like EZ money to me!
-
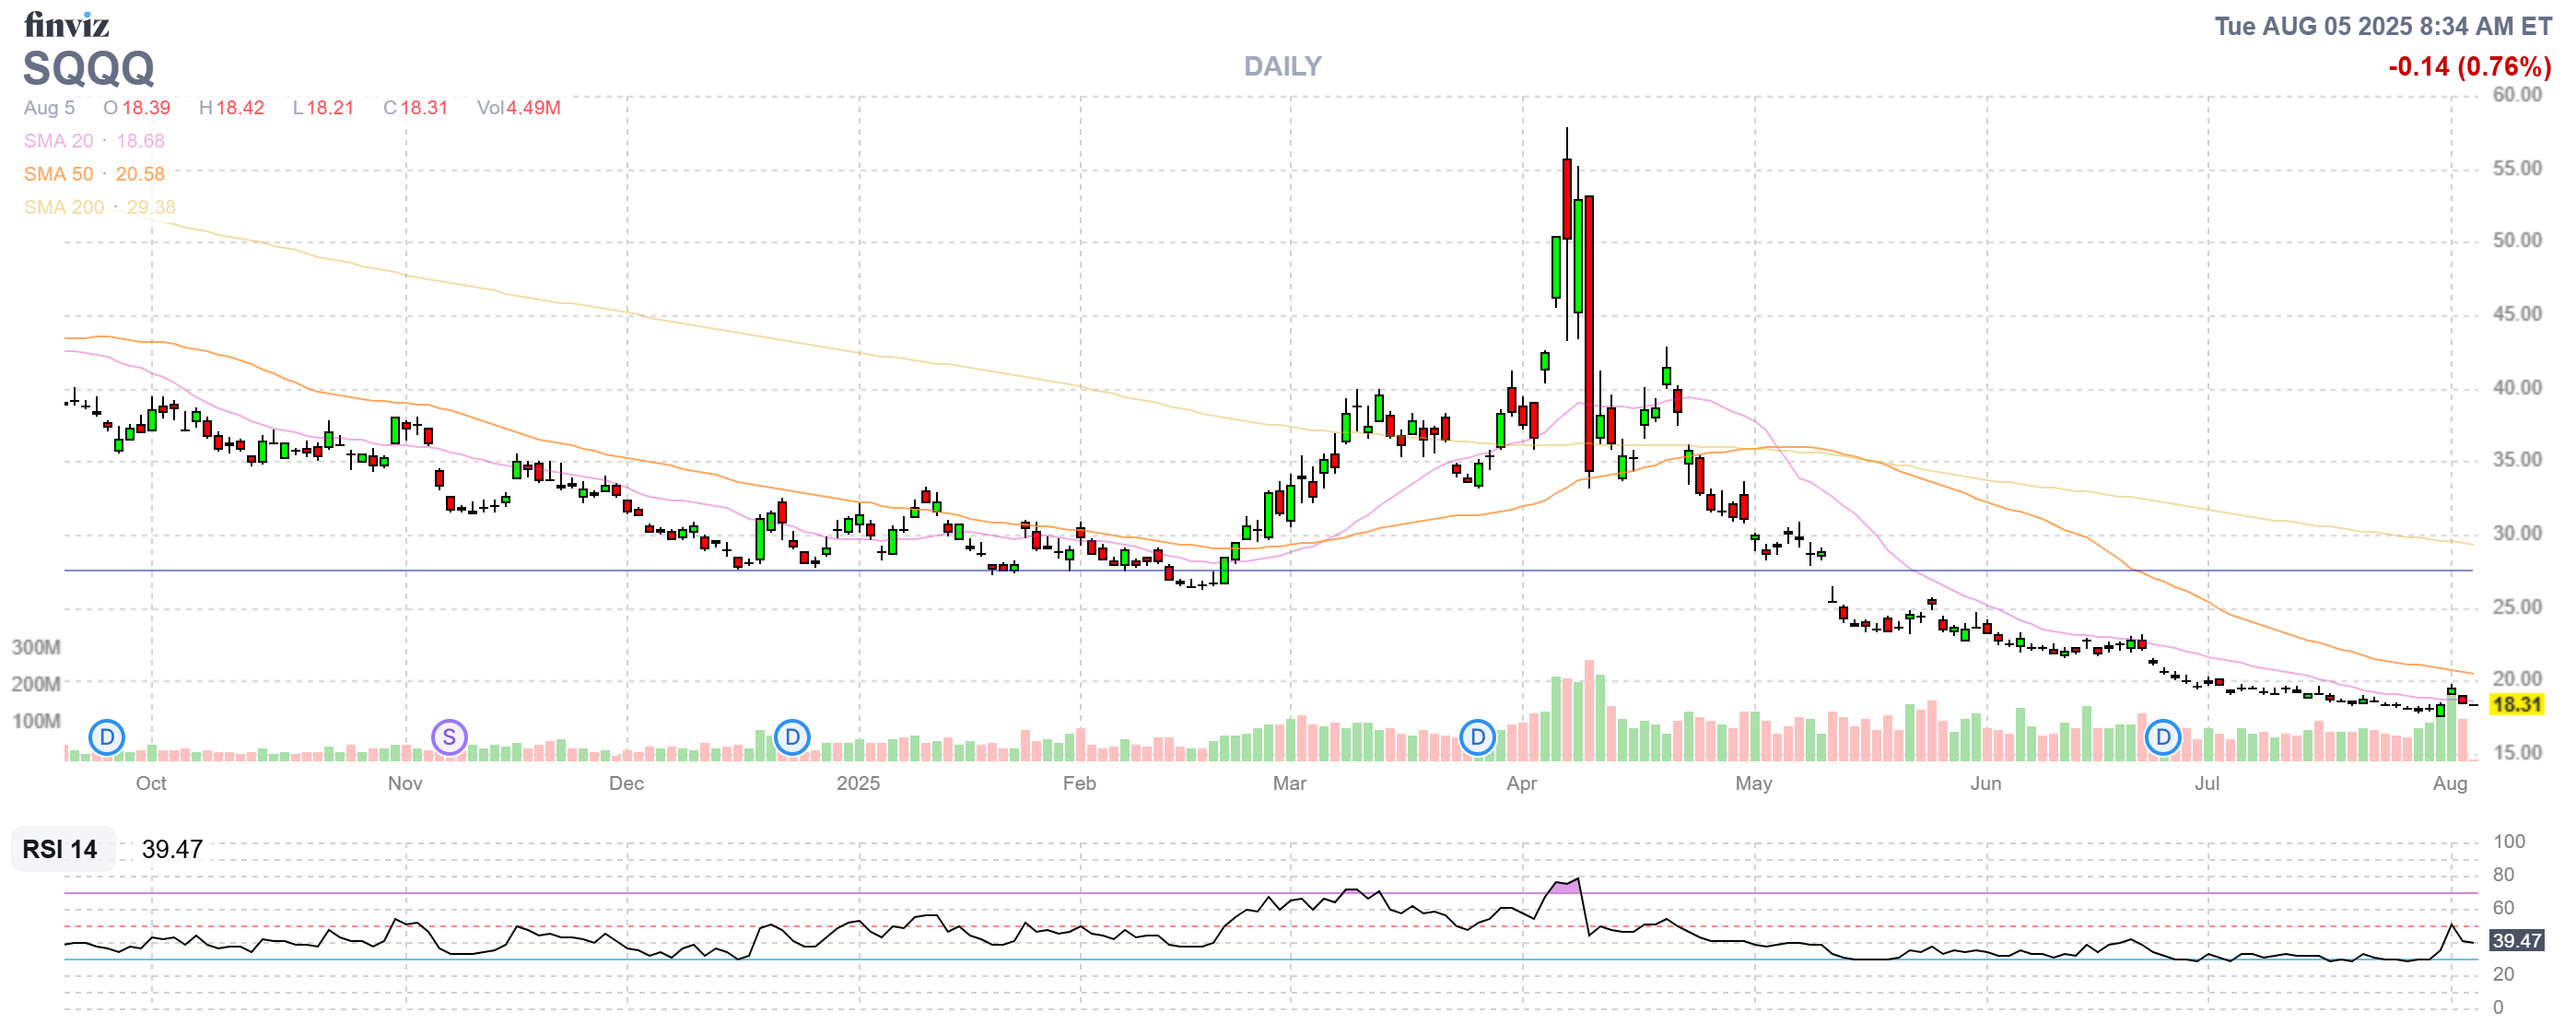
- SQQQ – Still good for a new hedge at net $3,050 on the $15,000 spread so there’s $11,950 of downside protection in this hedge.
-
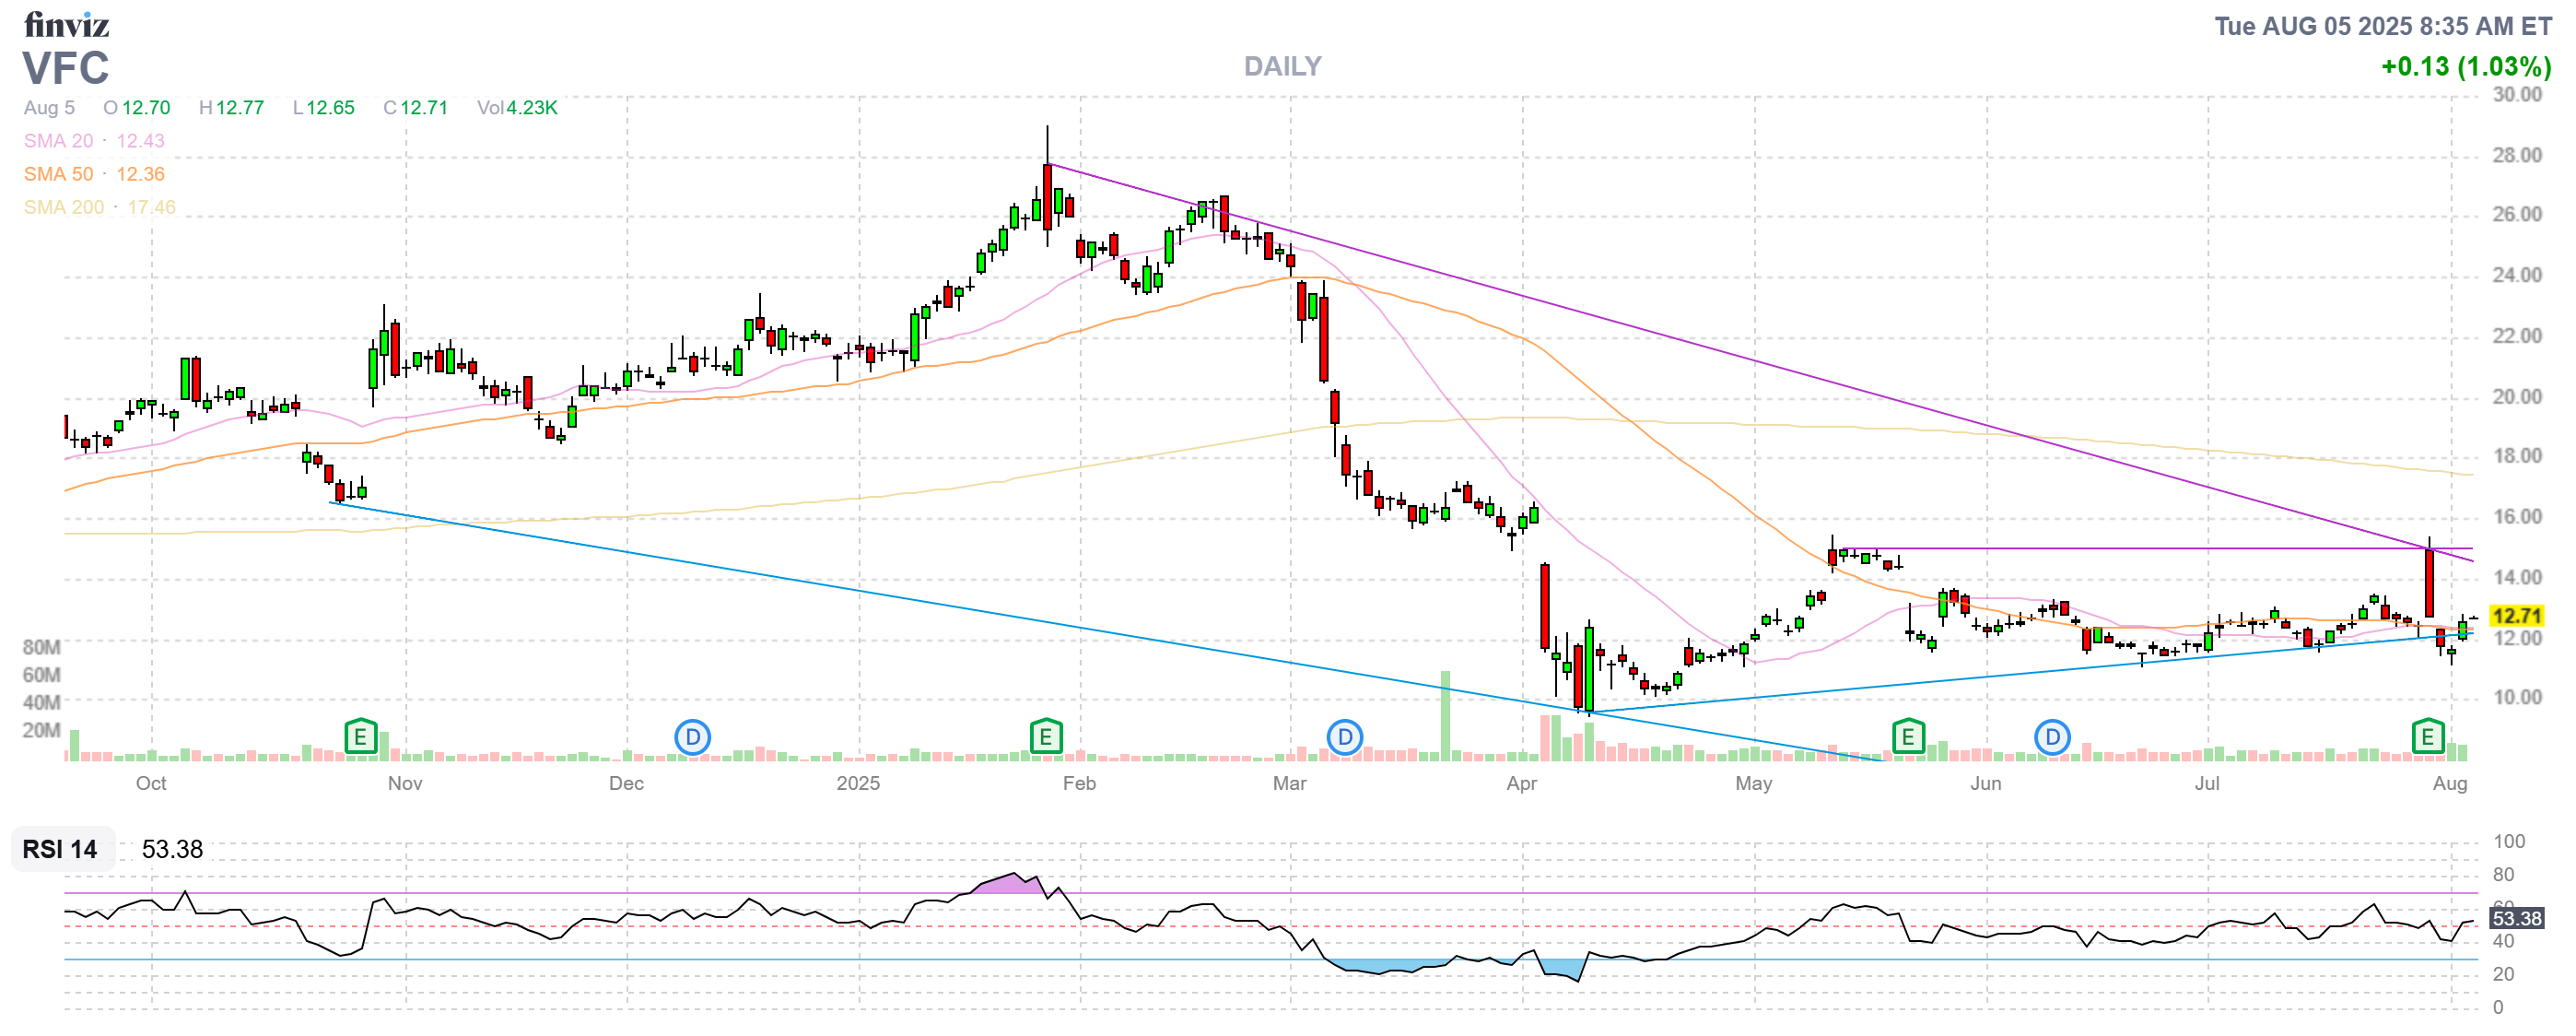
- VFC – We’ve got 16 months and I think we can make $20. Earnings were just good. We’re at net $1,380 on the $5,000 spread with $3,620 (262%) upside potential.
-
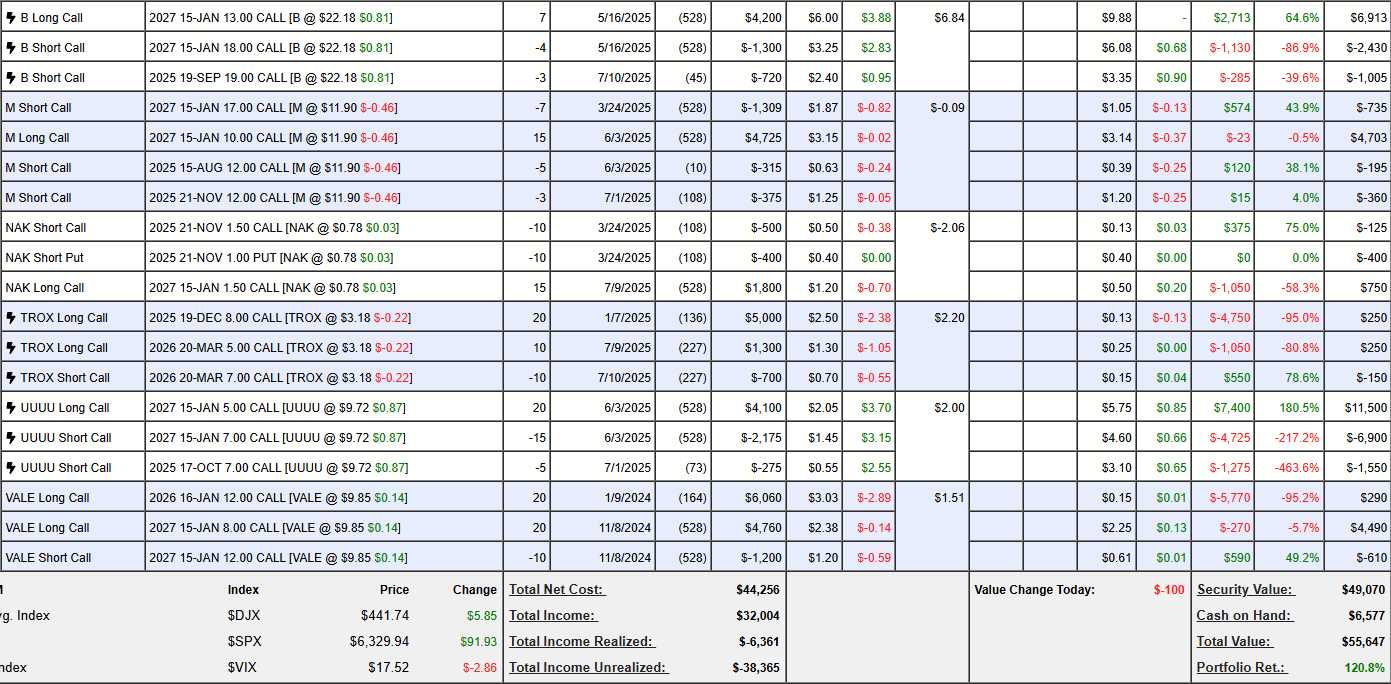
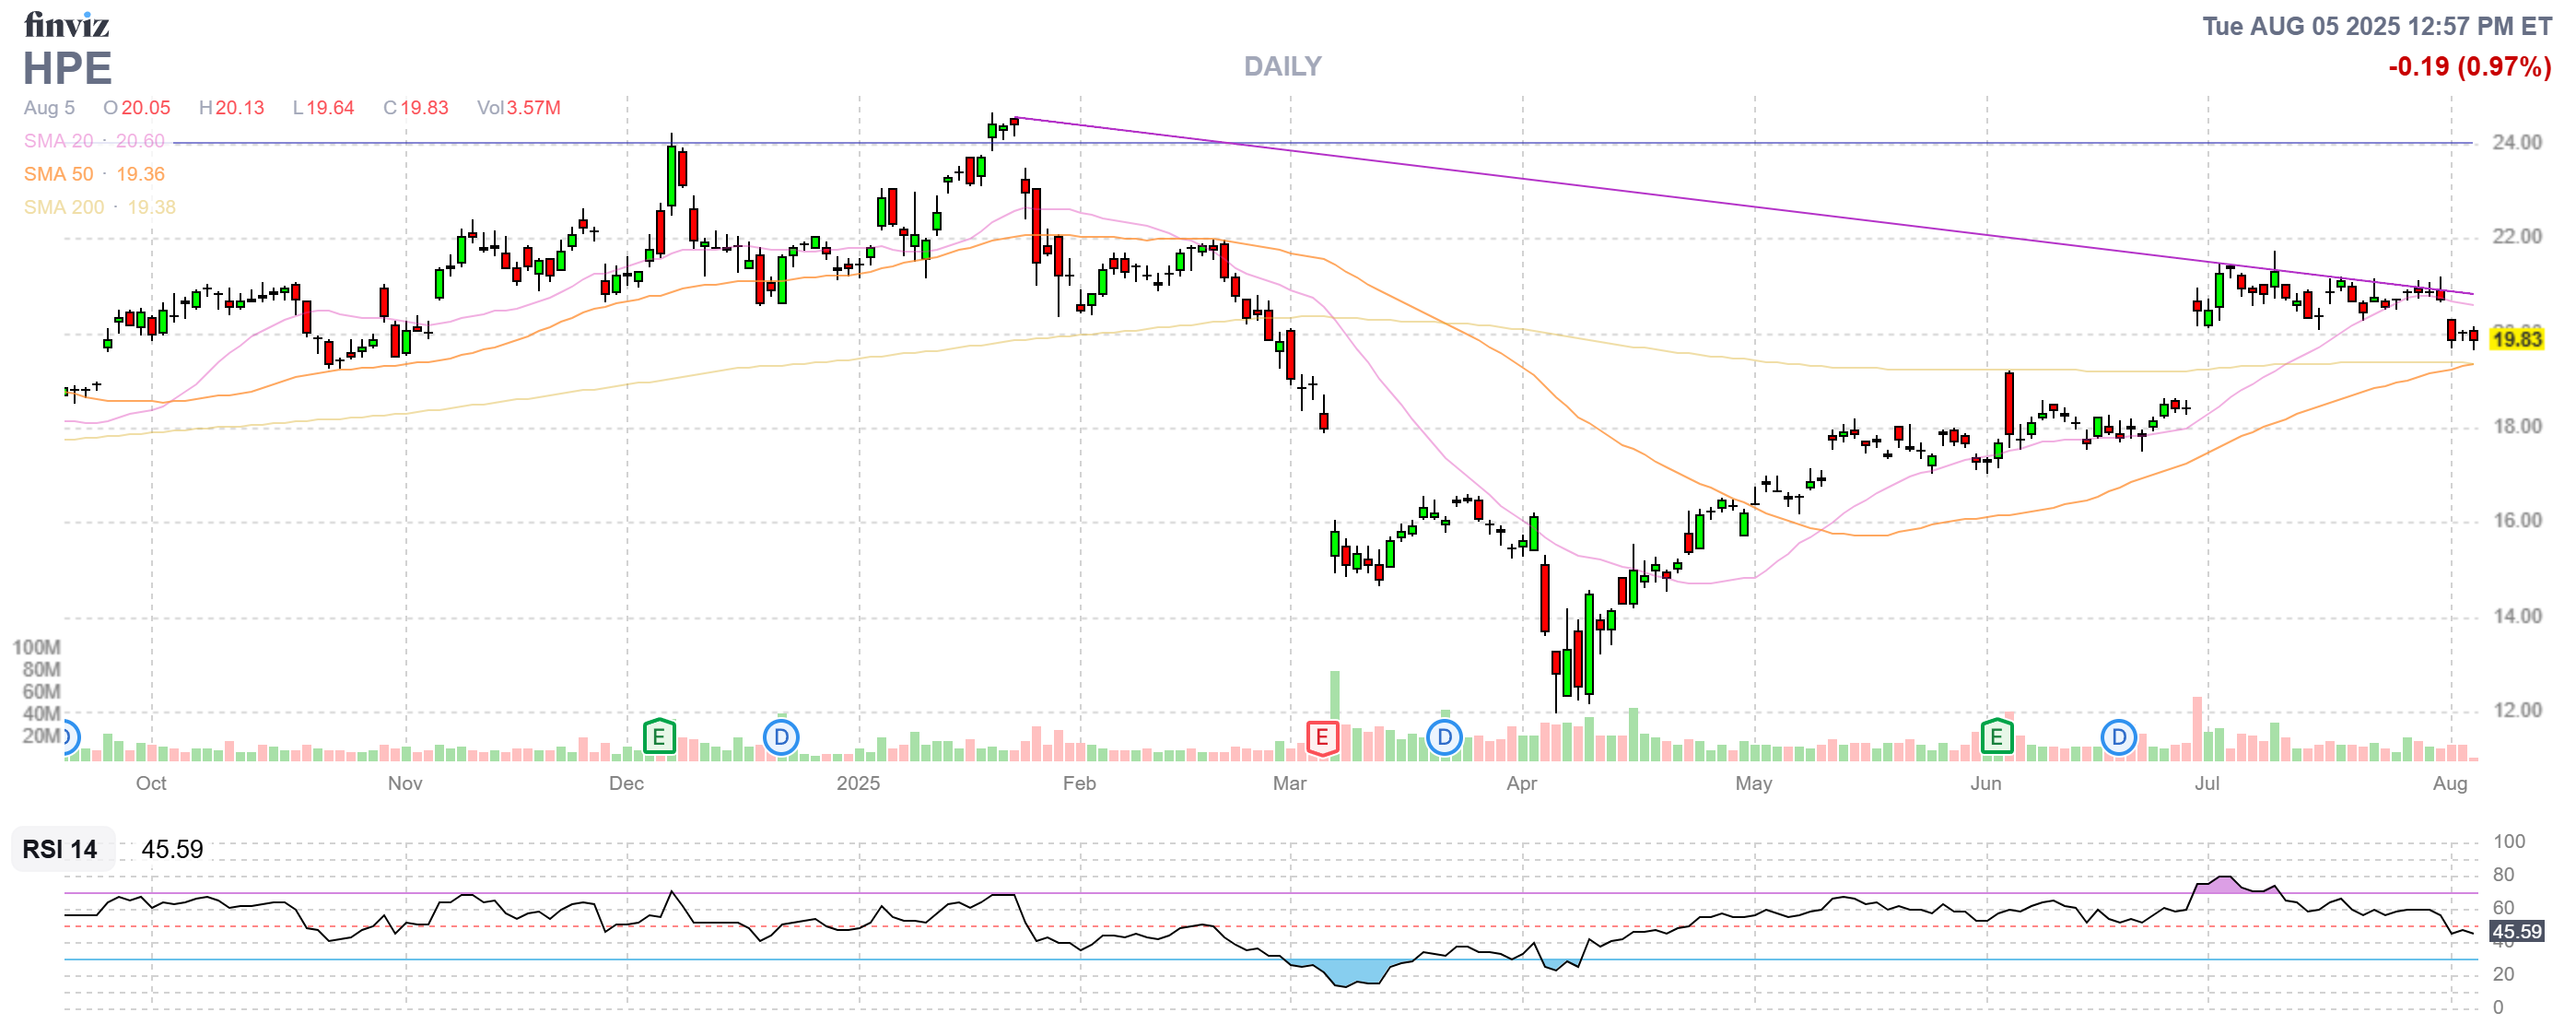
- HPE – Way past our target at net $3,425 on the time-dialated spread. The short calls are $3,000 in the money at $3,075 so no premium left so the question is how comfortable are we with $20 into Sept earnings? Traders often forget that in-the-money short calls are also a hedge against their long gains. Nov $19s are $2.10 and I don’t mind paying $1 ($1,000) to roll up $2 in strike – so let’s do that. The brings our net to $4,425 with only $575 (13%) upside potential but that’s only until November (108 days) and we’ll keep rolling – so I’m fine with it. 4 more $575s is $2,300 more upside potential and that’s 51.9% next year!
-
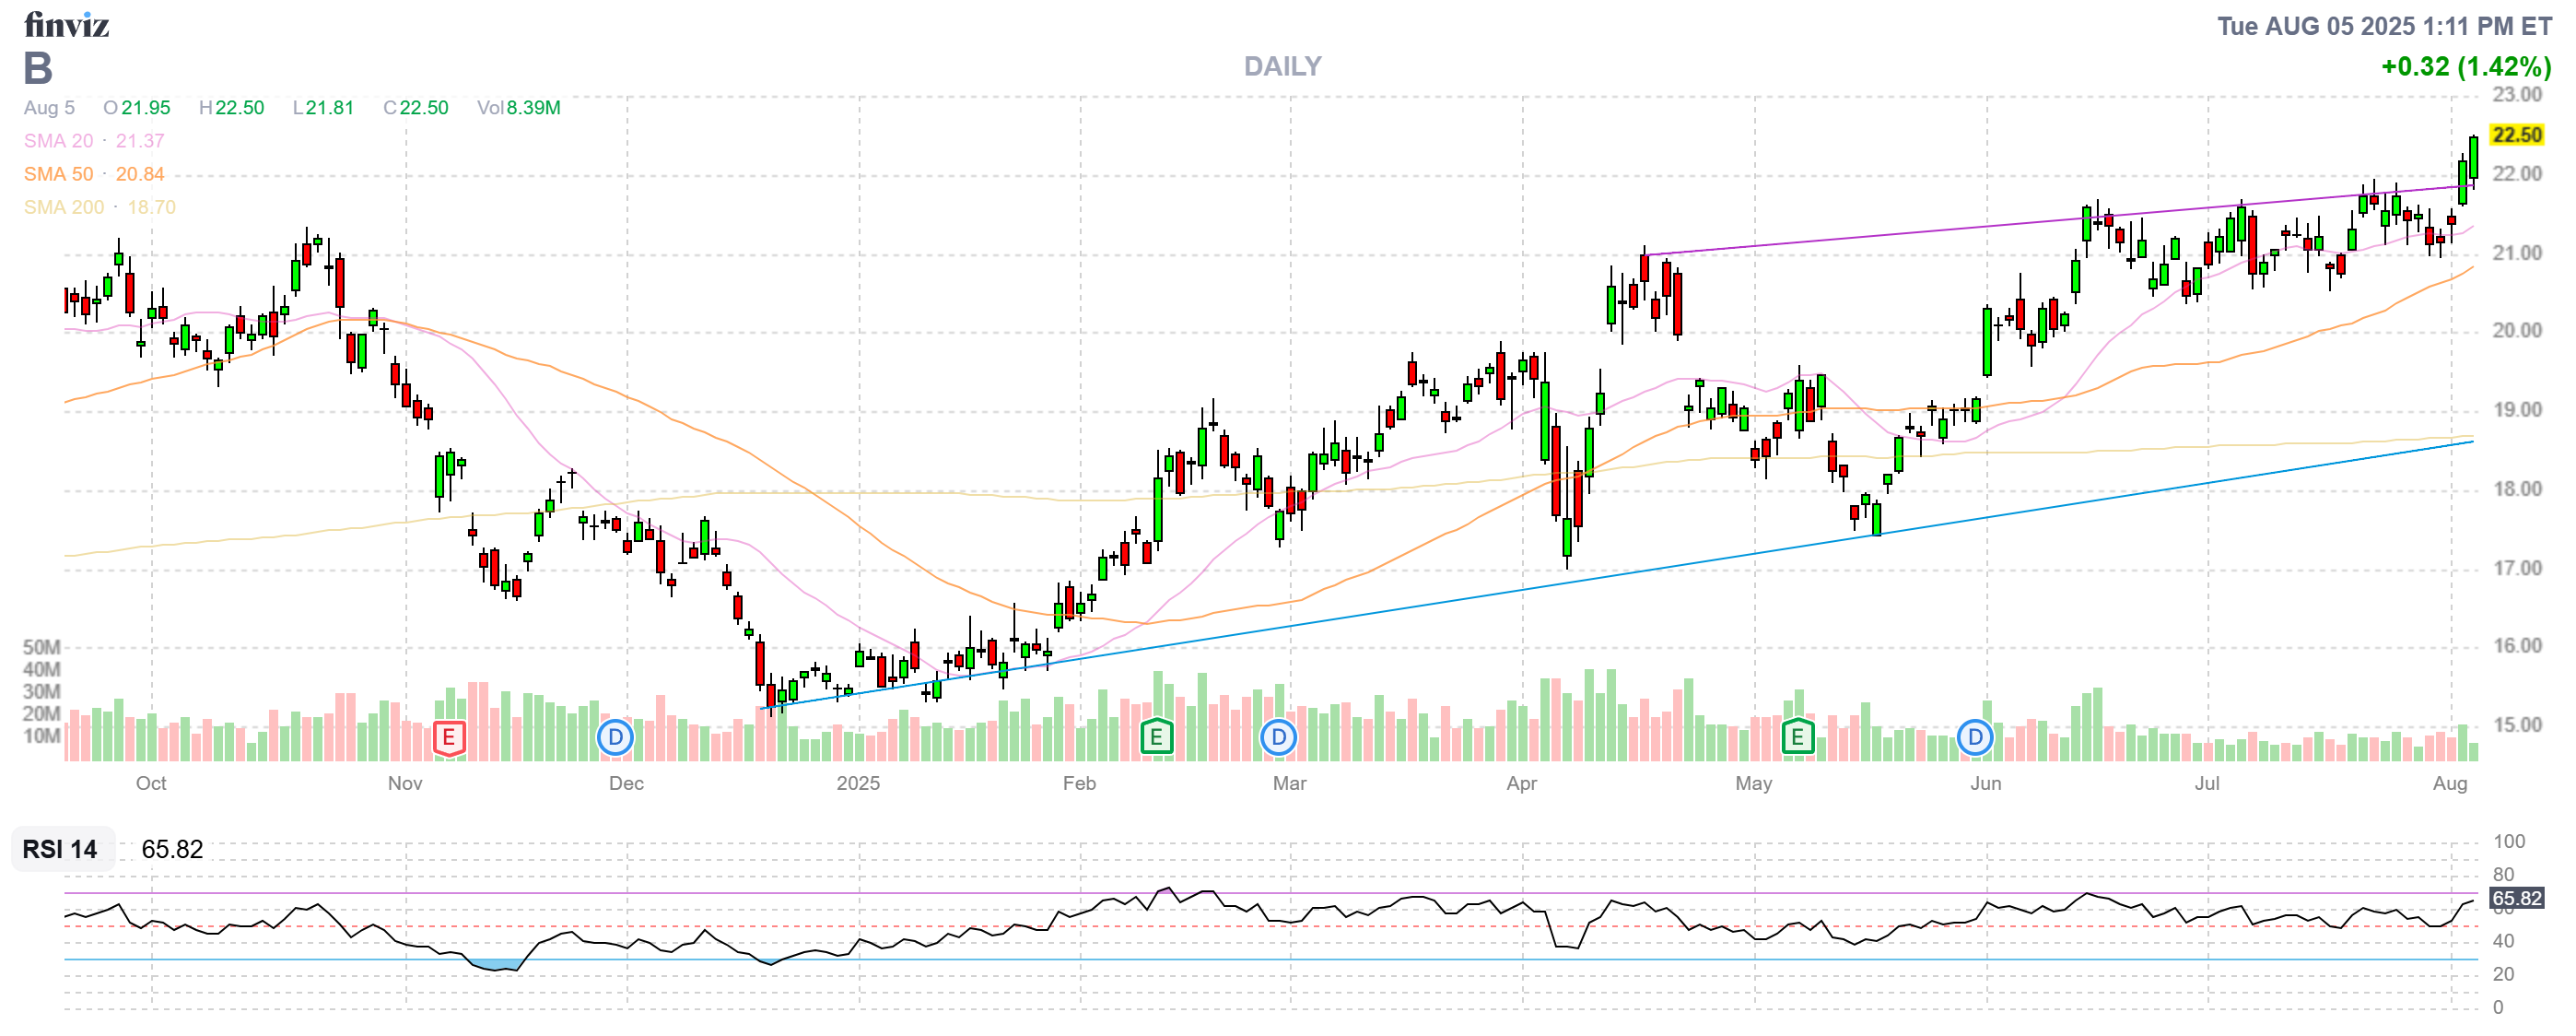
- B – Another tricky time-stretched play but these are fun AND profitable. In this case, B popped on us and the short Sept calls are $3.18 in the money at $3.35 and the Jan $20s are $3.50 so for sure let’s do that roll for free! That puts us at net $3,478 and the 2027 $25s are $3 so let’s figure we end up there with 7 x $5 ($3,500) and 3 x 12 ($3,600) is $7,100 so there’s $3,622 (104%) left to gain on this simple spread that we bought for $2,180. Options are fun!!! Good for a new trade too as it’s already deep in the money and STILL pays 104%!
-
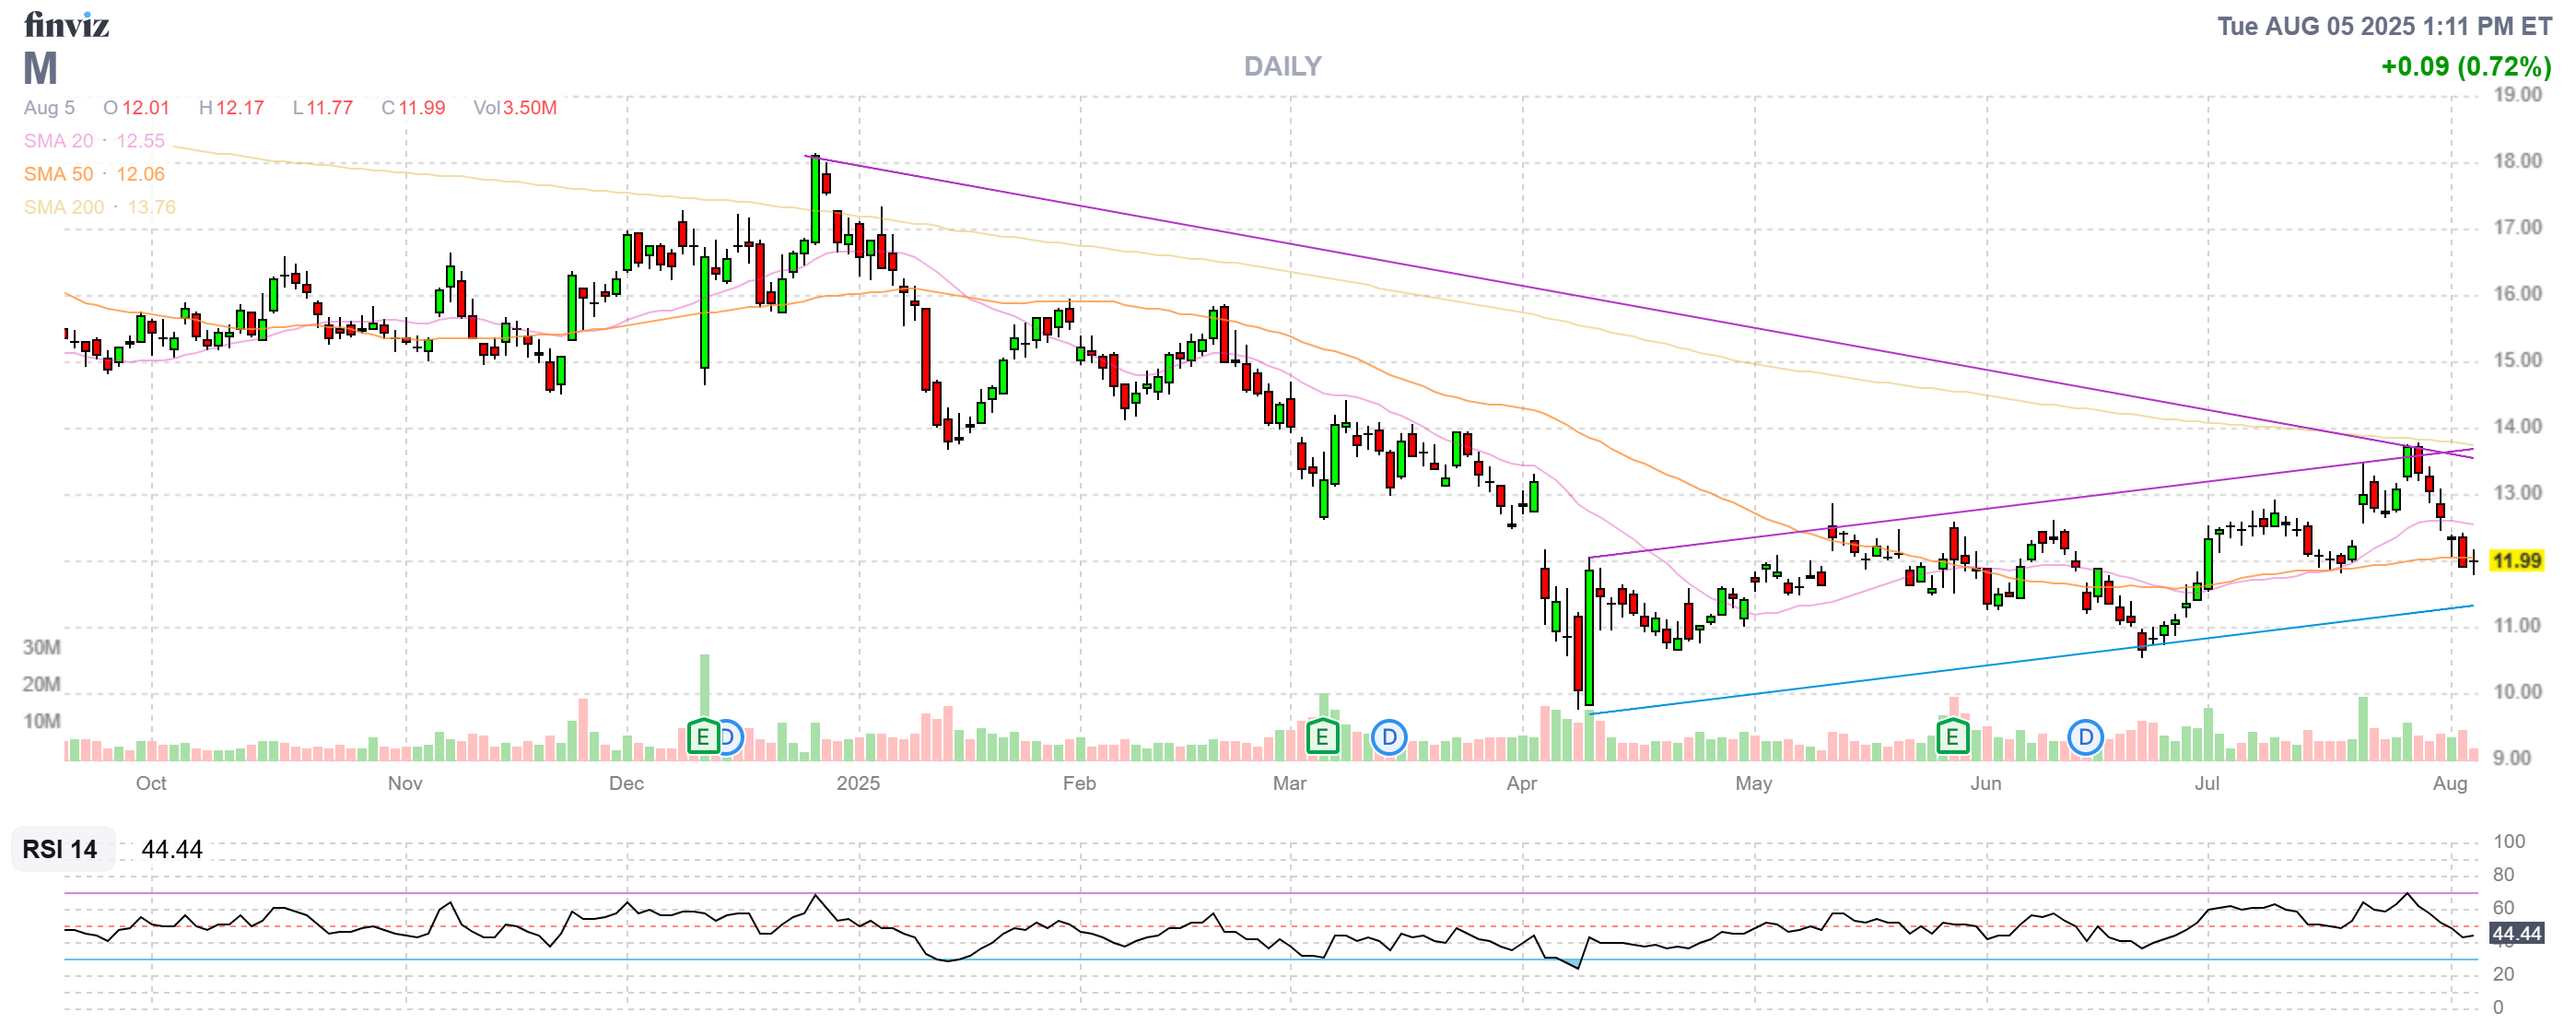
- M – Boy I started doing much more complex trades to make up for not having margin – how fun! So we are dead on track and I’ll be damned if I pay the short Aug callers 0.39 to get out early – we’ll have to wait. We’re at net $3,413 and, if we end up at $15, that’s $7,500 so let’s call it $4,087 (119%) of upside potential though we can do better than that if we keep nailing our short call targets. FUN!!!
-
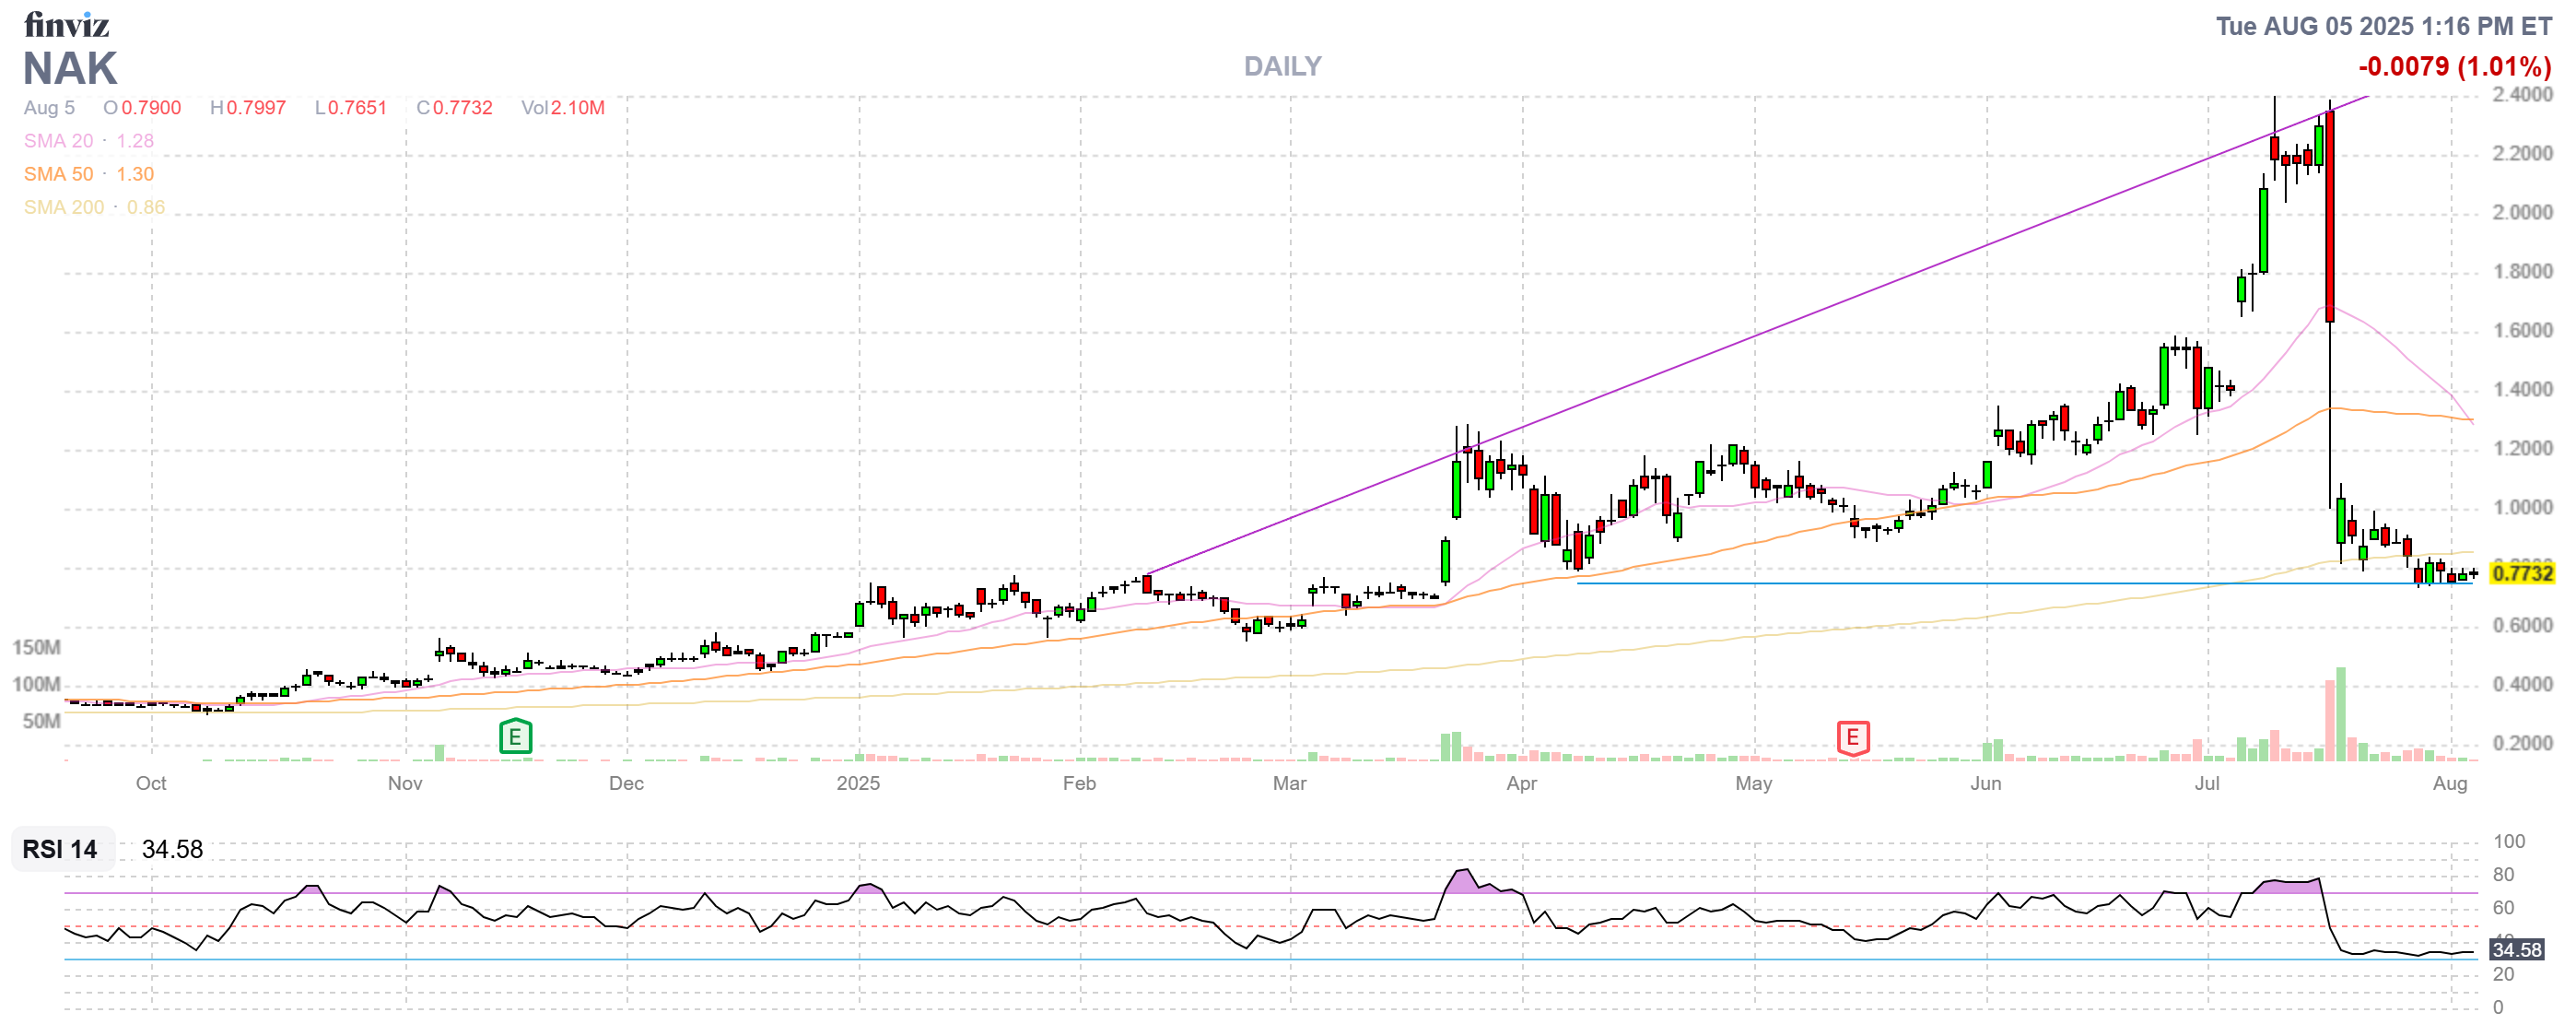
- NAK – Nailed it with our cash out at $2+! NEVER BE GREEDY! So now it’s back to where we started (more or less) and these are our only short puts as the margin is low enough not to worry about them. We need more information on what’s going on with their EPA issues so, at net $225 – I don’t even consider this to HAVE any upside potential – hopefully I’m wrong.
-
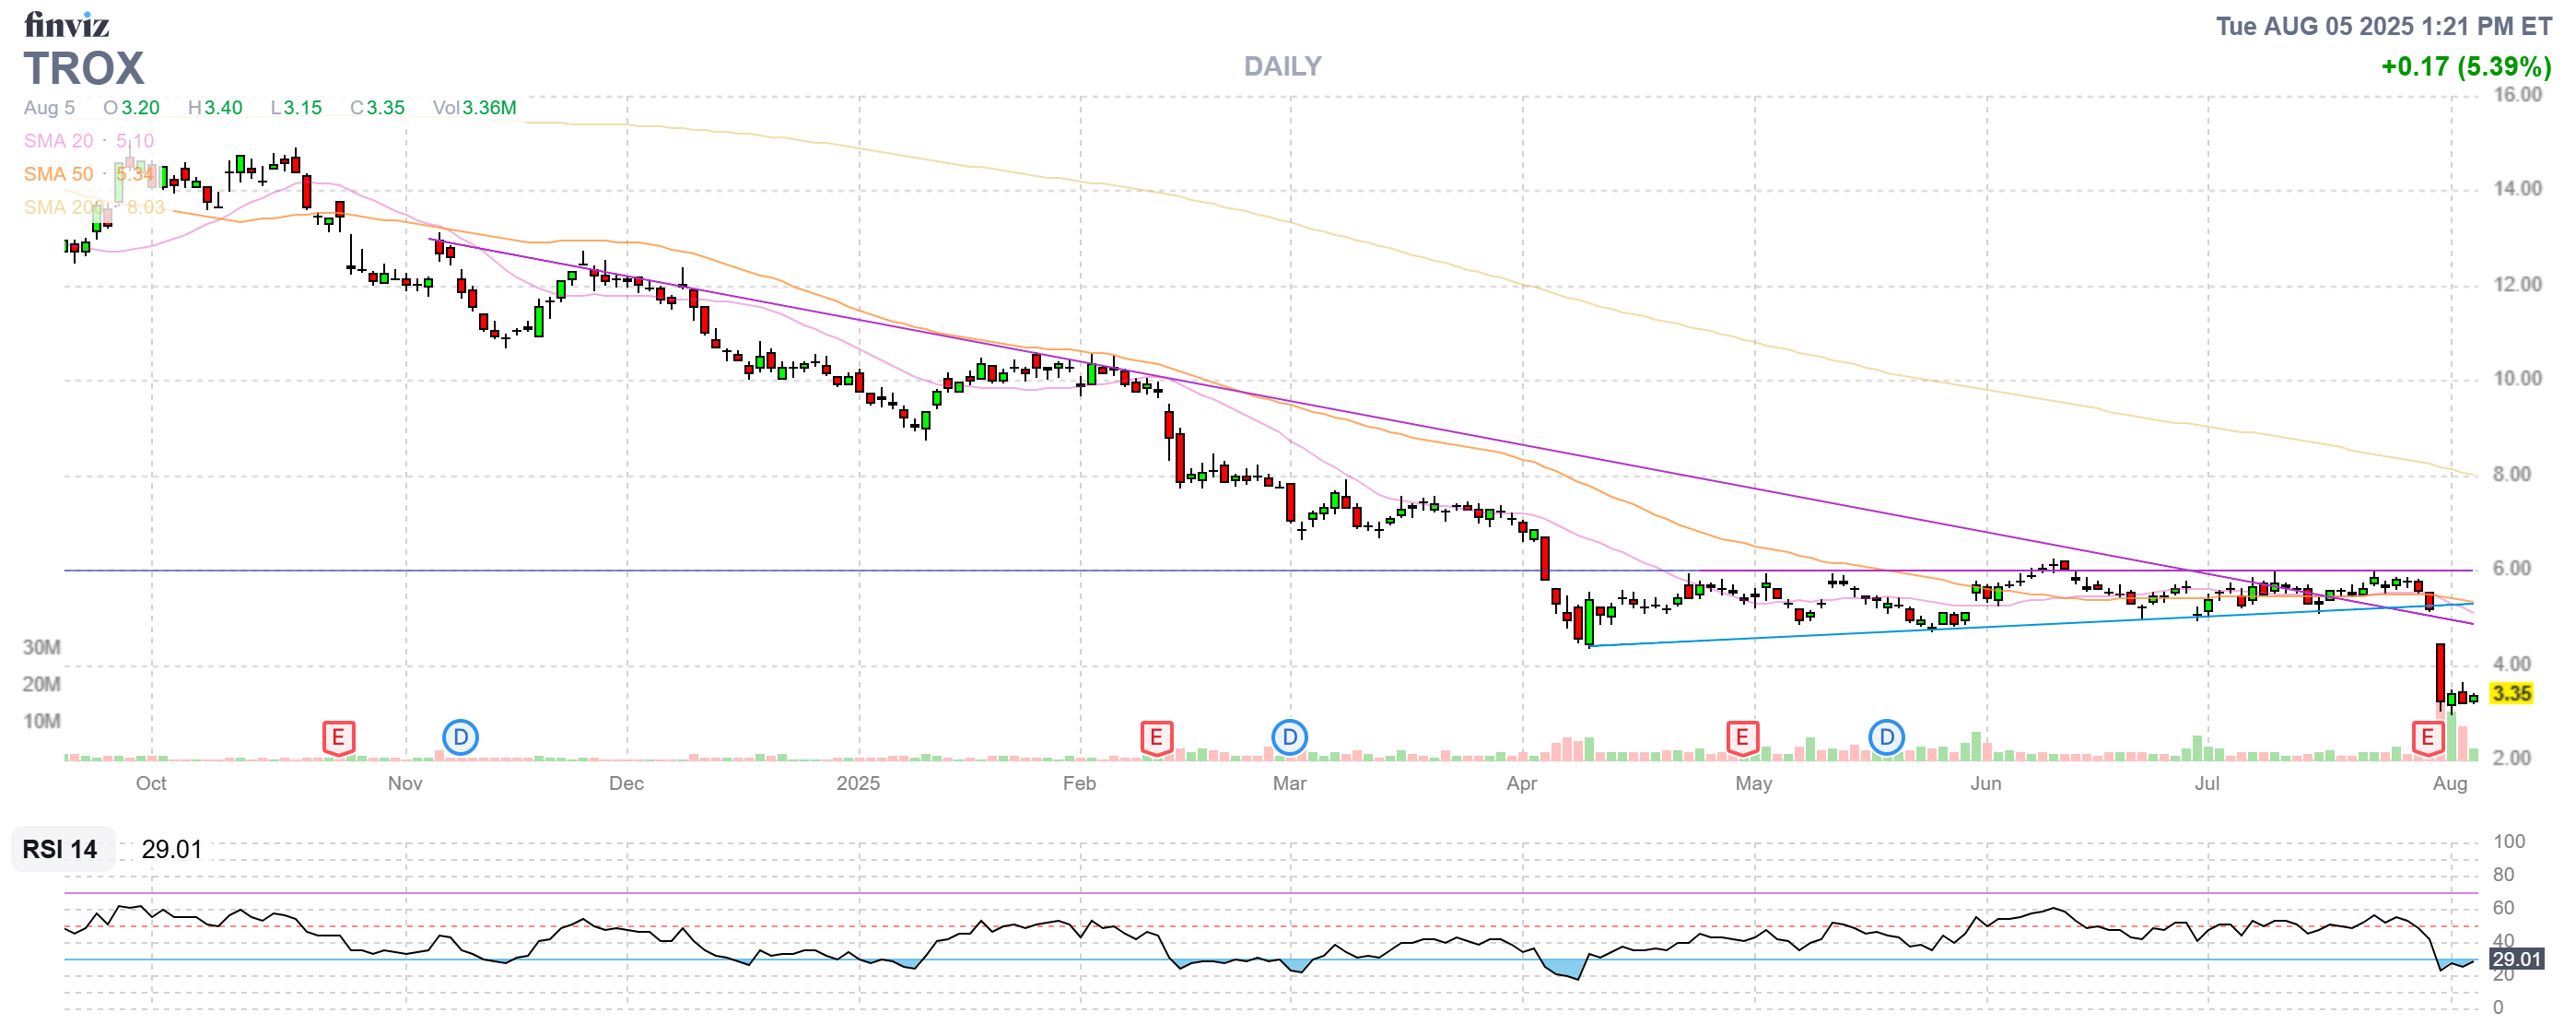
- TROX – The original Dec calls are a leftover wipe-out and the $5/7 spread is the newer trade but that’s not working either and earnings were NO help. I will probably put them in the LTP but it’s too speculative here so let’s take net $350 and RUN!
-
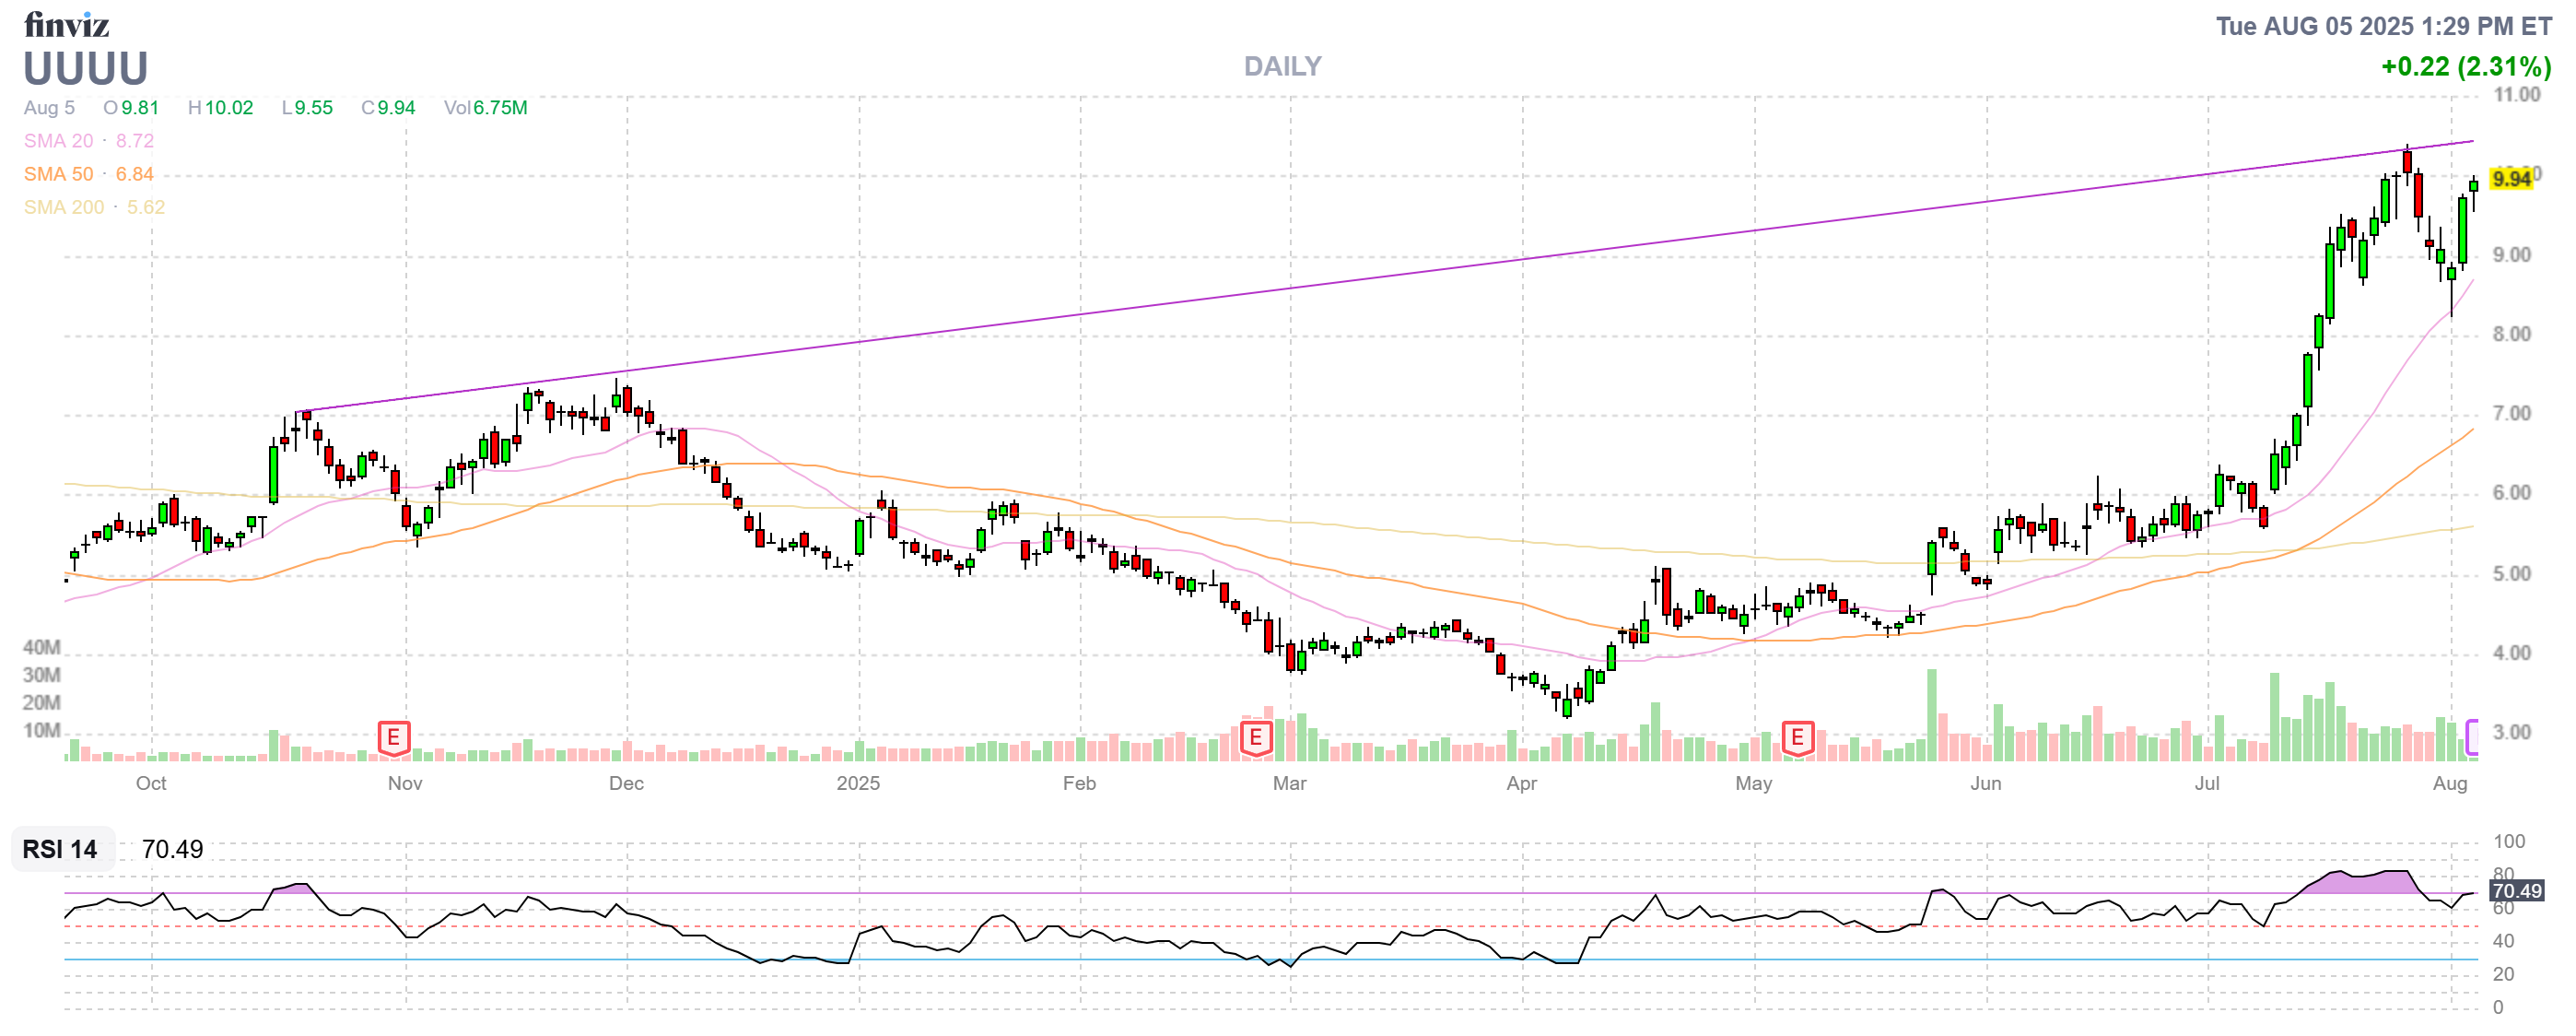
- UUUU – Another time spread and the Oct $7 calls are $2.72 in the money at $3.10. The 2027 $10 calls are $3.55 so we GAIN $225 rolling the Oct $7s and then we’d spend $1,650 rolling the 2027 $7s so net $1,425 to roll our spread $6,000 wider? That seems like a good investment, LET’S DO IT! So, our new net is $4,475 on the $10,000 spread and we have $5,525 (123%) upside potential at $10 in 16 months – I like it!
-
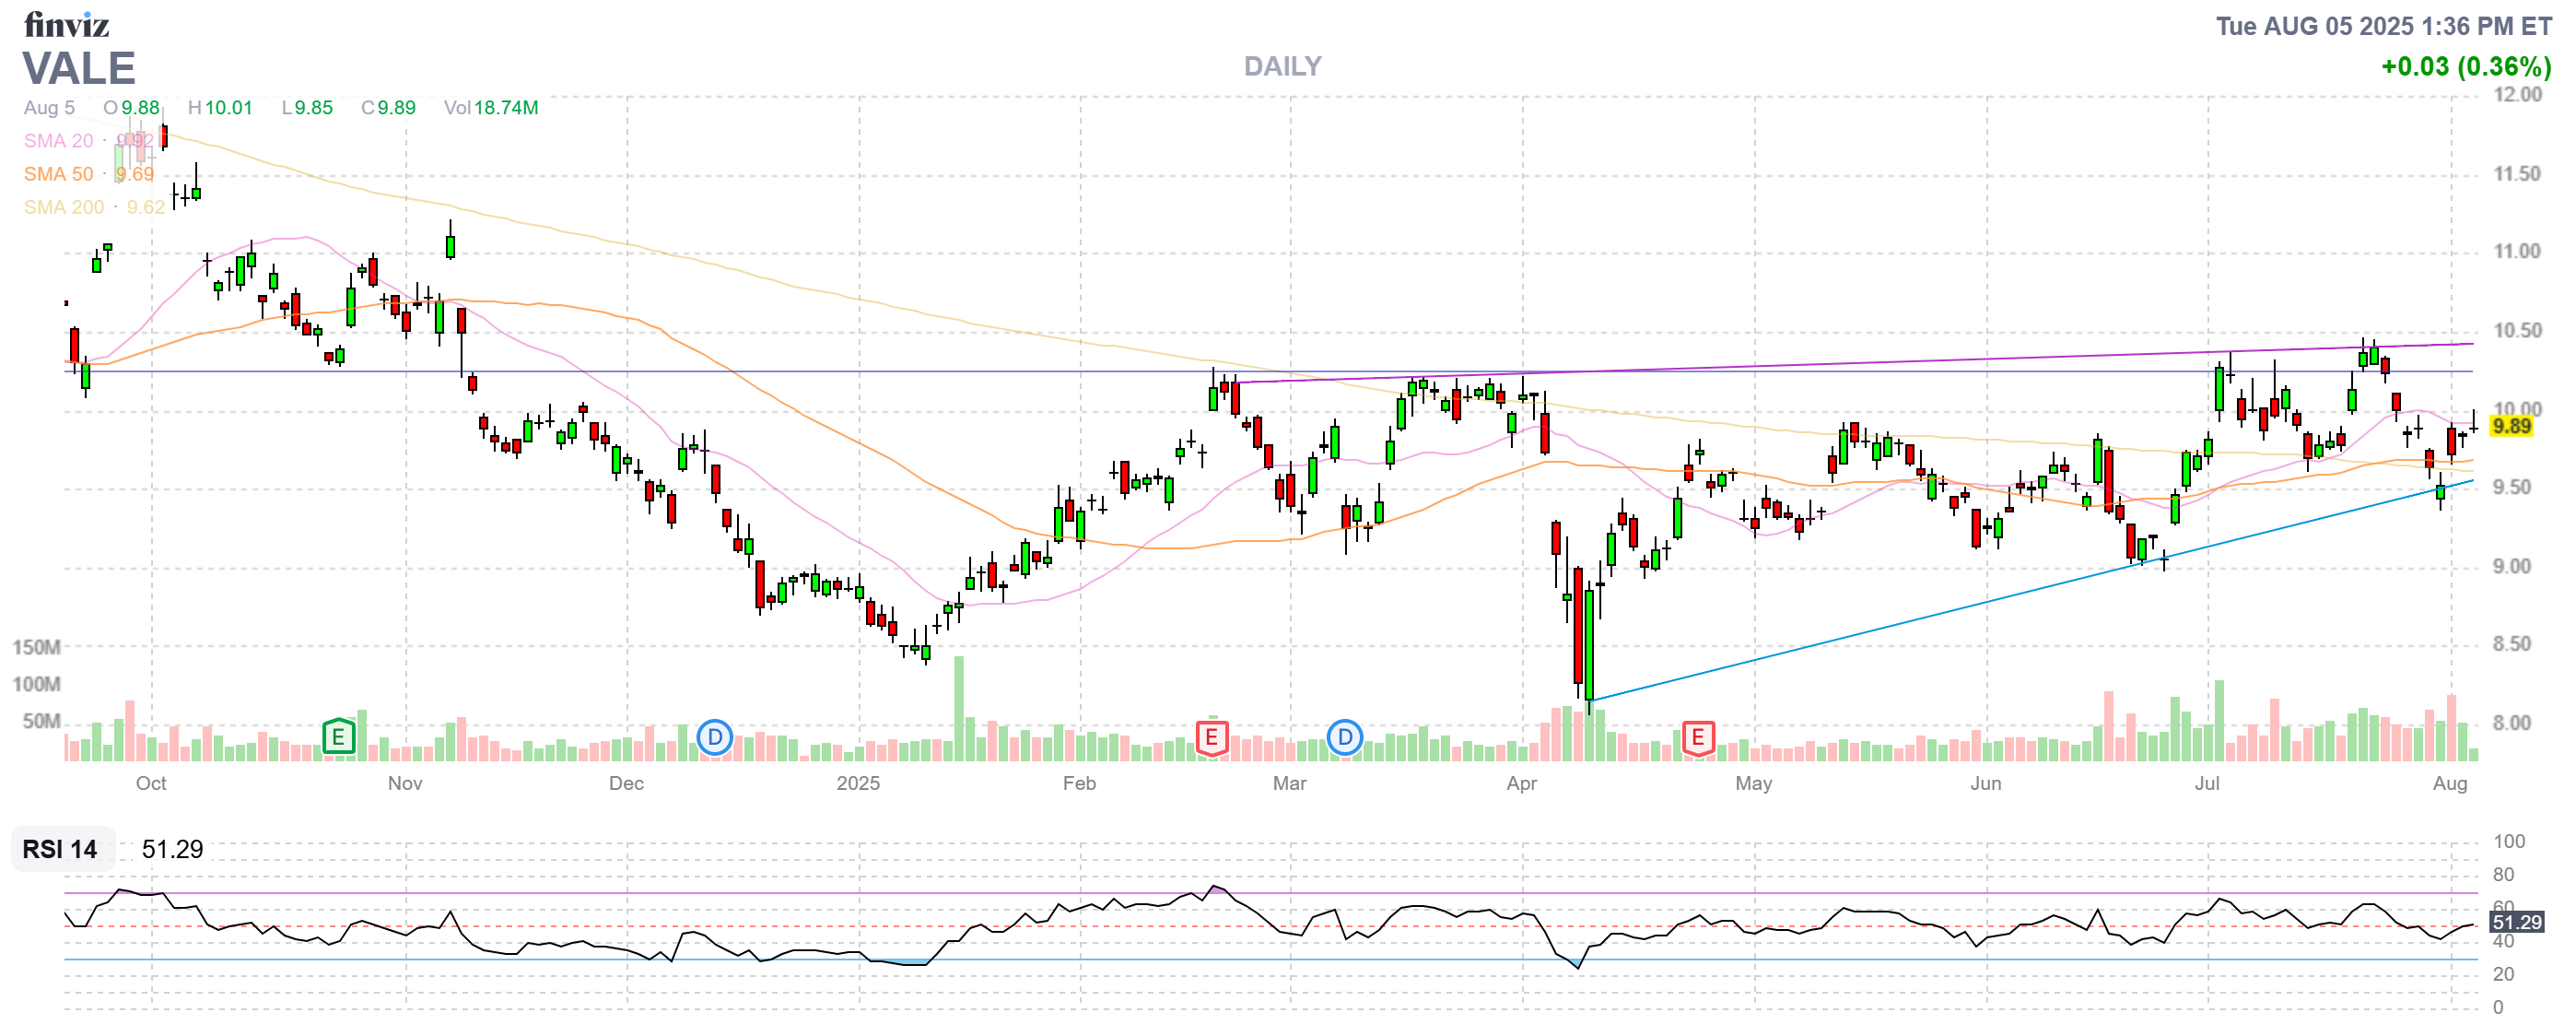
- VALE – We’re just crossing our fingers and hoping for good news on earnings. I don’t count that as upside potential for now…
So we have 15 remaining positions and we spent $2,075 on adjustments and we have a very healthy $31,262 (56%) worth of upside potential and still $4,957 left to spend and another $700 coming in next week (monthly deposits) so I guess we can afford to add another trade:
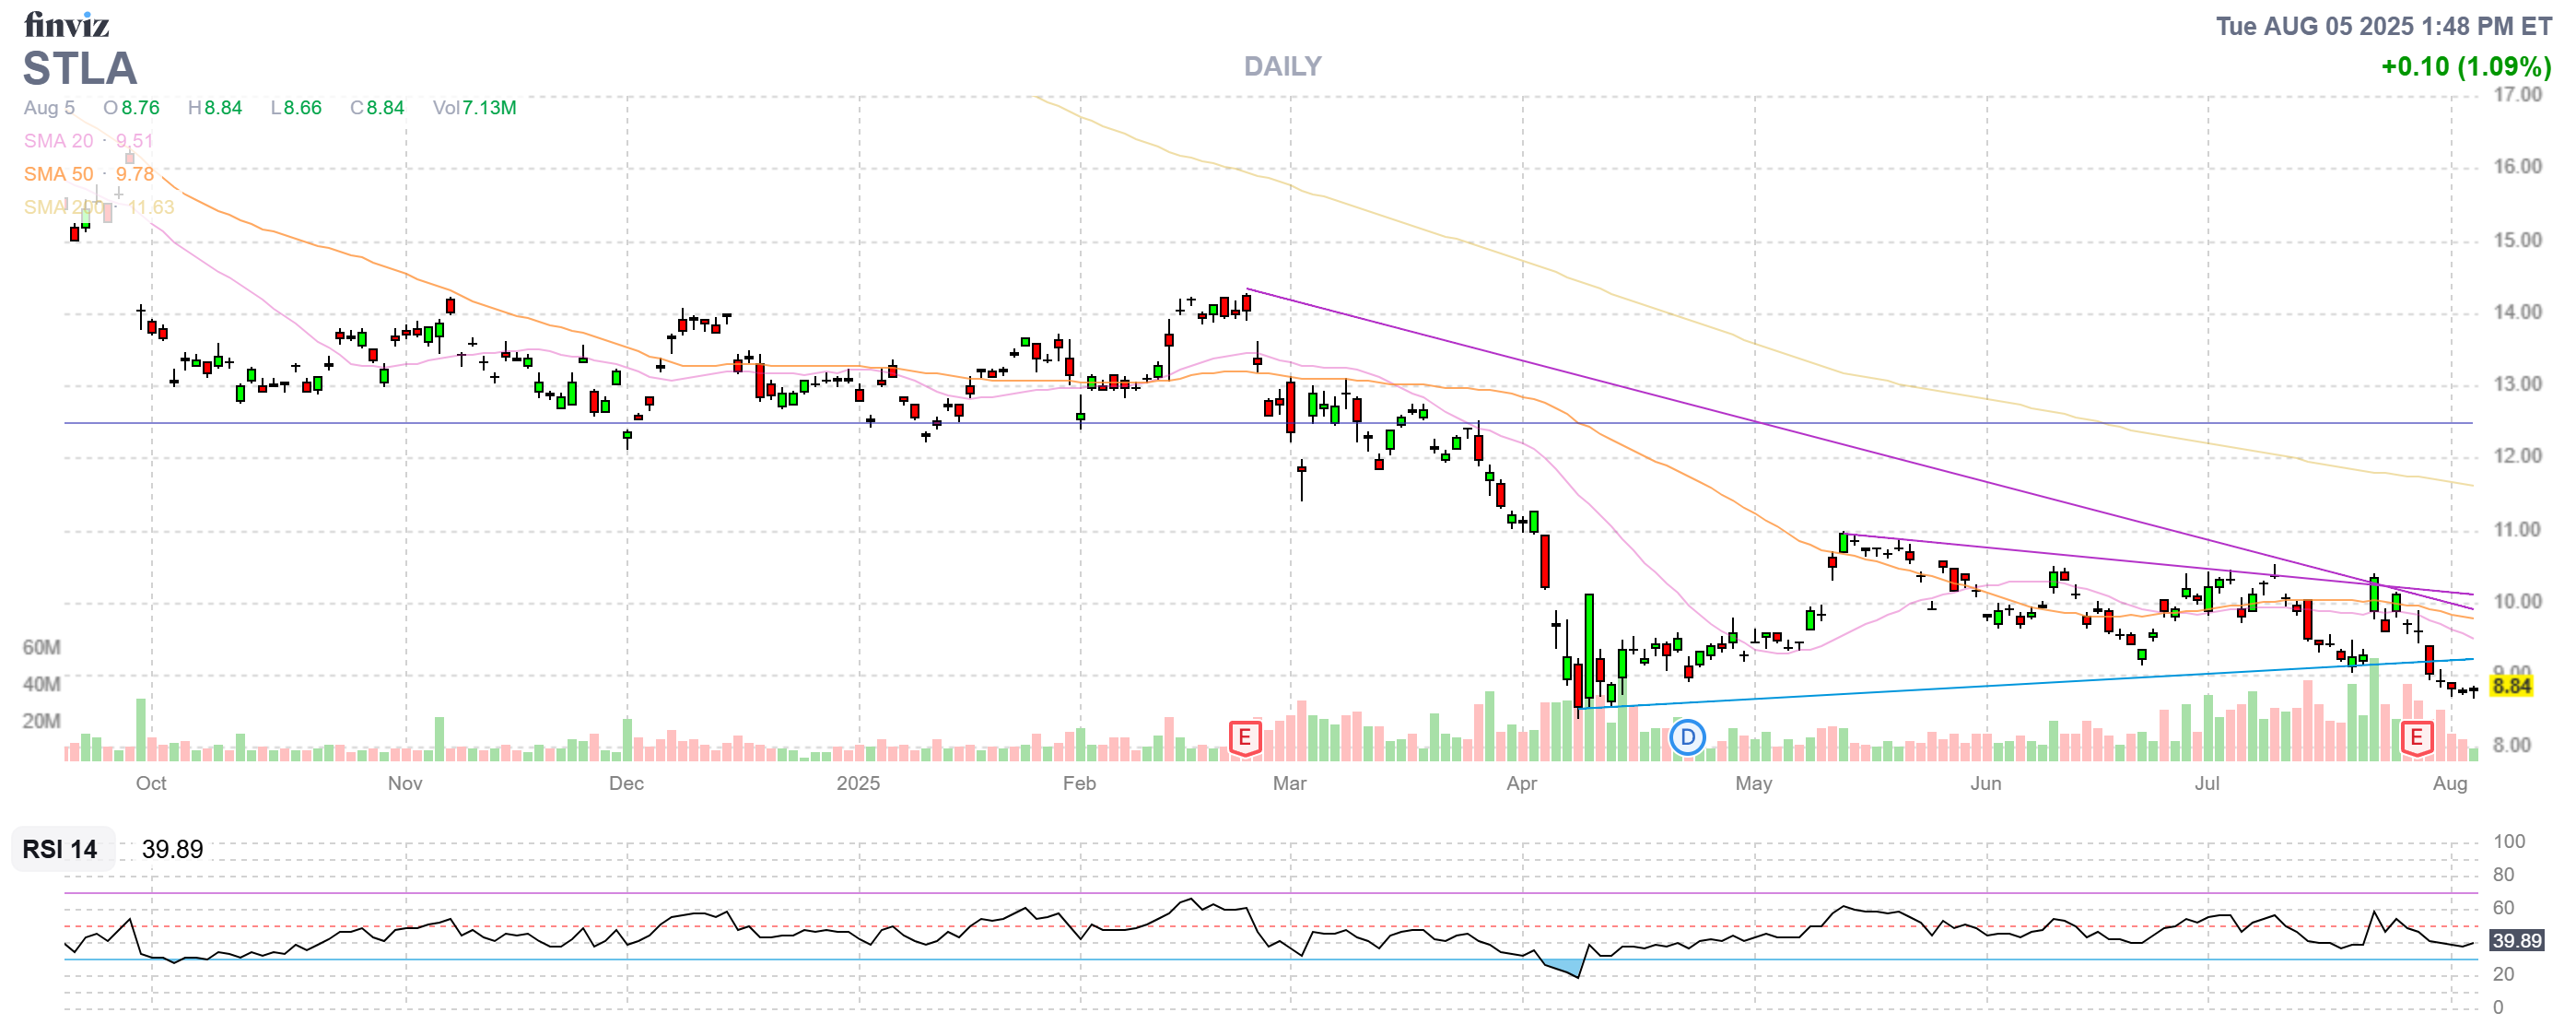
STLA is STUPIDLY CHEAP at $8.83, which is $25.3Bn and they make about $5Bn in a normal year but “only” $3Bn this year with all the tariff nonsense. Even so, $3Bn is 8.3x and that’s still STUPIDLY CHEAP – at $5Bn people should be ashamed not to own it. THEREFORE, we shall:
-
-
-
- Buy 20 STLA 2027 $8 calls for $2.35 ($4,700)
- Sell 15 STLA 2027 $10 calls for $1.45 ($2,175)
- Sell 5 STLA Dec $9 calls for 0.95 ($475)
-
-
That’s net $2,050 on the $4,000 spread so we have $1,950 (95%) upside potential in the next 16 months PLUS bonus potential if our short-call sales are lucky (we just sold $475 worth of premium using 136 of our 528 days!). Who says you need margin to make money? We’re half in the money already!
Now that’s $33,212 (59.5%) of upside potential for the next 16 months so we can just shut this down and come back then. But we won’t – we’ll find more things to trade and hopefully do better than that!


