
 What a great start to Year 4!
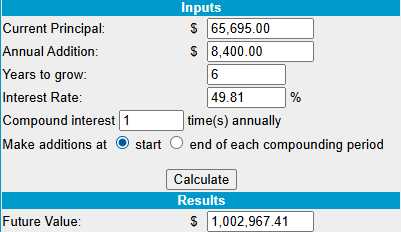
We have now crossed the 3-year mark in our $700/Month Portfolio and it is starting to feel less like a “proof of concept” and more like a real money-maker. Over the past month we’ve ridden through another earnings season with flying colors! The Consumer is weakening and Corporate Guidance is more cautious than it’s been in the last couple of quarters but, since that’s EXACTLY WHAT WE PREDICTED – our smallest portfolio IMPROVED its performance – from 40% to 49.8% and now we are just 6 years away from our $1M goal (from a $700 start!).
Why? Because the $700 Portfolio isn’t built on chasing hot trends or guessing which way the market mood will swing next week. It’s built on a system: consistent contributions, option-based strategies to enhance yield and the PATIENCE to let time and MATH do the work for us.
This is NOT gambling! THIS IS INVESTING!!!
At this stage, three years and 37 deposits in, we’ve put $25,900 into the account. Against that we have built our Profits and collected Premiums. Even as conditions shift, the discipline of adding $700 every month and managing our positions systematically keeps us on track for the Million-Dollar goal. At $65,695, we’ve gained an amazing $10,148 (18.2%) since last month’s review as we NAILED earnings!
Think of it like a long hike: the trail just tilted uphill with Consumers under pressure and Inflation data still sticky. Our packs (positions) are heavy at the moment and our cash is low so our strategy is obvious looking at the road ahead – LIGHTEN UP! Our strategies so far: selling premium, rolling intelligently, using covered puts and call spreads — got us to this point but we need some cash – just to be safe….
After adding this month’s $700, we only have $642 available, so we’ll be taking a very critical look at each of our positions – looking for places to raise cash.

-
- BXMT – We need cash and here’s net $3,551 locked up – so we’ll take the money off the table.
- NEWT – Not that I don’t like them but let’s cash them in for net $4,707!
We are now past the point where slow, steady profits appeal to us. When we began the portfolio, “sure thing” moneymakers (big dividends) like these were very appealing but, at about 20% per year, they are underperforming the rest of our trades by a very wide margin and we’re confident enough to put the cash to better use.
That was easy! Now we have PLENTY of cash for adjustments or entering new opportunities!
-
- ET – Over our target at net $2,975 on the $4,000 spread so there’s $1,025 (34.4%) upside potential in 16 months.

-
- LEVI – Also past our goal already at net $2,525 on the $3,500 spread so there’s $975 (38.6%) left to gain.
- LEVI (2) – Same trade, just twice as much at net $5,050 on the $7,000 spread with $1,950 (38.6%) left to gain.

Note to new Members: While making 38.6% may SOUND exciting, it’s over 16 months (Jan, 2027 expiration) and we’re averaging almost 50% a year so, technically, these are now underperforming positions as we’re ahead of schedule and have already captured great profits from our entries. Still, there’s a value to CERTAINTY and both of these trades have a high degree of confidence – so there’s no reason NOT to make 2% per month – while we wait for something better to come along…
-
- PATH – This one is underwater. Earnings are today, so we’ll see. Net $1,695 on the $5,000 spread has $3,305 (194%) upside potential but it’s make or break on earnings today.

-
- SOFI – Over our goal at net $7,275 on the $12,000 spread has $4,725 (64.9%) upside potential and we’re very confident so this one, in fact, is good for a new trade!

-
- SQQQ – This one is a hedge and SQQQ is a 3x inverse ETF so, if the Nasdaq drops 20%, SQQQ should gain 60% (not really due to decay but close) and 1.6 x $17.99 (current price) is $28.78 and our longs are $15s so $13.78 would be $13,780 and currently the net is $3,375 so we have net $10,405 in downside protection that we can count on.

-
- UUUU – Also over goal (aren’t they all?) at net $5,200 on the $10,000 spread so a nice $4,800 (92.3%) left to gain makes this a keeper and good for a new trade.

-
- VFC – Despite being on track, we’re only at net $1,928 on the $5,000 spread that’s $2,410 in the money and we have $3,072 (159%) upside potential and this is SO GOOD for a new trade that I’m tempted to double down!


-
- HBI – I love my Consumer Essentials! This is a new one and it’s gone nowhere yet at net $1,088 on the – let’s call it – $3,750 spread (we expect to be able to roll the short calls) so that’s $2,662 (244%) of upside potential but, in this case, earnings were TOO GOOD and we got burned on our short calls. Plenty of time for things to play out…

-
- HPE – Way over our goal at net $4,575 on the $4,000 spread (+ time to roll) and the 2027 $25s are $3.35 and that would be $6,000 more – so this is a keeper! Let’s call it $3,000 of upside potential but we’ll probably do much better.

Because we assume no margin availability in this portfolio, we have to be creative in finding ways to sell premium and this trade is an example of selling TIME (theta), not position (delta) – though it’s a bit of both in this case!
-
- B – Love my Barrick! Net $3,817 on the $3,500 spread but also with the rolling option on 3 short calls but they are BURIED too deep so we may as well cash this out as it got away from us (but we still made more than we planned). Not that I think it won’t go higher but this particular set-up isn’t right to take advantage of it.

-
- EPD – Brand new and already up $70! We’re at net $1,525 on a $4,000 spread (we assume the roll) with $2,475 (162%) upside potential. Great for a new trade, of course!

-
- M – Who was the genius who only went with a partial cover into earnings?!? HUGE move and we will roll the 3 short Nov $12 calls at $4.35 ($1,305) to 6 short Jan $16 calls at $1.80 ($1,260) for net $45 and we still have 2 uncovered longs on the $10,500 spread at net $6,774 with $3,726(55%+) left to gain.

-
- NAK – 2nd time around for this stock. We cashed out a big winner and now we’re playing the pullback for income – as they may be done for but people will still bet on them. We sold $900 worth of premium using 8 months against our (at the time) 22-month long of $1,800 so a 50% return was nice. At the moment, we will owe 0.12 ($120) back and then we collect another $900 for the next 9 months. Still, I’m not going to count it as it’s a lot of work ahead but there’s no net so we may as well play it out.

-
- STLA – Right on track and you’re getting used to this way of making extra premium, right (and isn’t that the whole point of these teaching portfolios)? Net $2,175 on the $4,000 spread leaves us with $1,825 (83.9%) upside potential PLUS bonus rolling money.

-
- ULCC – 2nd crappiest Airline wins! Net $2,138 on the $2,500 spread only has $362 (16.9%) left to gain but that’s by April and hopefully some bonus rolling money too!

-
- VALE – Our biggest disaster (so far) but starting to gain traction. The Jan calls would take a miracle but earnings are Oct 30th so we shall see. The new $8,000 spread is at net $4,225 and already up $665 so, if all goes well, we might get our money back! Let’s call this $3,775 (89.3%) upside potential on the revenge trade.

So we have $37,677 (57.2%) of upside potential through Jan of 2027 so that’s about on pace with our current average gains. If all goes well, we’ll cruise through another year closer to our goal and now we have about 20% CASH!!! on the sidelines for new trades and adjustments AND we have a $10,000 hedge (20%) so I’m very, VERY pleased with where we are at the moment – after 3 years of running this portfolio!


