
 19 tiny positions!
We begin year 4 of our investing journey in excellent shape, at $71,338 and that’s up $5,643 (8.5%) in a month and up $44,738 (168%) against our 38 monthly $700 contributions ($26,600). Congratulations to all who have been playing along and, while it may seem like it – you haven’t missed much as we’re still $928,662 (1,300%) away from our $1,000,000 goal which looks like (at this pace) we’ll hit in May of 2031!
Of course, this pace is ridiculous as we’re in a crazy bull market that just keeps going up and up and the real test will be how we do in a pullback – if there ever is one… Meanwhile, let’s not complain and enjoy the ride – we are 2 DECADES ahead of schedule at the moment – that is FUN!!!
A couple of weeks ago, one of our new Members (you can join HERE if you’d like to participate in our next $928,662 worth of gains) asked for a quick intro to the $700/Month Portfolio and I thought it would be a good idea for everyone:
We generally review the $700/Month Portfolio on the first week of the month. Our most recent is here.
Here’s a few going back for the year:
-
-
-
How to Become a Millionaire by Investing $700 per Month – Part 37/360 – Year 4 Begins!
- How to Become a Millionaire by Investing $700 per Month – Part 36/360 – 3 Years In!
- How to Become a Millionaire by Investing $700 per Month – Part 35/360
- How to Become a Millionaire by Investing $700 per Month – Part 34/360
- How to Become a Millionaire (EVEN in This Market) by Investing $700 per Month – Part 33/360
- How to Become a Millionaire – EVEN in a CRASH!!! by Investing $700 per Month – Part 32/360
- How to Become a Millionaire by Investing $700 per Month – Part 31/360
- How to Become a Millionaire by Investing $700 per Month – Part 30/360
- How to Become a Millionaire by Investing $700 per Month – Part 29/360
-
-
That will give you an idea of how the portfolio has evolved recently and any new trades are added during our chats (EVERYTHING at PSW comes from the live chats or posts) but the strategy and position reviews are done monthly – so next one in two weeks.
And then Warren (AI) gave a nice overview of the portfolio and our strategy:
🤖 Welcome to PSW and the $700/Month Portfolio!
Great question — and one we love to answer because this portfolio is one of the best ways to learn by doing. Here’s how to get started:
📌 Step 1: Understand the Goal
The $700/Month Portfolio is our “micro proof of concept.” The idea is to start with a small, steady monthly contribution ($700) and compound it over time using our favorite option-selling strategies — with no margin, no fancy tricks, and no unnecessary risk.
After 3 years of running this portfolio, we’ve turned $25,200 in deposits into over $67,000 in value. That’s the power of consistency and premium selling.
📌 Step 2: Follow the Monthly Reviews
Each month we publish a review (like the one from early September) that shows:
-
-
-
- Current holdings – all open positions and cash
- Performance – gains/losses since inception
- Adjustments – what we are buying, selling, rolling, or closing
- New Trades – where the next $700 deposit is deployed
-
-
Simply follow along with those adjustments — that’s the definitive roadmap.
📌 Step 3: Learn the Method
This portfolio is all about:
-
-
-
- Selling premium (puts/calls) to generate cash flow
- Building spreads to define risk and maximize leverage
- Rolling with discipline to stay on target
- Staying patient — we rarely trade more than a few times a month unless the market forces our hand
-
-
I highly recommend reading through the first couple of reviews to see how we started. It’s educational to watch how positions evolve over time.
📌 Step 4: Just Start
You don’t need to wait for a perfect entry point — just commit to making the monthly contribution and follow the trade updates as they come. Even if you’re starting today, you can mirror the current positions at today’s prices and join the journey forward.
💡 Final Tip
Think of this portfolio as your personal financial gym. You’re not just chasing gains — you’re building discipline and learning to think like a portfolio manager. By the time you’ve followed it for a couple of years, you’ll have mastered the skills to scale these same strategies to larger accounts.
— Warren
I think that sums it all up quite nicely and so, without further adieu, let’s get to our Review:
-
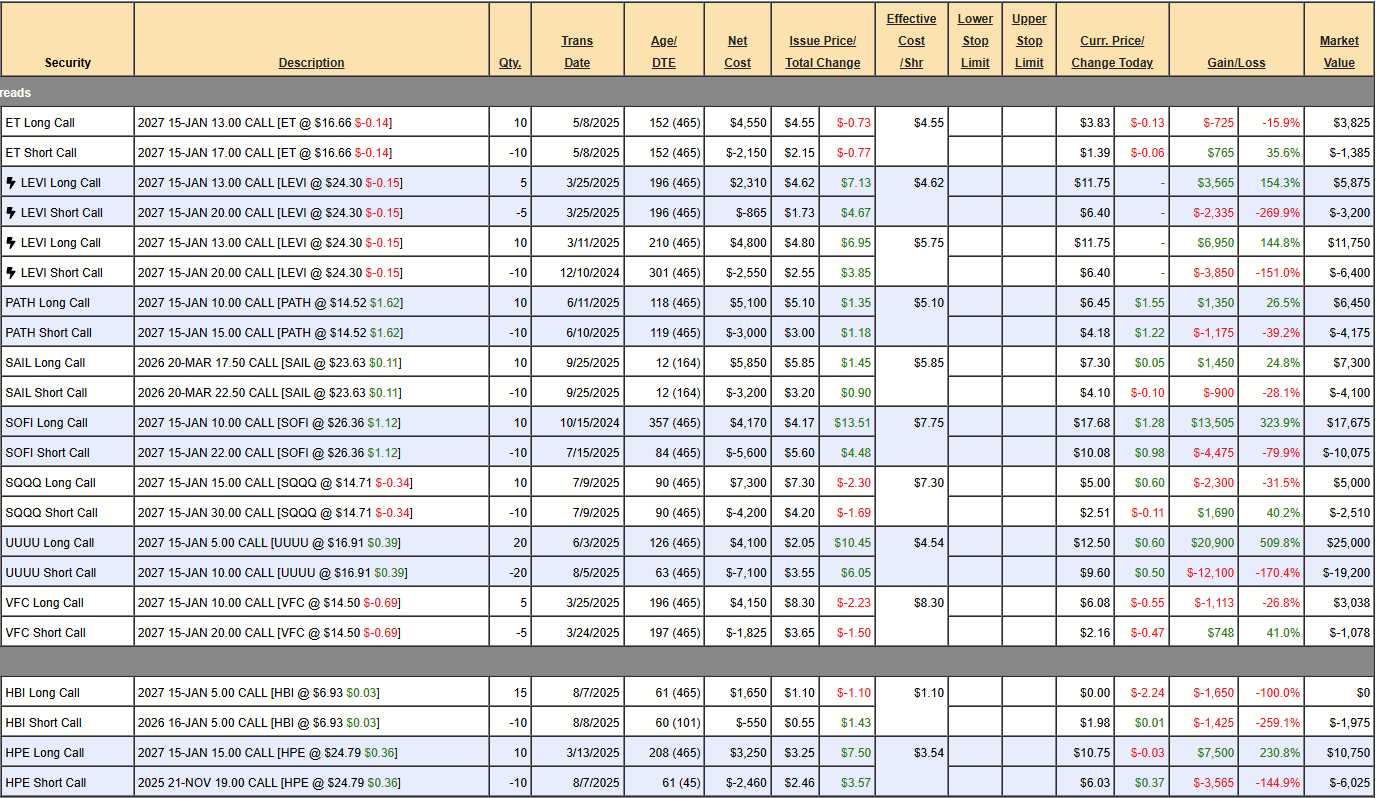
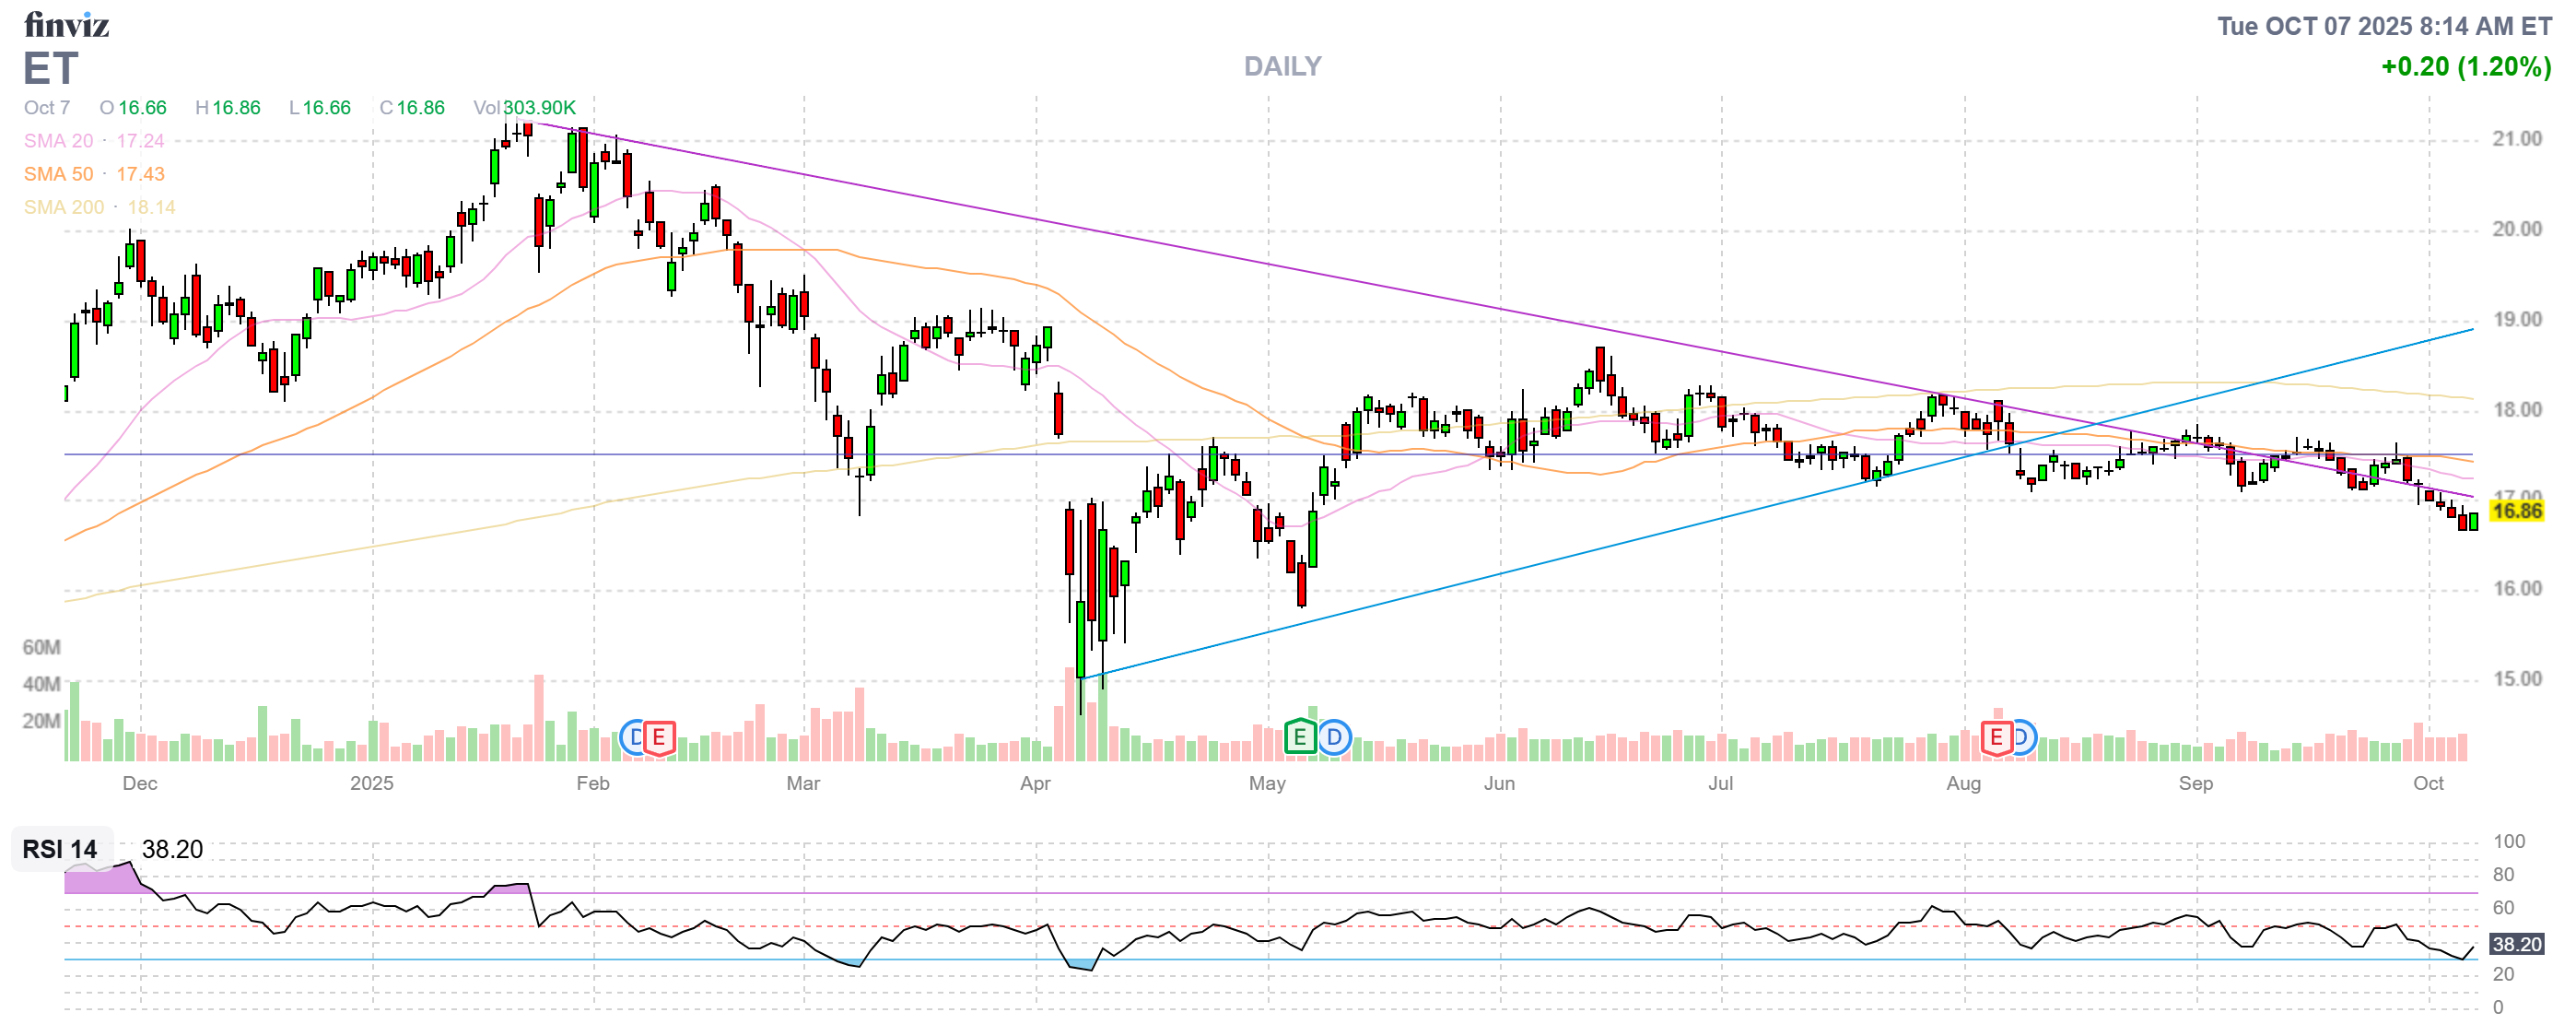
- ET – It seems not to be making progress but we’re $3.66 ($3,660) over our longs and we paid $2,400 for the spread so we’re up over 50% but the premium masks it. That and $5 will get you a cup of coffee, of course but the ONLY sure thing in the markets is that ALL PREMIUM WILL EXPIRE WORTHLESS! Patience is how we make our money… It’s a $5,000 spread so there’s $1,340 (36%) left to gain.
-
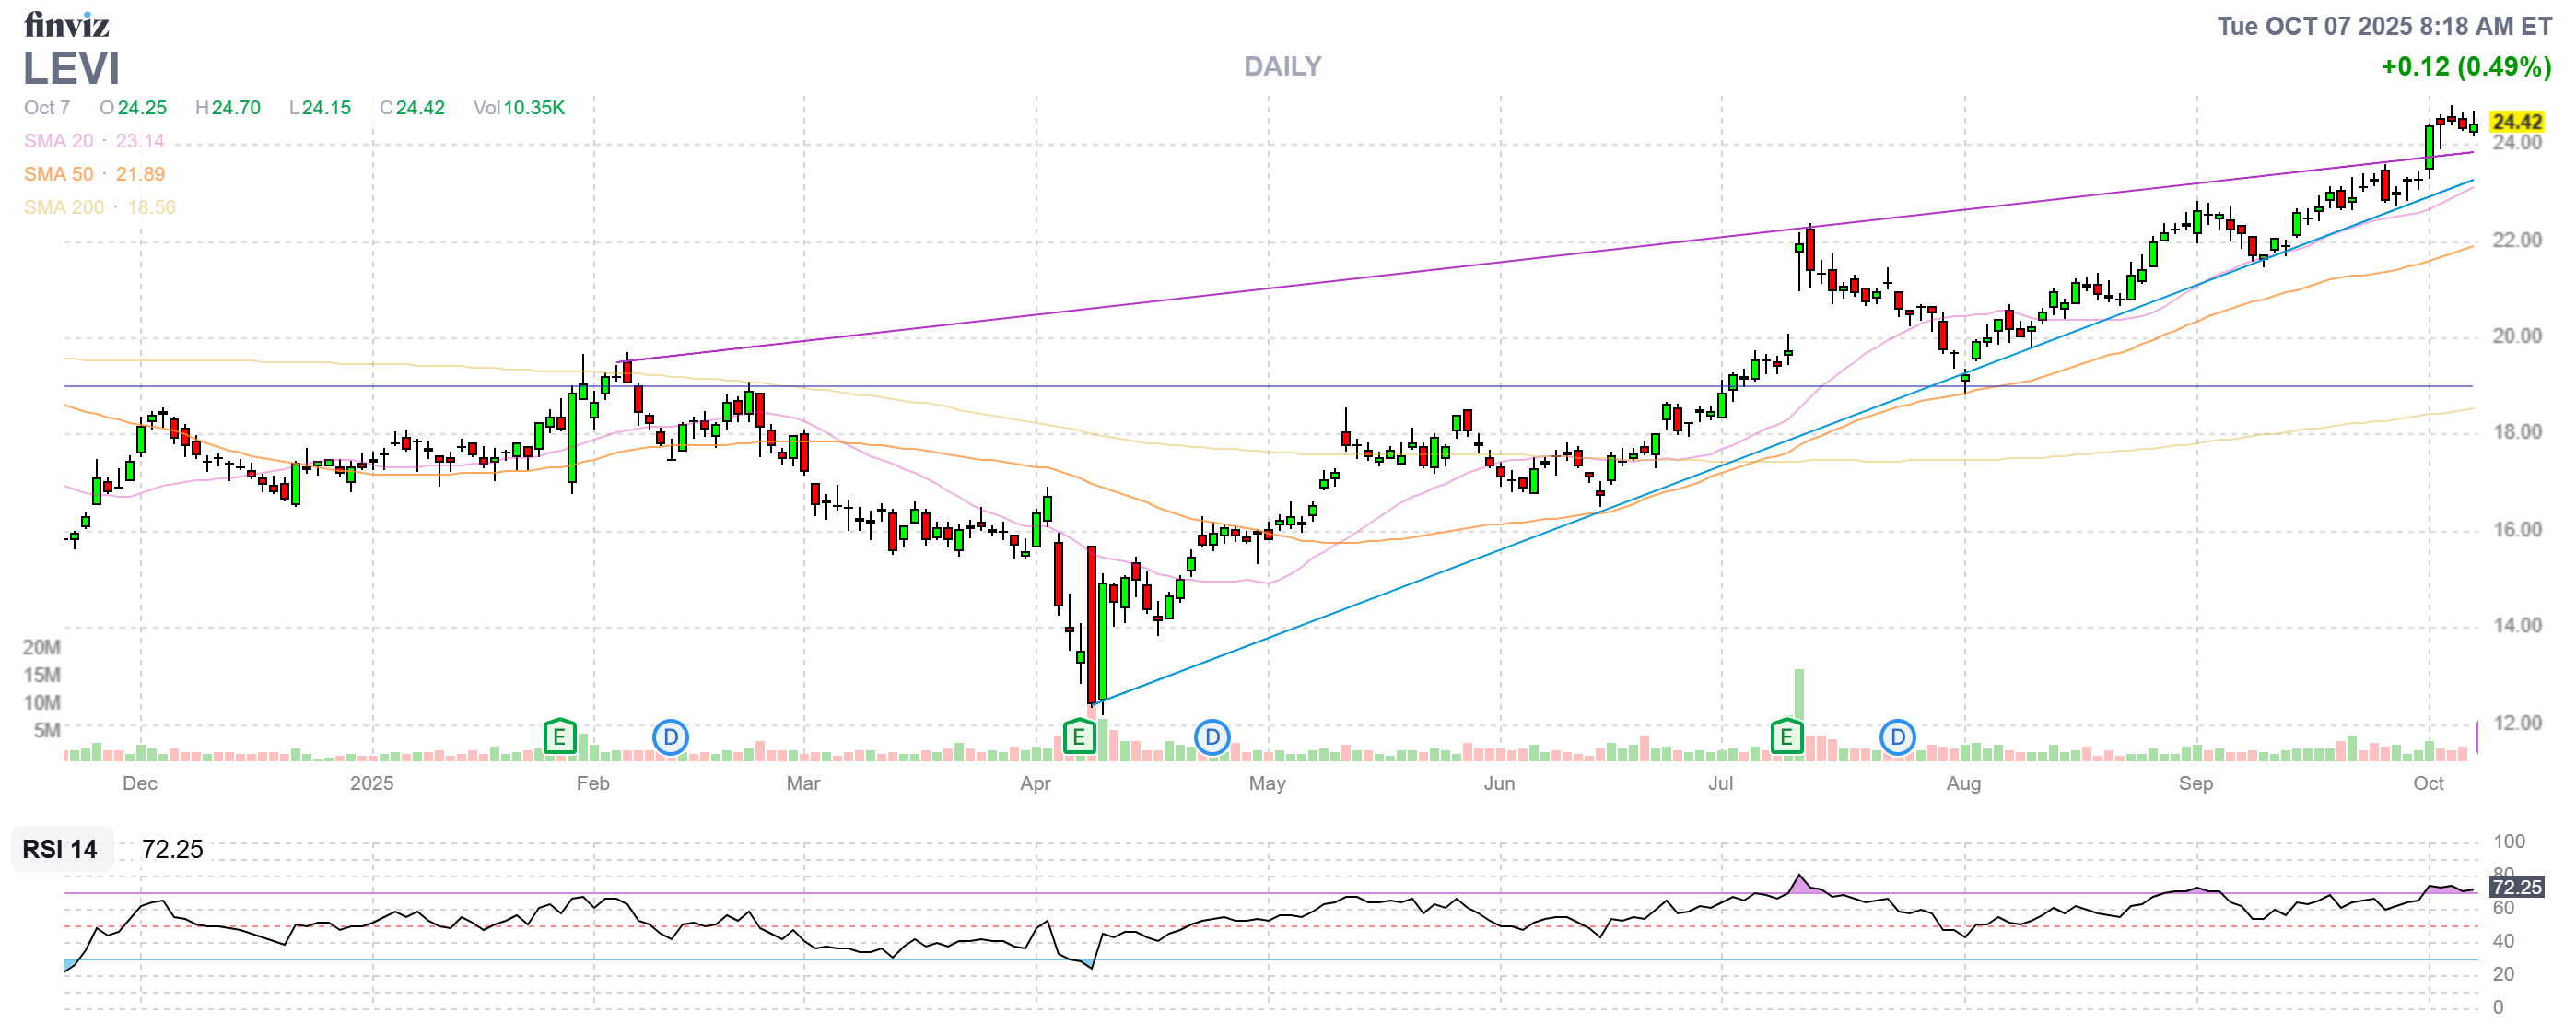
- LEVI (2) – We’re way over our target at net $2,675 on the $3,500 spread and that’s $825 (30%) left to gain over 15 months. These are tough as they are underperforming our average but, on the other hand, it’s a high-confidence, low-risk gain – we like those! Holding for now. Our 2nd spread is identical with $1,650 left to gain. The key thing to remember is this is a place where we can cash in $8,025 if we find a better opportunity!
-
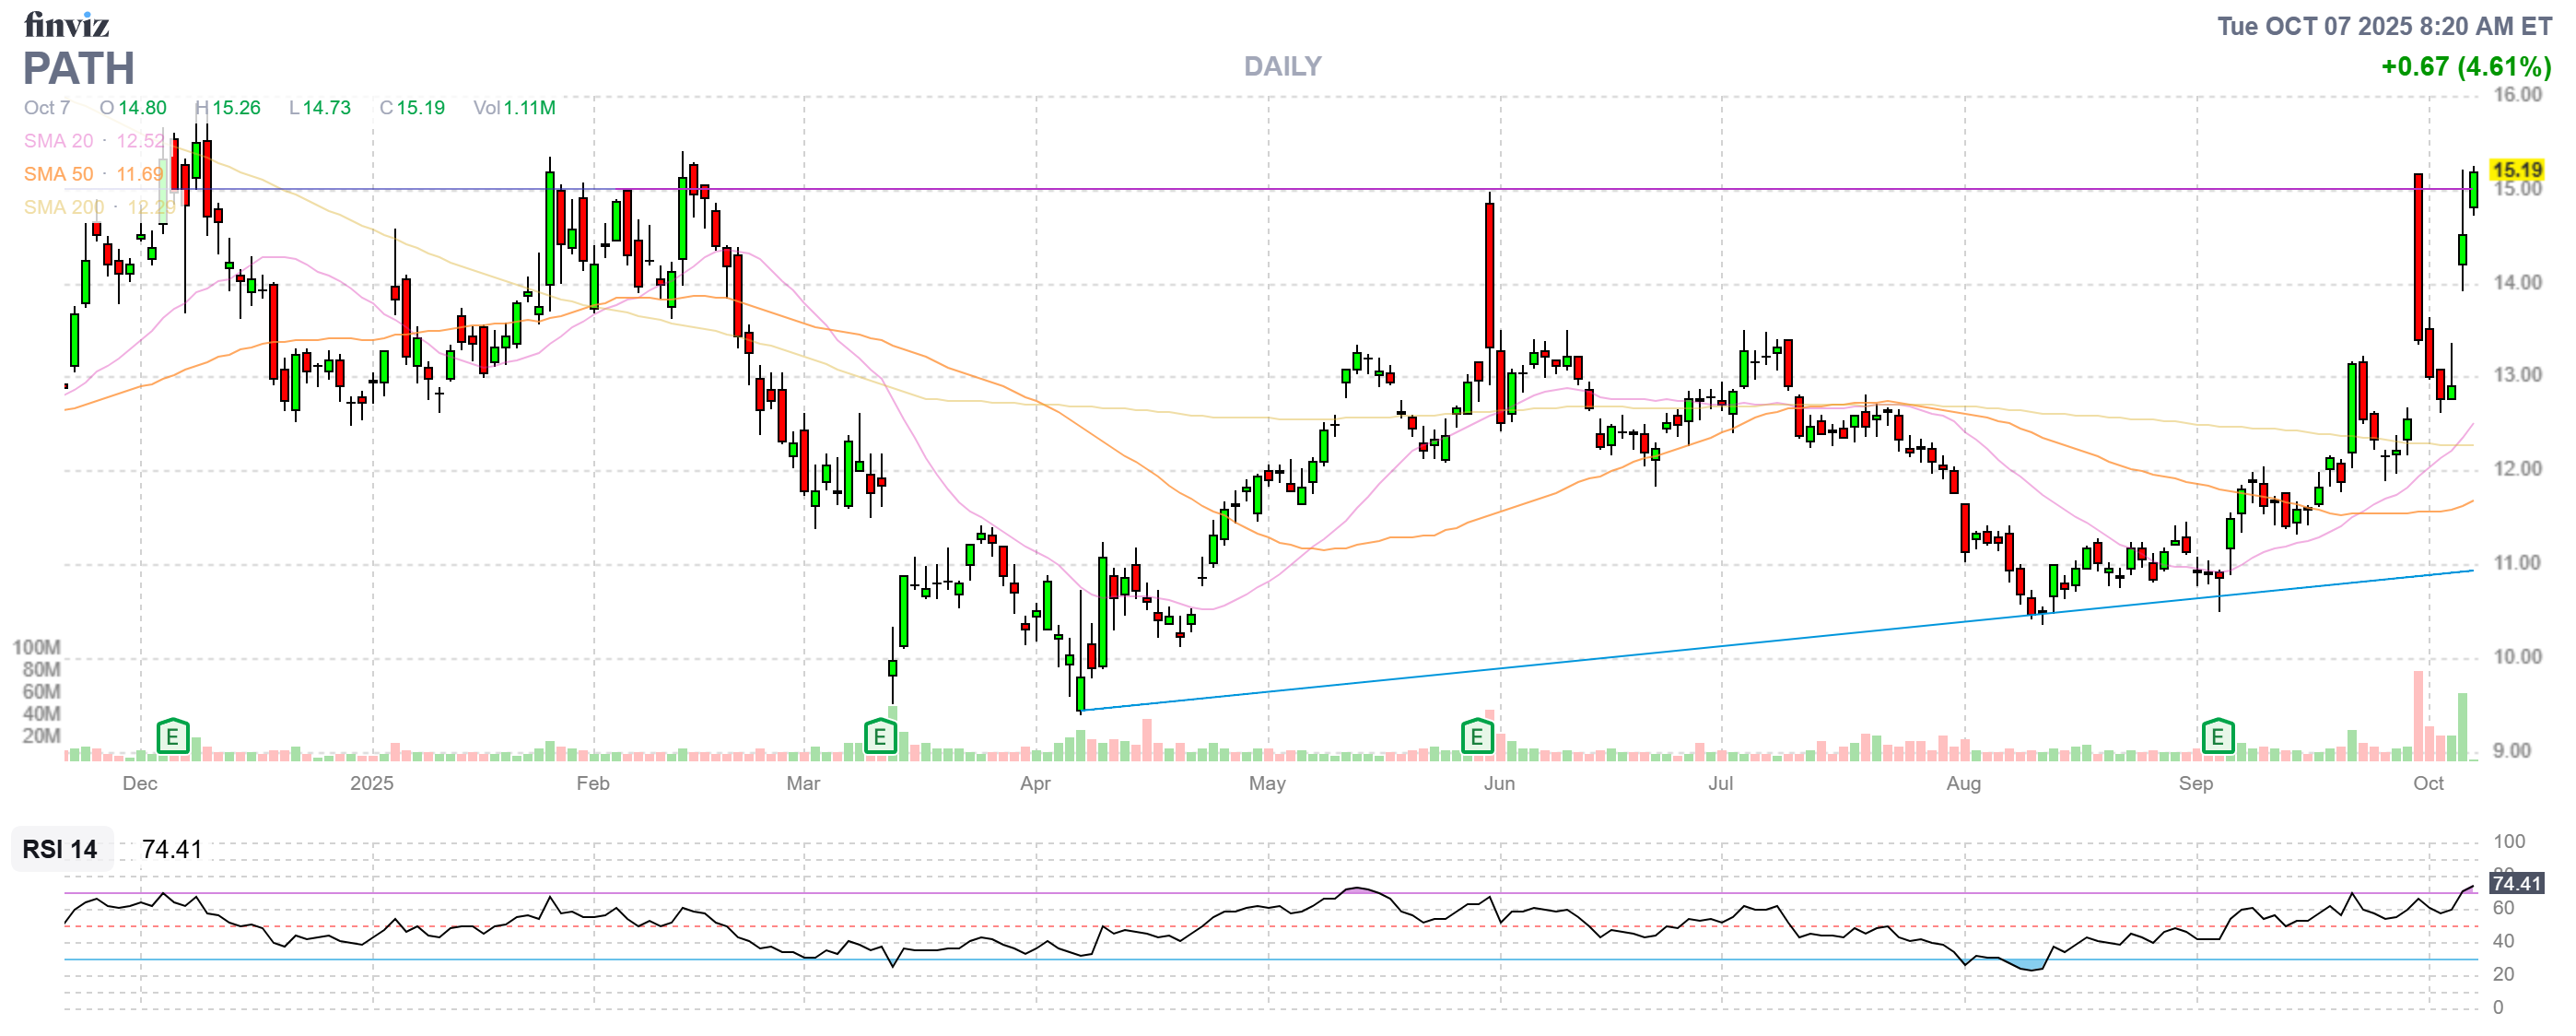
- PATH – Why do our stock picks keep blasting off on us? Actually, that’s fine in this portfolio as we don’t use margin so we don’t sell uncovered calls. The answer is because we pick small cap value plays where we believe there is an upcoming catalyst that will make the market realize our stocks are underpriced – so they take off (usually after earnings).
- In this case, our $5,000 spread is only net $2,275 despite being at our goal already (4 months) and, with 15 months to go, we look forward to making $2,725 (119%) more and all PATH has to do is hold $15 so – Good for a new trade!
-
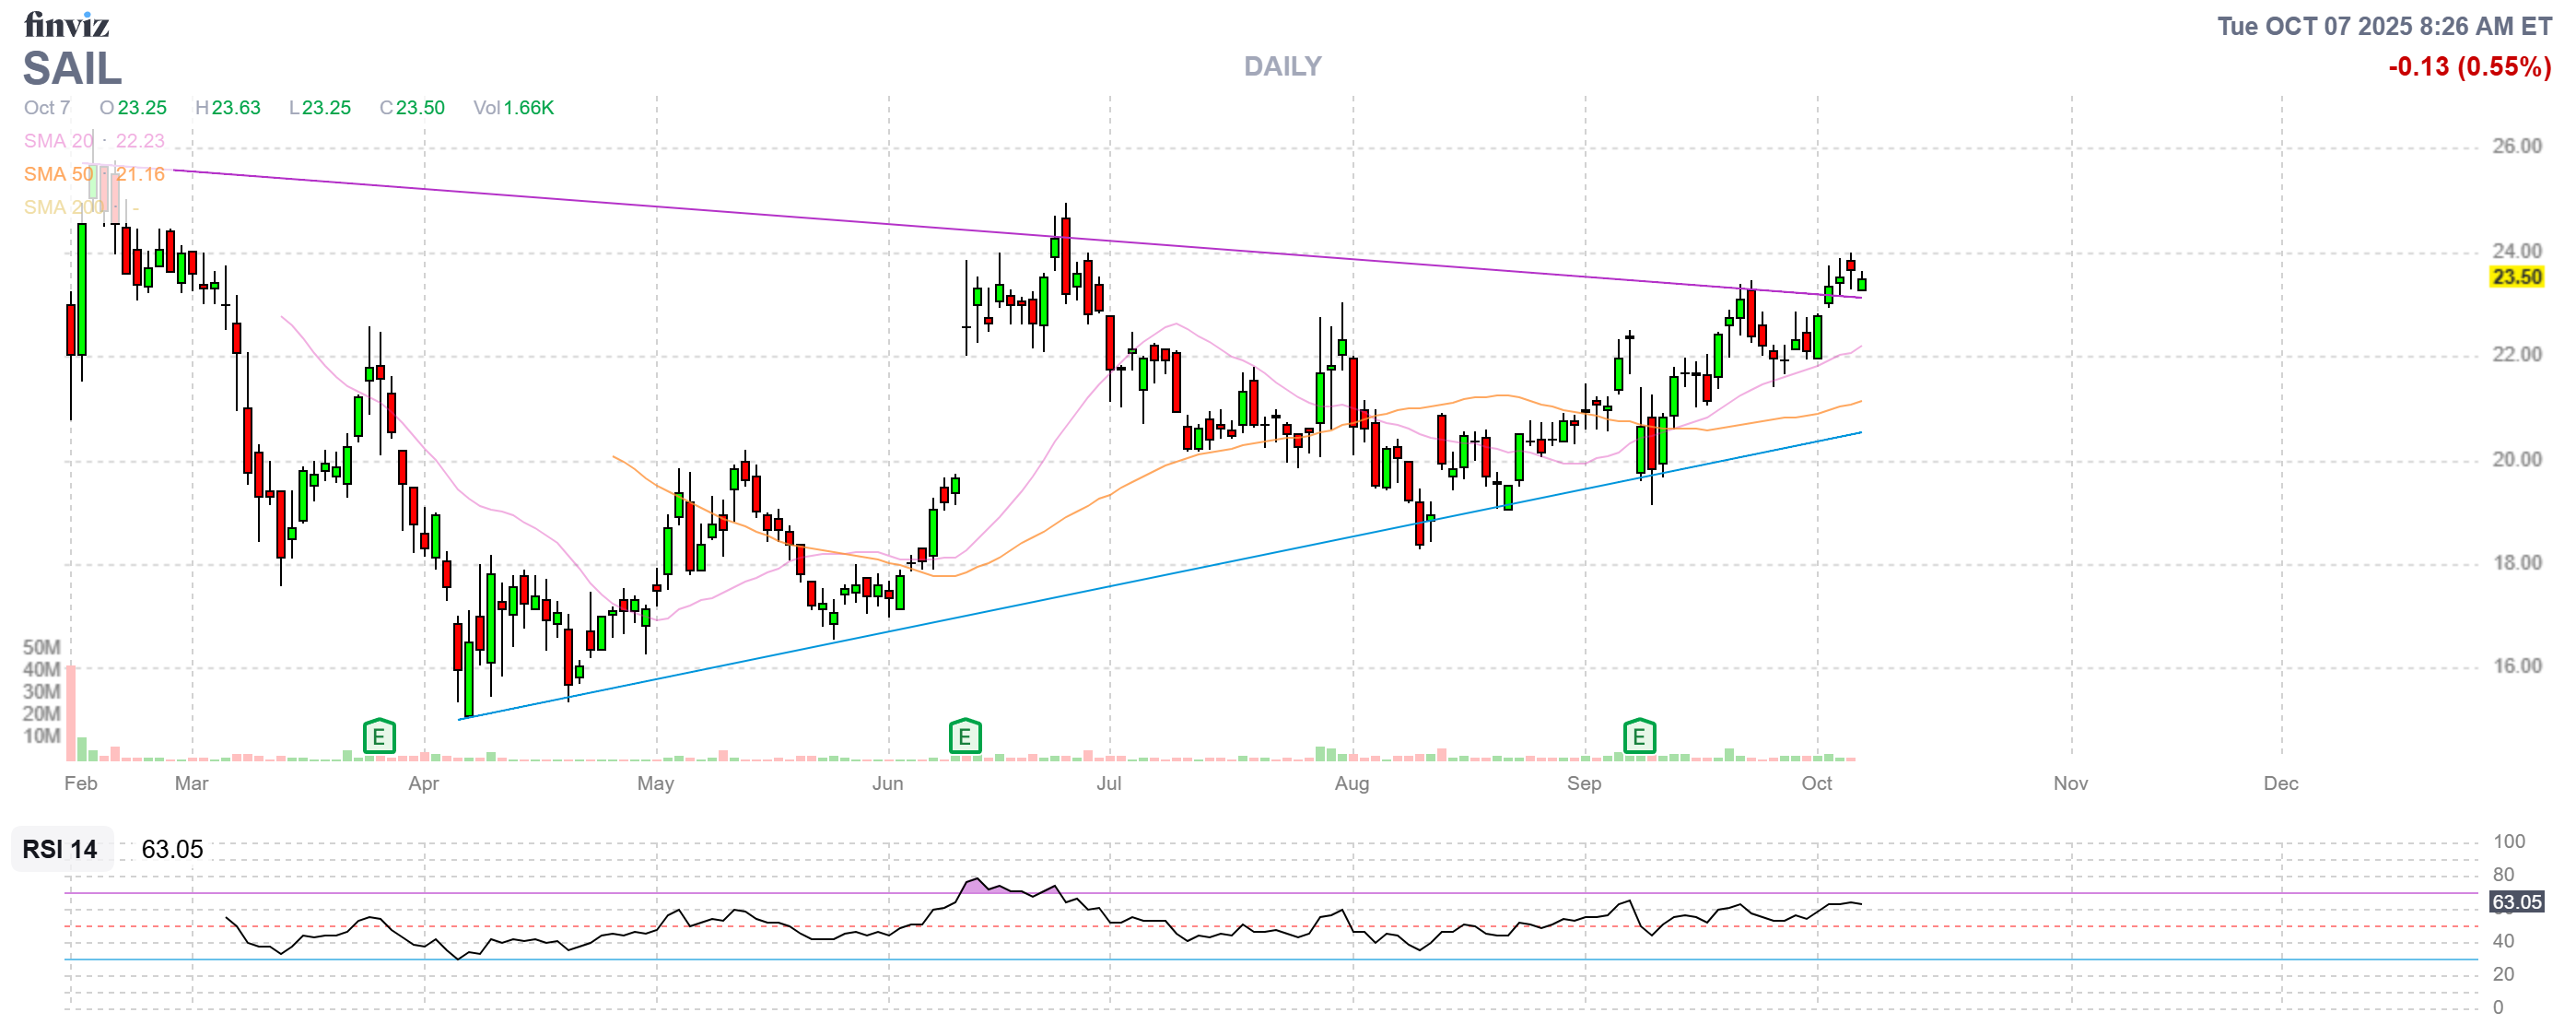
- SAIL – That’s a brand new one at net $3,200 on the $5,000 spread with $1,800 (56%) left to gain if they simply hold $22.50 (blew past it already). Aren’t options fun?!?
-
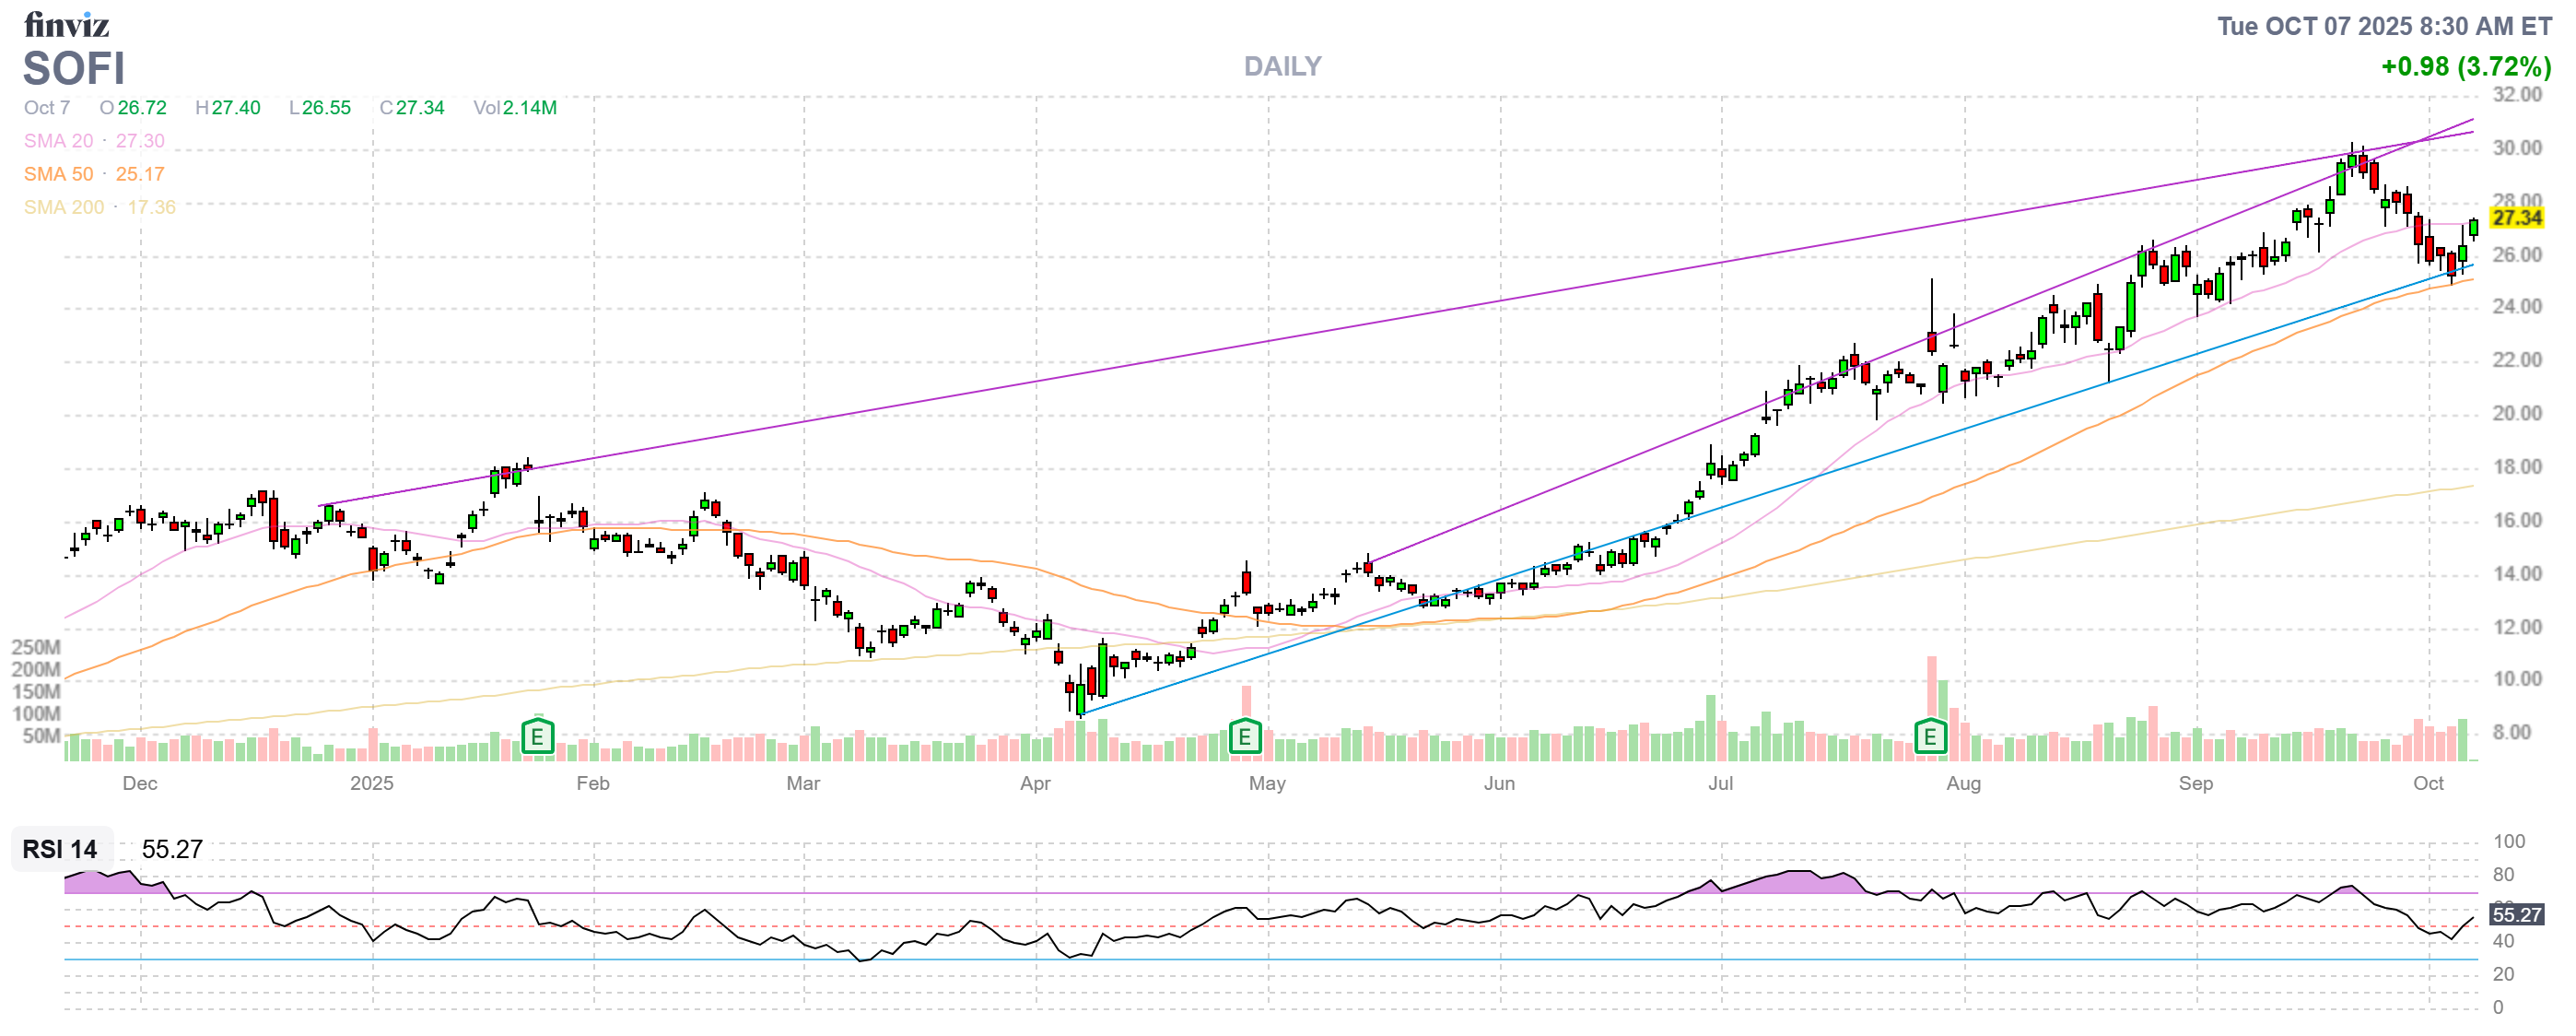
- SOFI – This is our 3rd time playing them! Currently we’re at net $7,600 but it’s a $12,000 spread that’s deep in the money with $4,400 (57%) left to gain in 15 months as long as SOFI doesn’t drop $4.36 (19.5%) so it’s actually good for a new trade – if you like making 57% in 15 months…
-
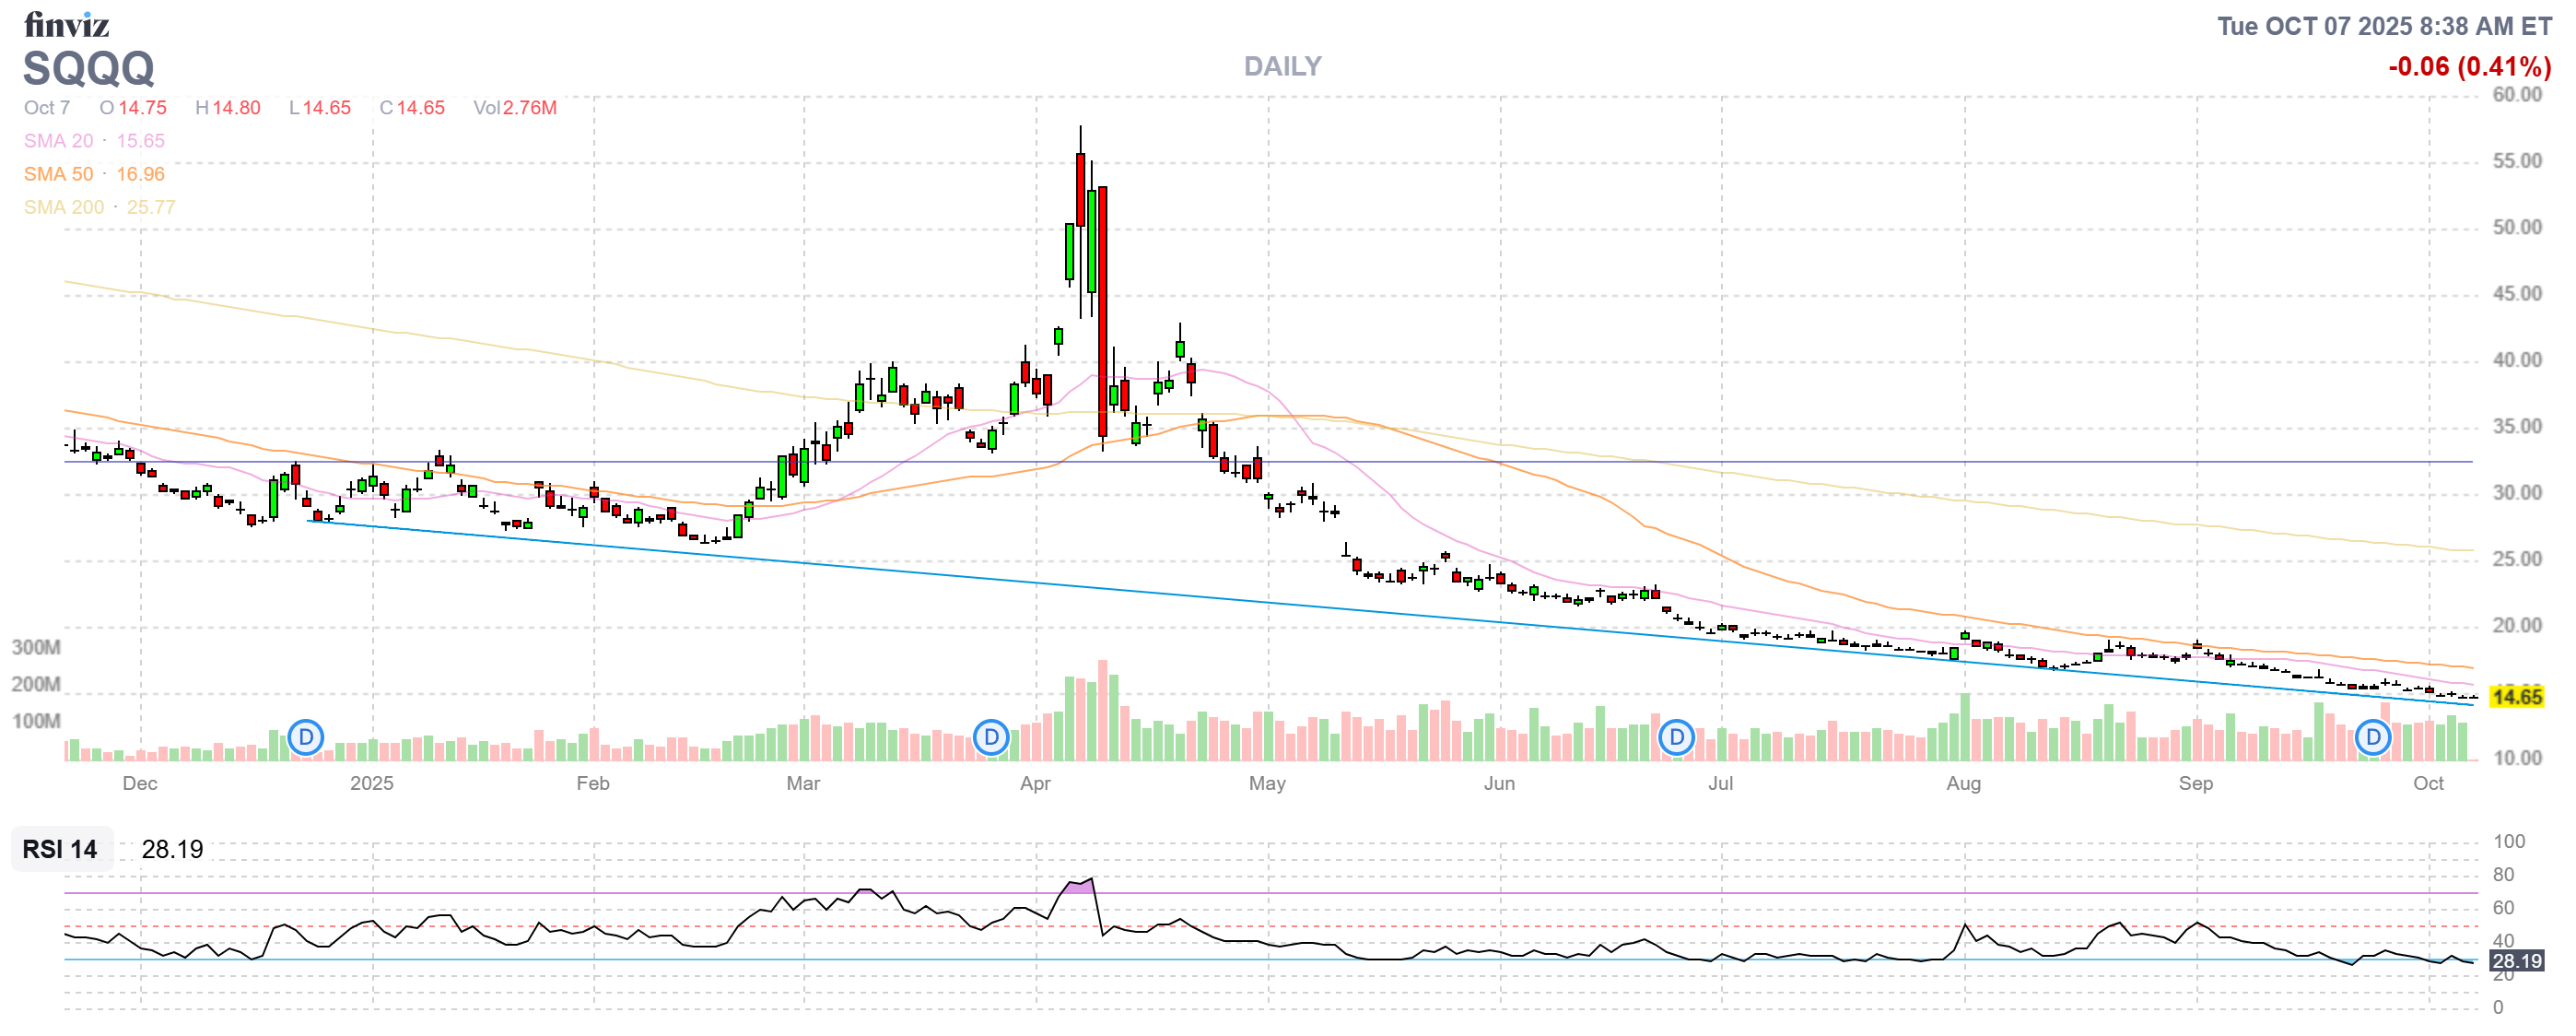
- SQQQQ – A hedge seems like a real waste of money in this market. At $14.71 a 20% drop in the Nasdaq would pop this 3x inverse ETF 60% to $23.53 and that would net us about $7,500 and the current net of the spread is $2,490 so $5,010 worth of protection. The 2028 $10 calls are only $6.60 ($6,600) so let’s spend $1,600 to buy another year of insurance and another $5,000 of protection. Now we have $10,010 worth of insurance and I will sleep so much better.
- Also, it should be noted that, since we now have another year to sell, we will recoup that $1,600 when we sell 2028 short calls after the 2027 short calls expire.
-
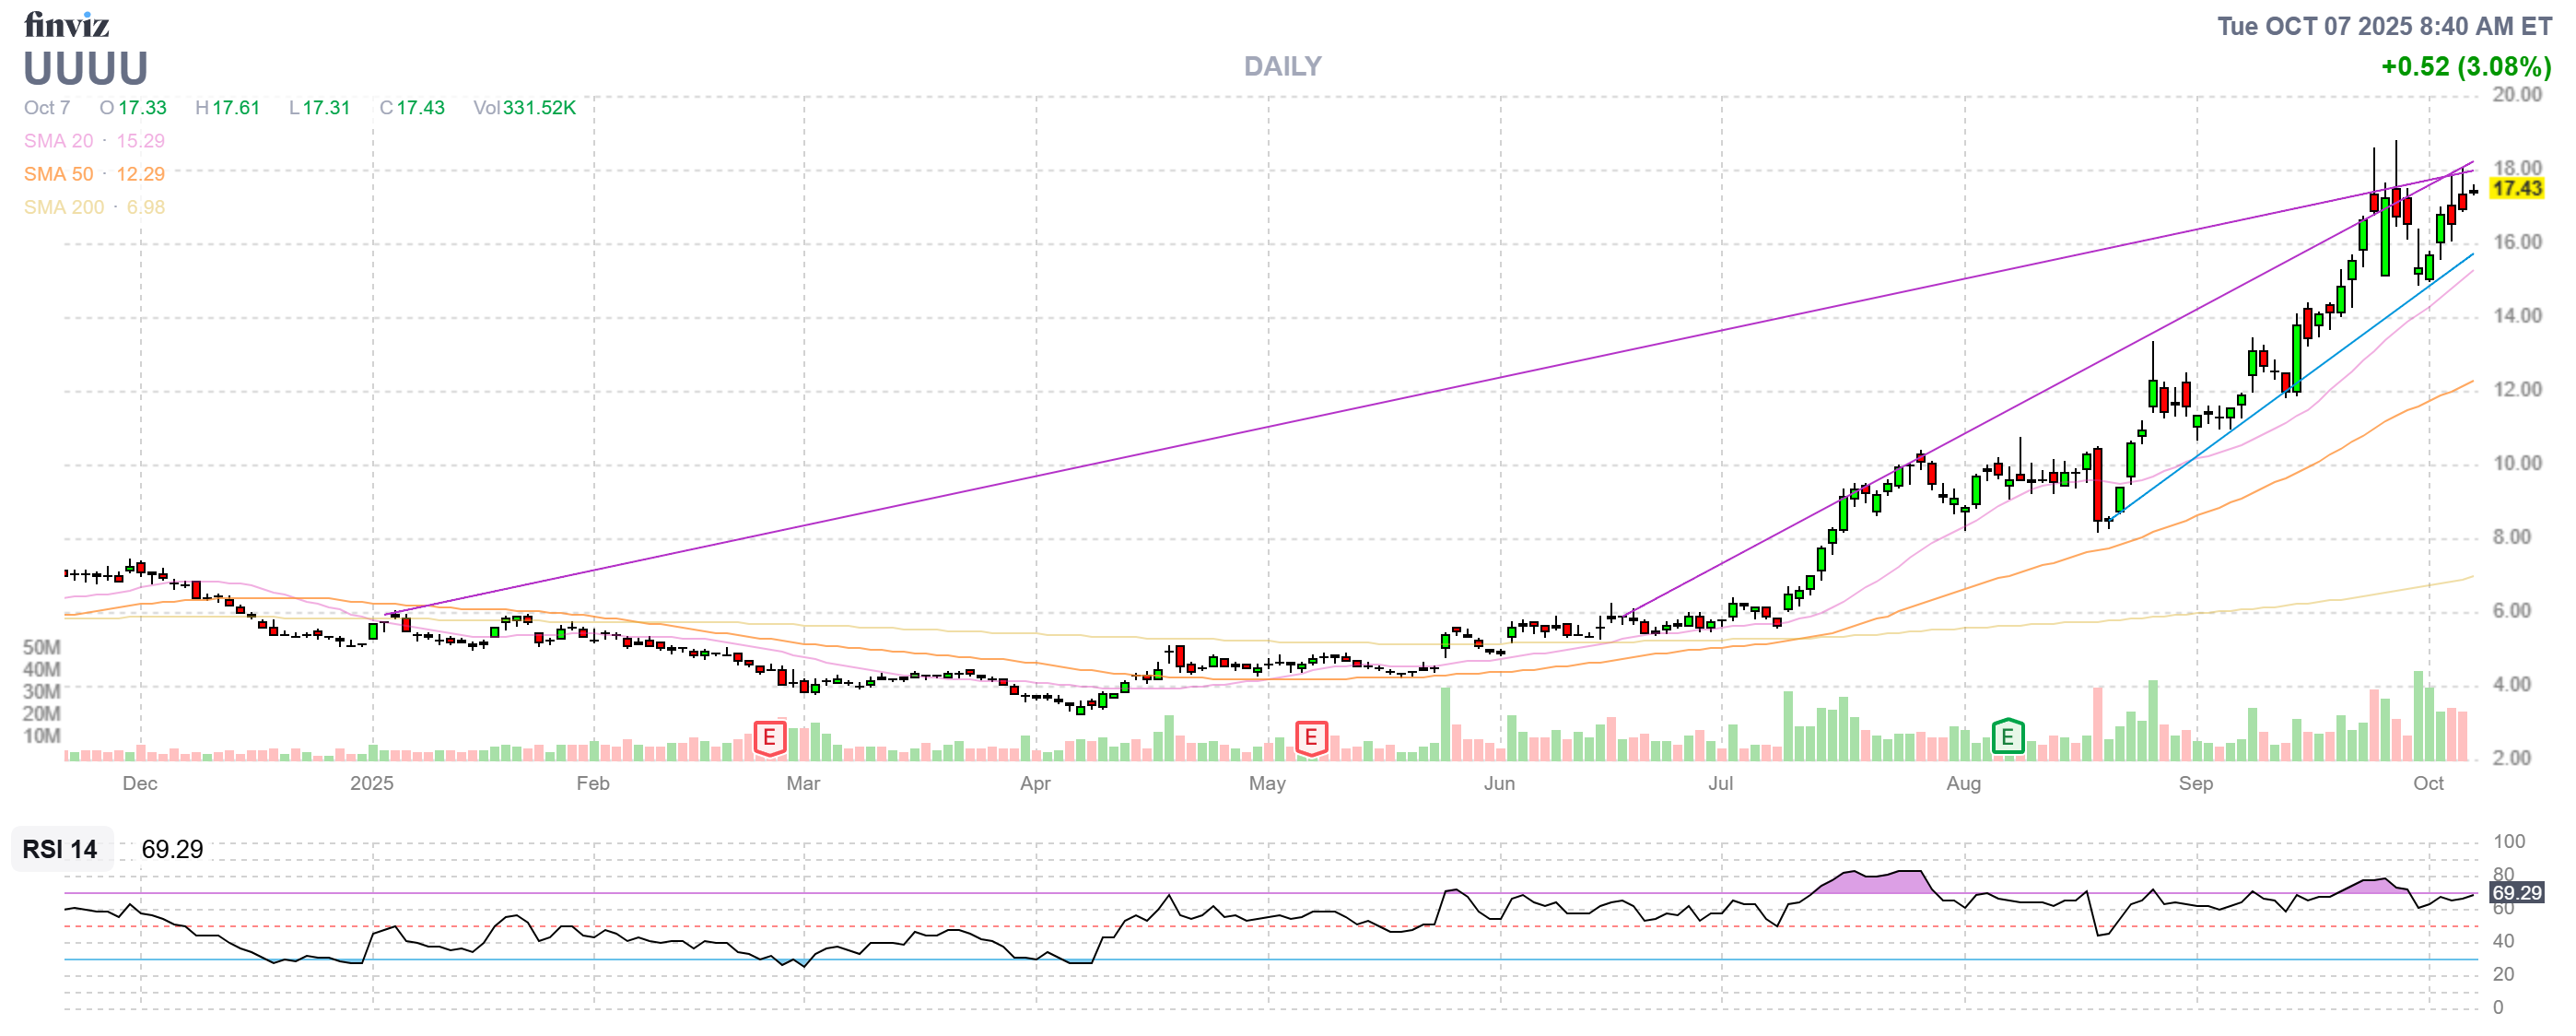
- UUUU – Uranium plus Rare Earths, seemed like a good idea at the time… Now we’re miles over target at net $5,800 on the the $10,000 spread so $4,200 (72%) left to gain and you would think I’d love it as a new trade but this price is silly (150x forward earnings) so I’m just happy we caught it early.
-
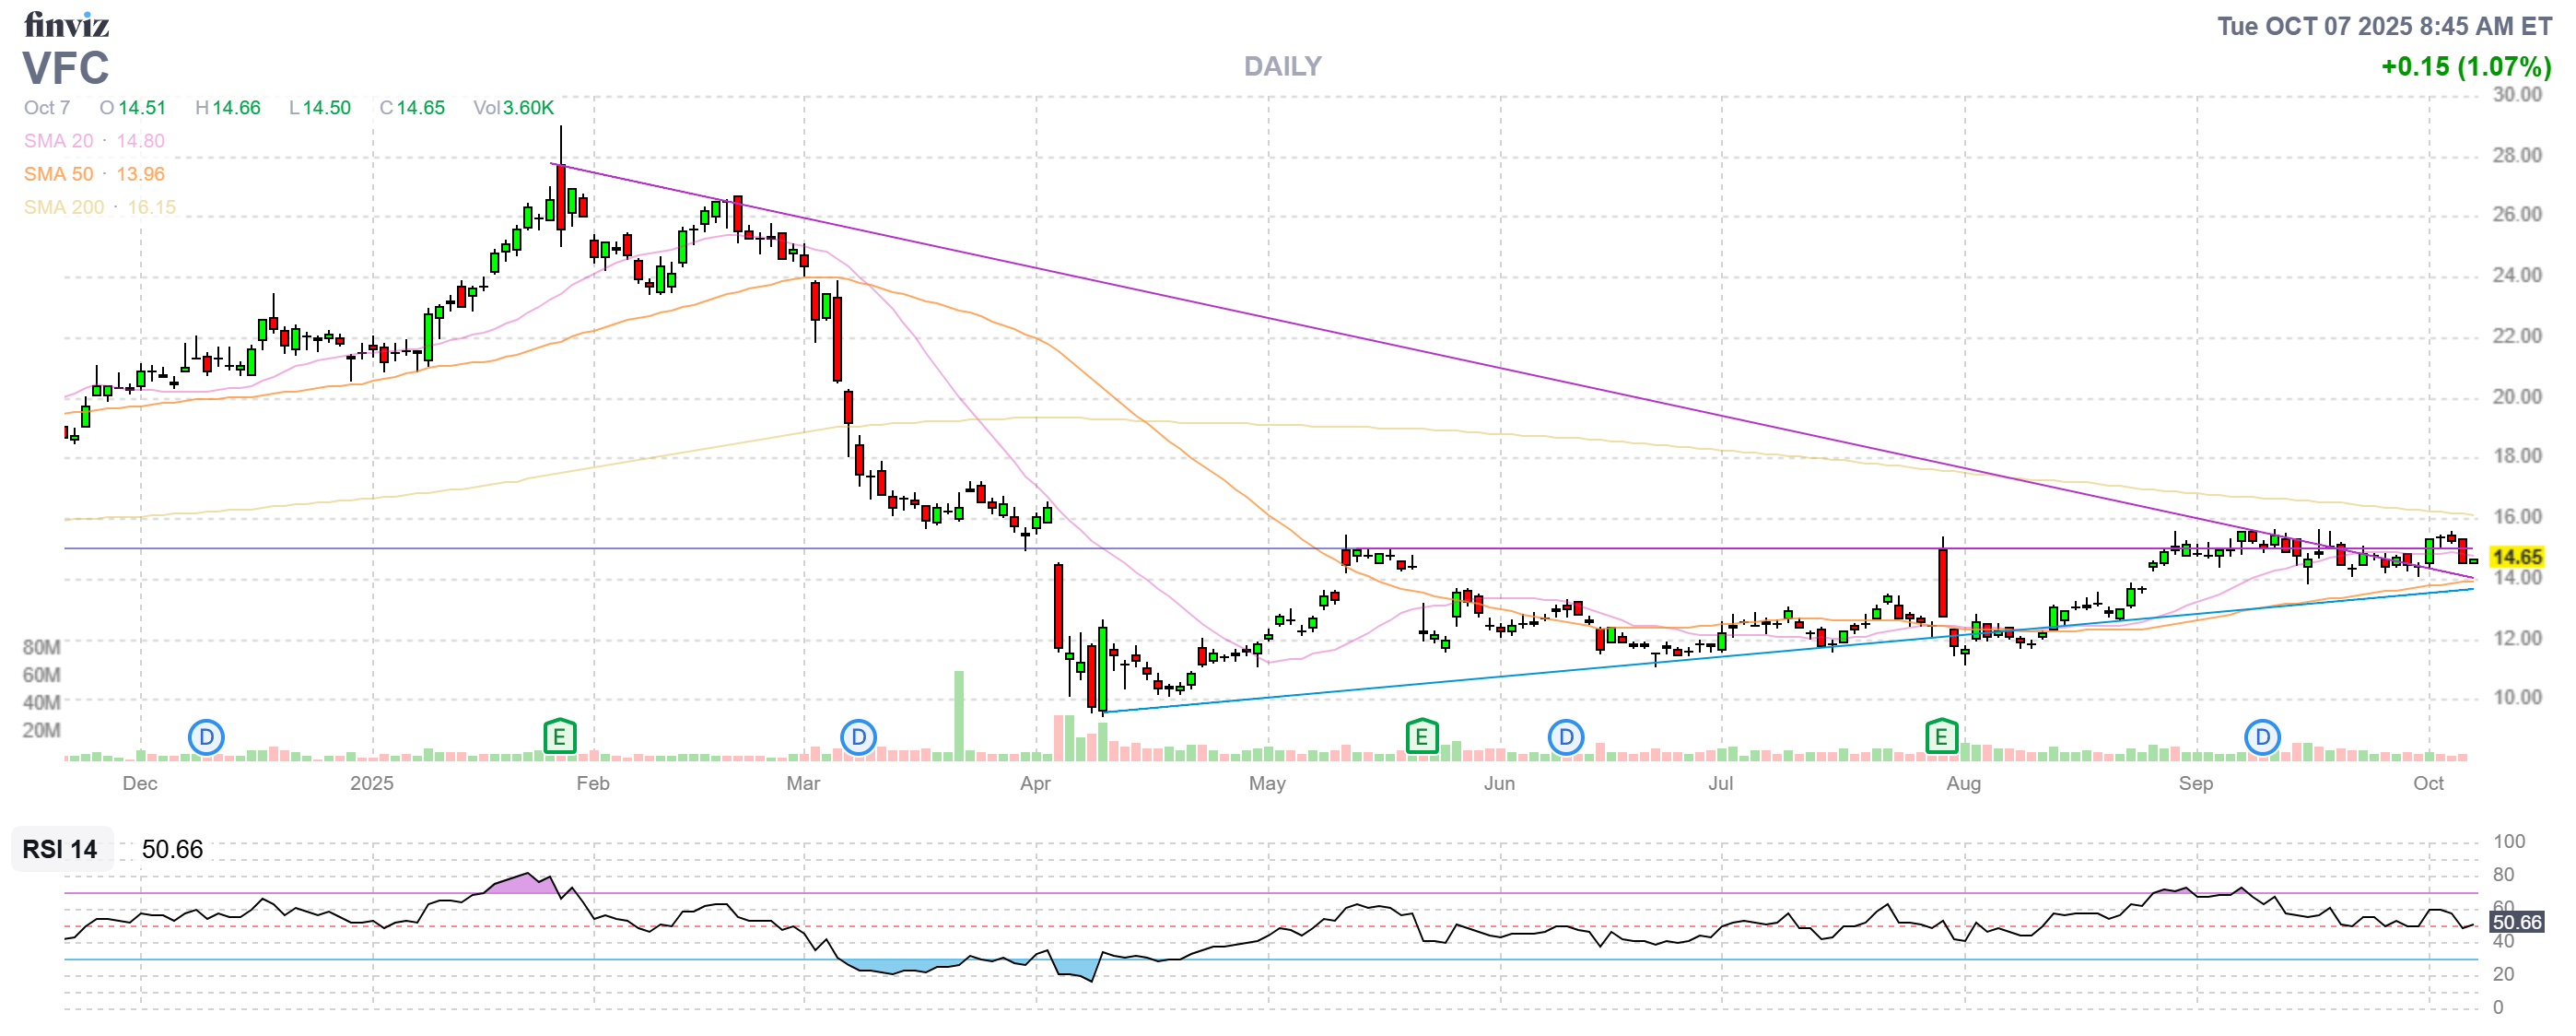
- VFC – On track at net $1,960 on the $5,000 spread with $3,040 (155%) left to gain. This one I do like for a new trade – earnings should give them a pop!
-
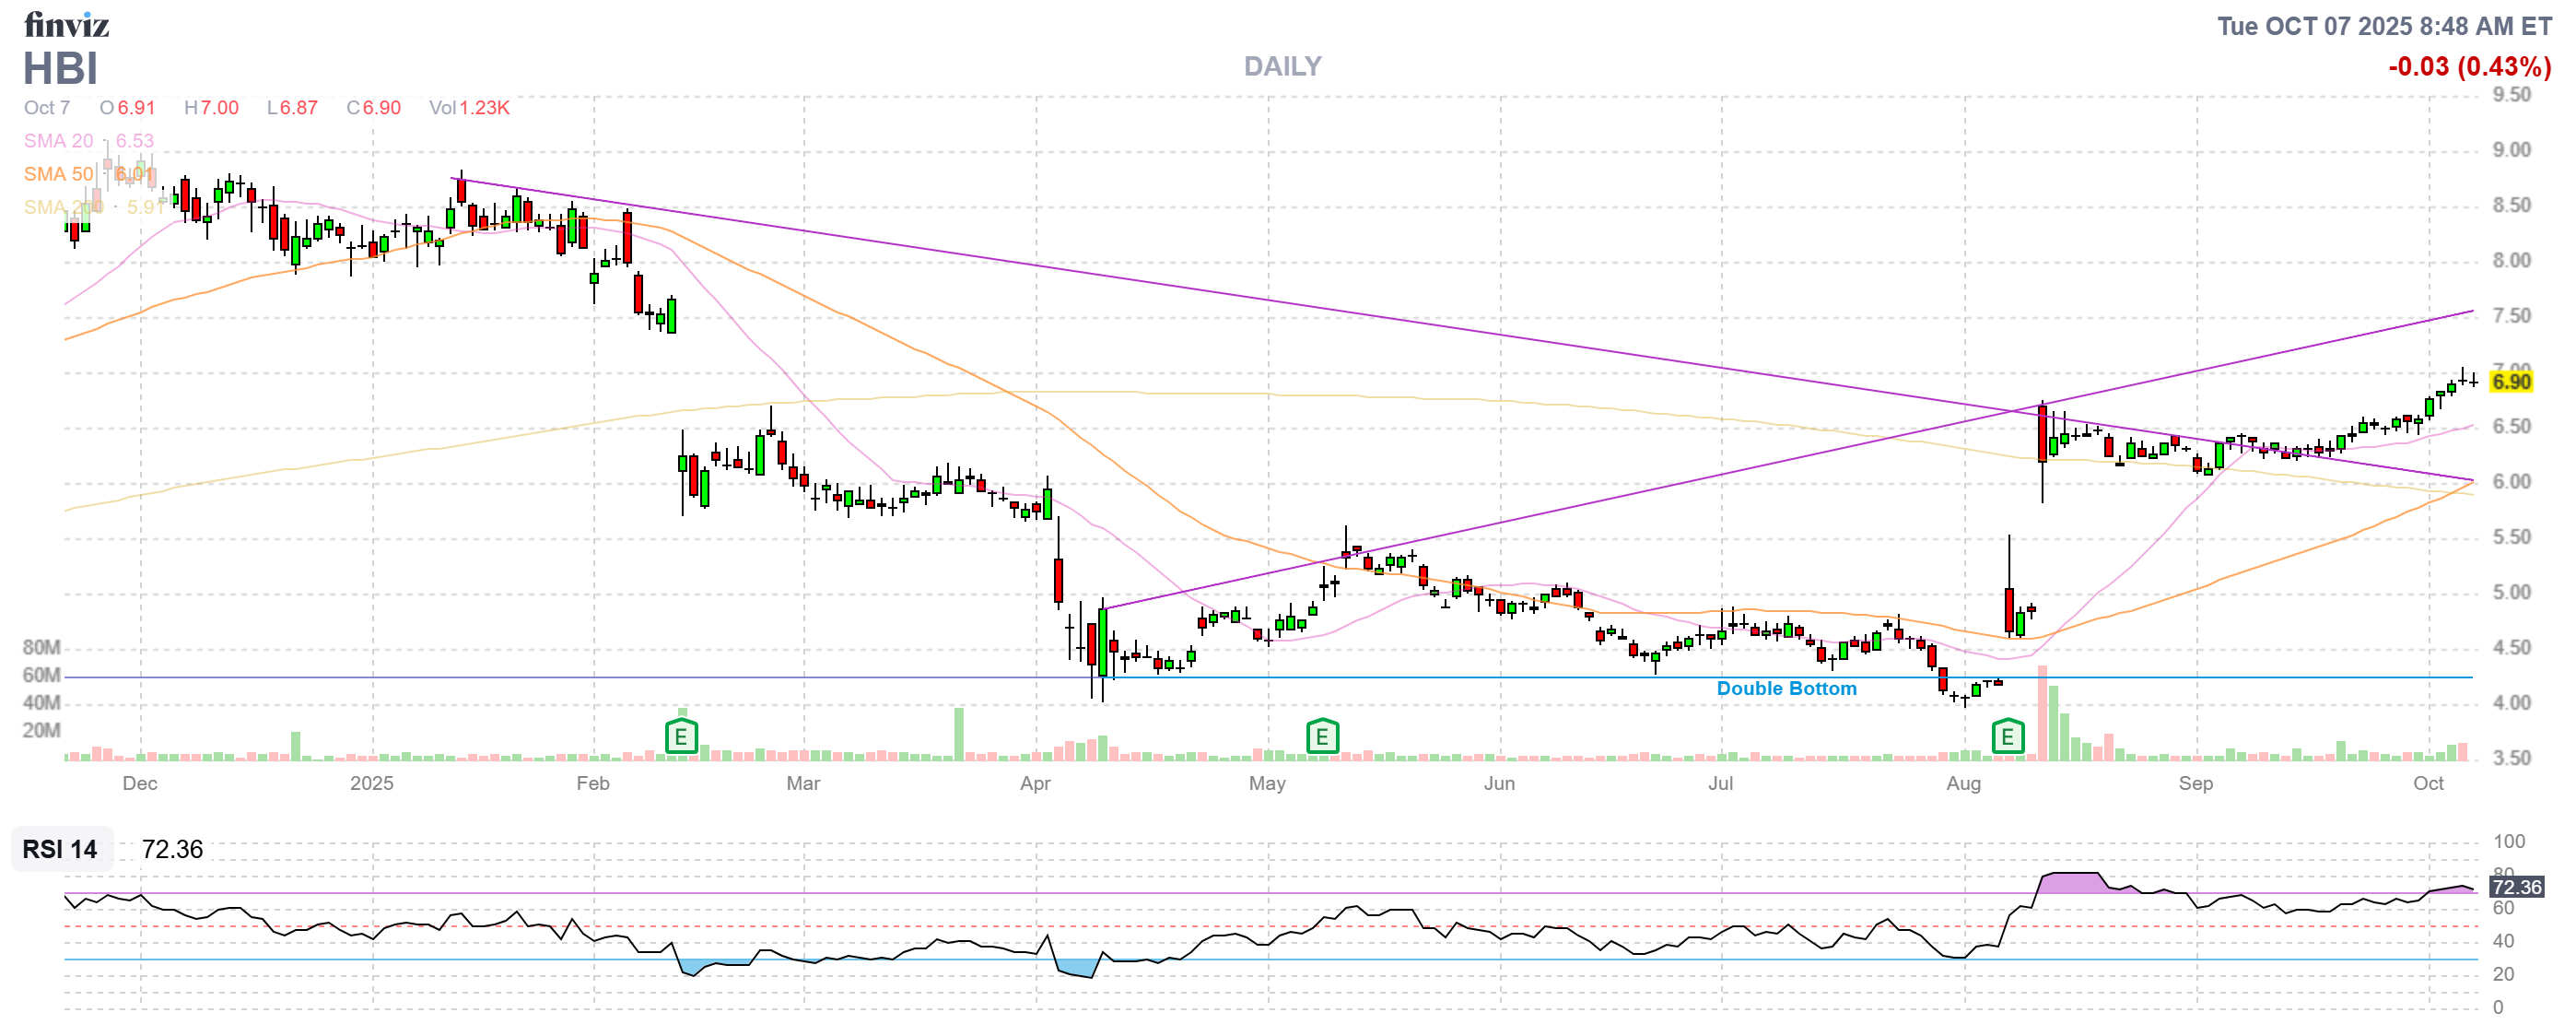
- HBI – These numbers are incorrect as HBI is getting bought for $2.2Bn by Gildan (Canada) for 0.102 of their stock plus 0.80 – so this $6.90, is about the right price. That means we can sell our 2027 $5 calls for $2.25 ($3,375) and we’ll have to buy back the Jan $5 calls for $2 ($2,000) and we’ll net $1,375, which is a tiny profit as the timing was unfortunate for us.
-
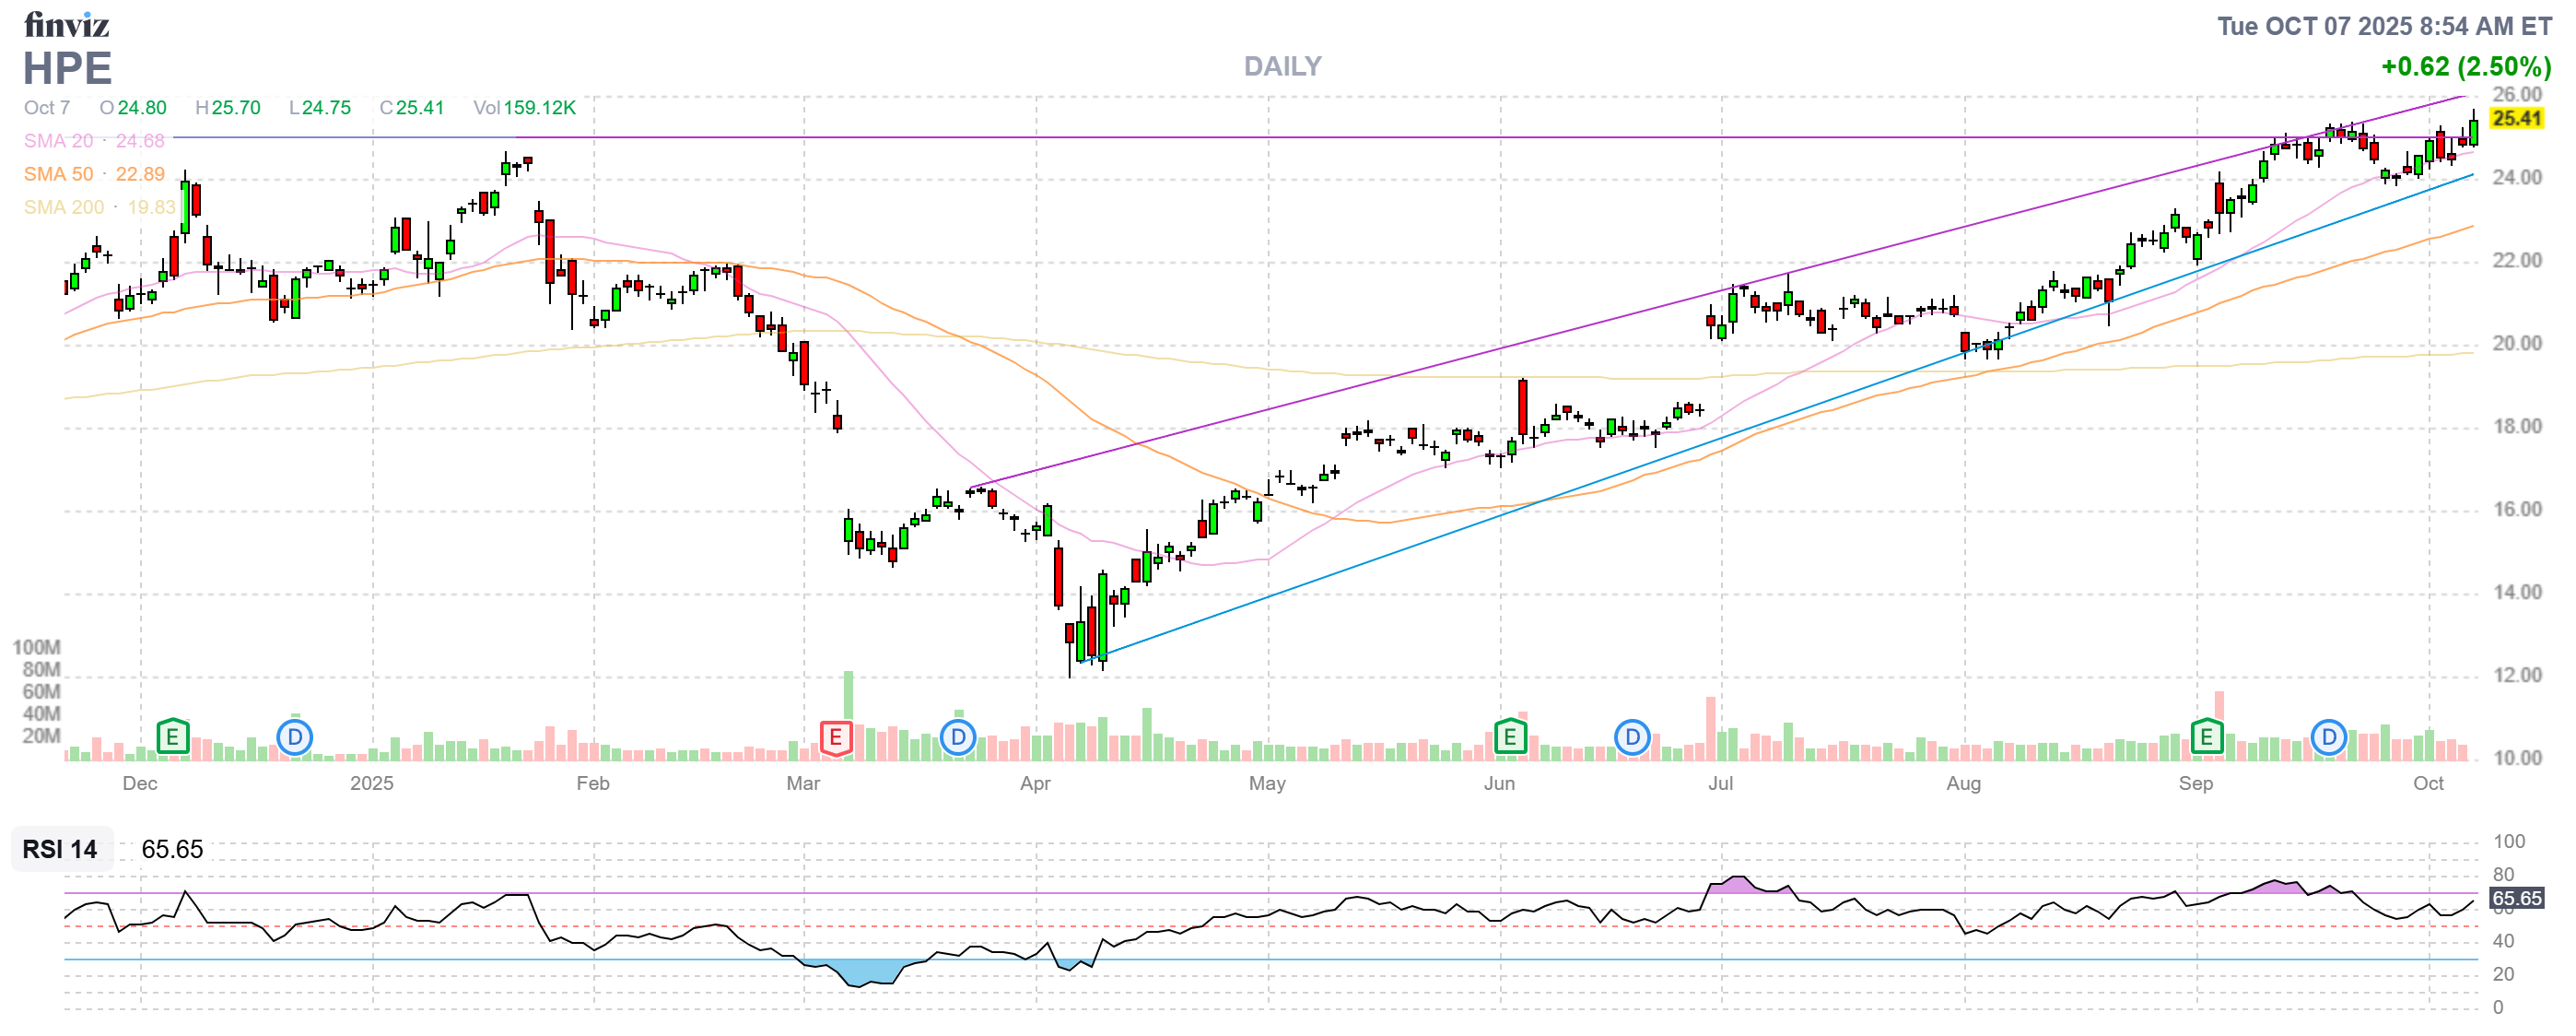
- HPE – Another one that blew past our targets. Here’s we’re at net $4,725 on the $4,000 spread and we COULD roll the short calls but let’s just take the money and run. We only paid net $790 for the spread from March so it’s a nice half a year’s work!
By the way, the $700/Month Portfolio is for non-margin IRA and 401K players and, of course, for young people looking for the discipline to make those steady, monthly contributions that will set them up for retirement but you can play it with $7,000/month (10x) or $3,500 (5x) or $1,400/month or $70,000/month – just keep the scales in proportion if you are looking to work with bigger positions!
-
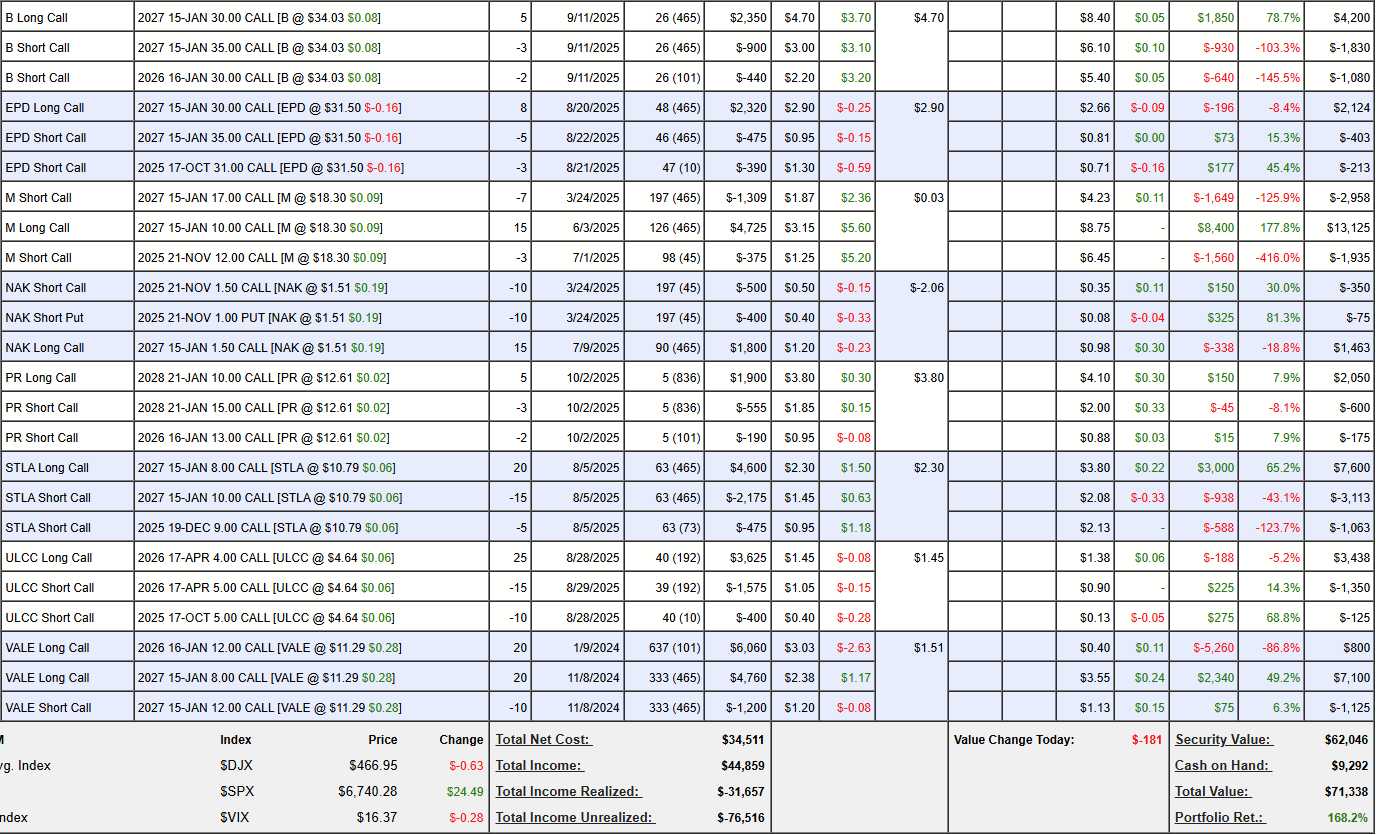
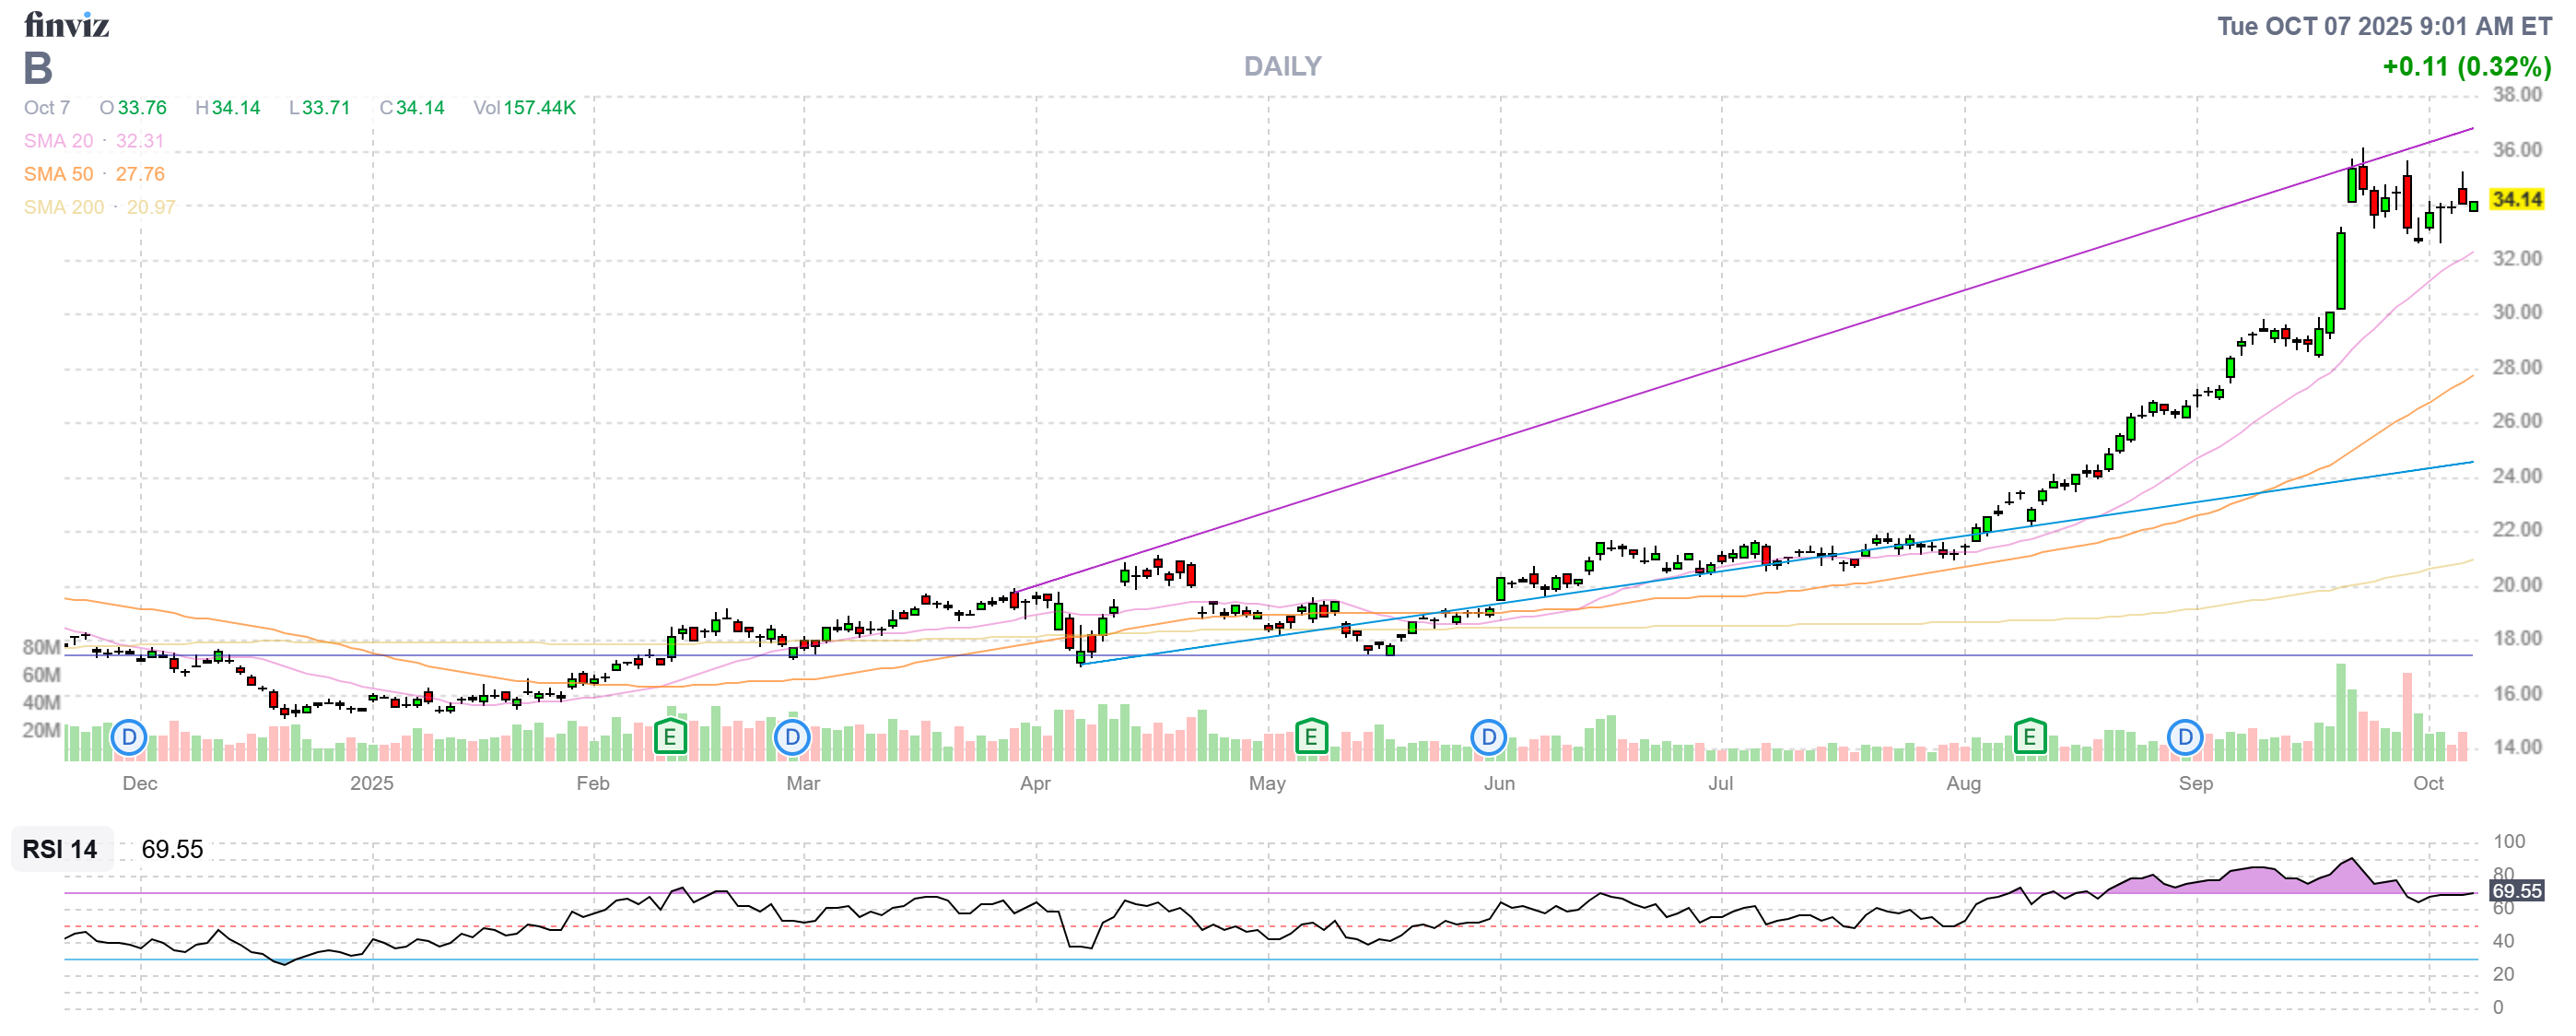
- B – This is new B as we cashed out old B last month and thank goodness we still own gold! This is another one where the premiums are misleading, we’re on track to hit our $2,500 at net $1,290 so $1,210 (93%) left to gain and great for a new trade (though higher Jan short calls, of course).
-
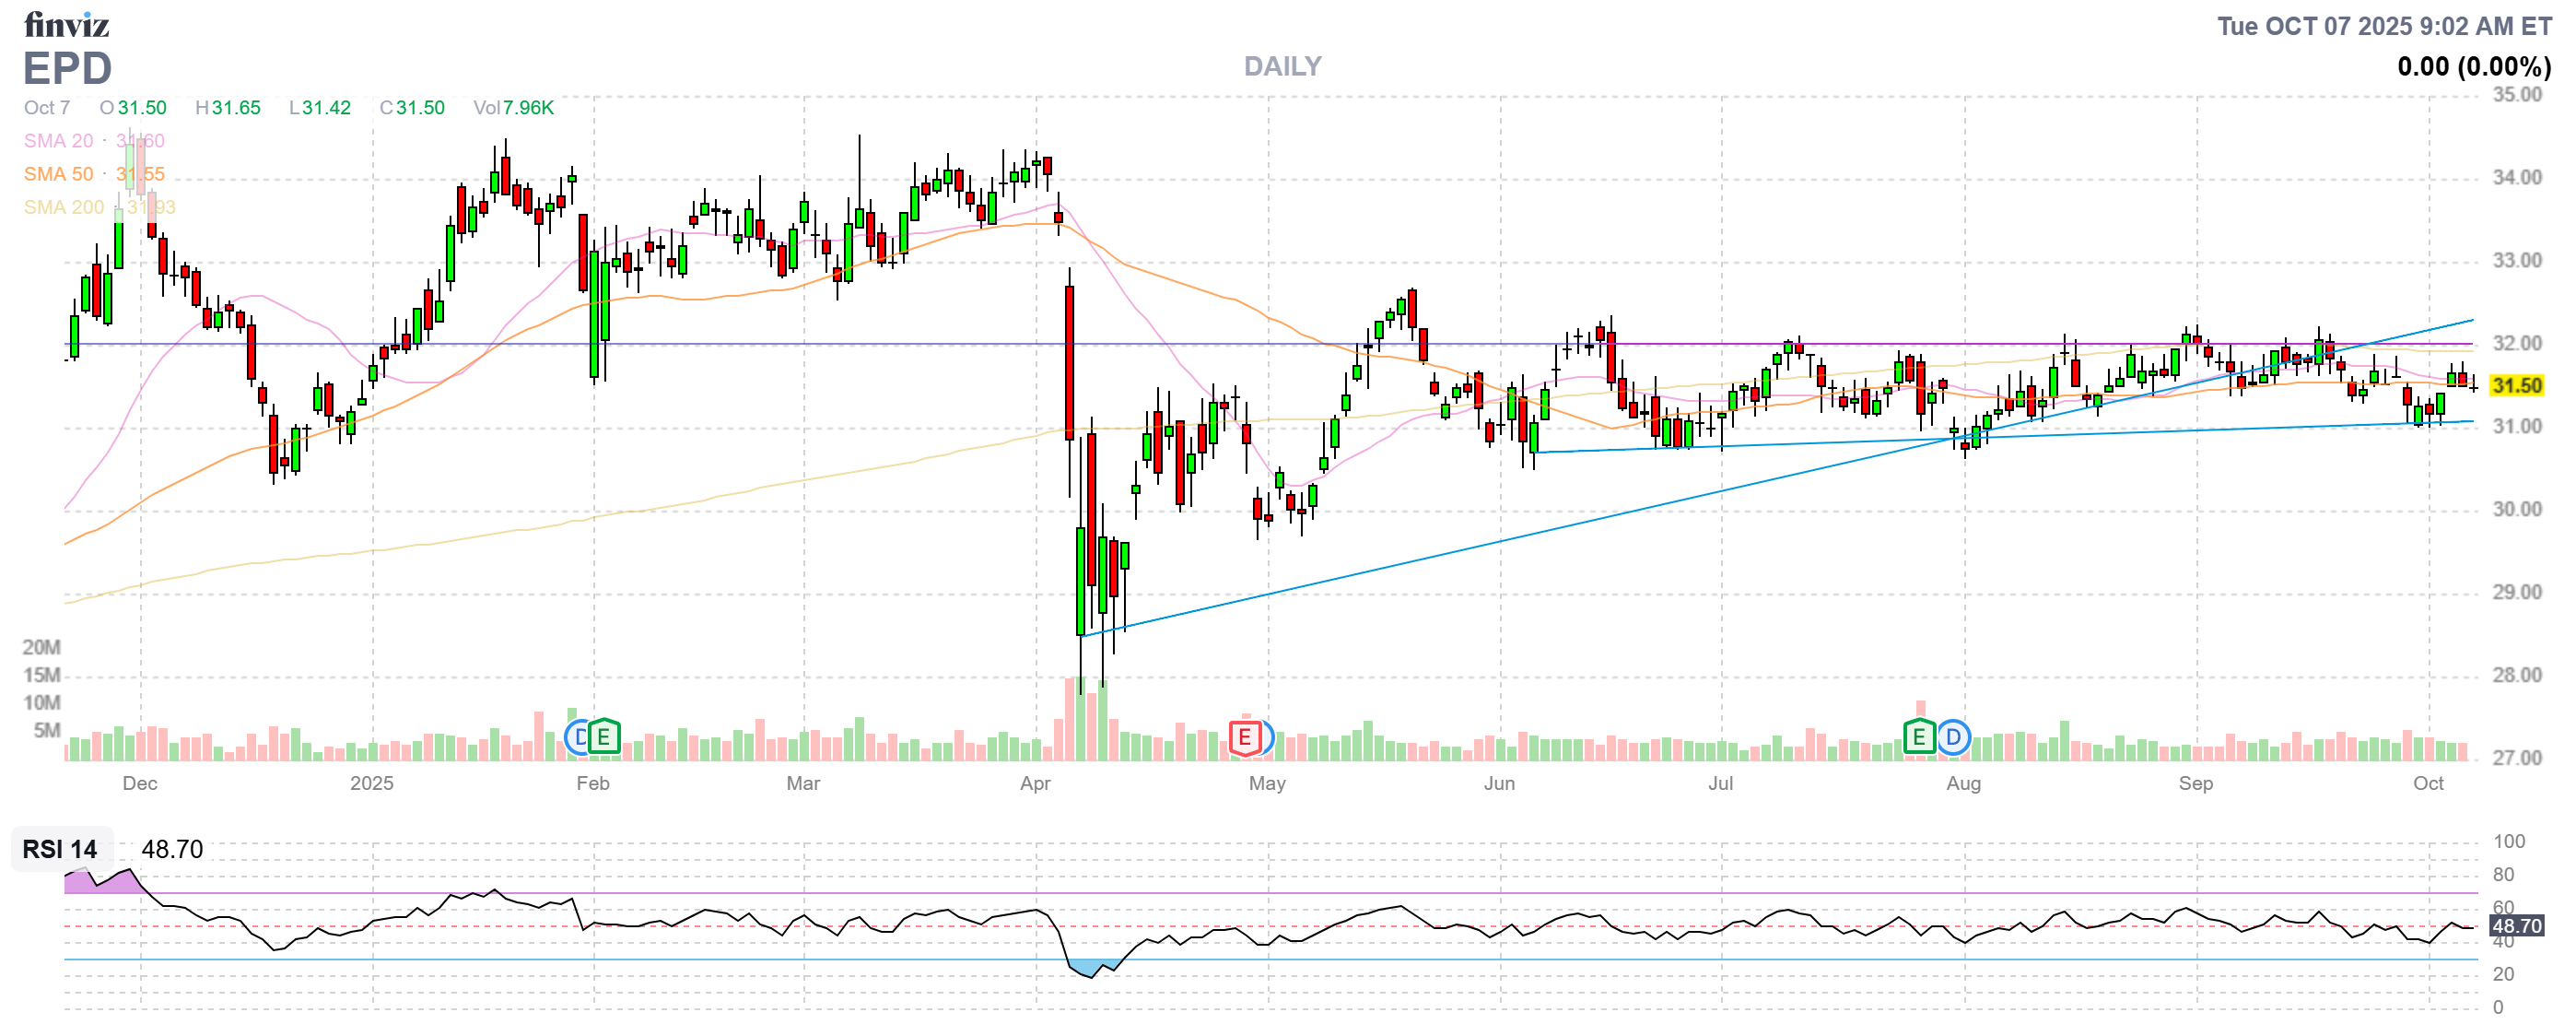
- EPD – Good for a new trade at net $1,508 on the $4,000 spread with $2,492 (165%) left to gain. Our first short sale went OK and we’ll roll the Oct $31 calls (now 0.71) to Jan $32s (now 0.75) for about even but no hurry until they expire next Friday.
-
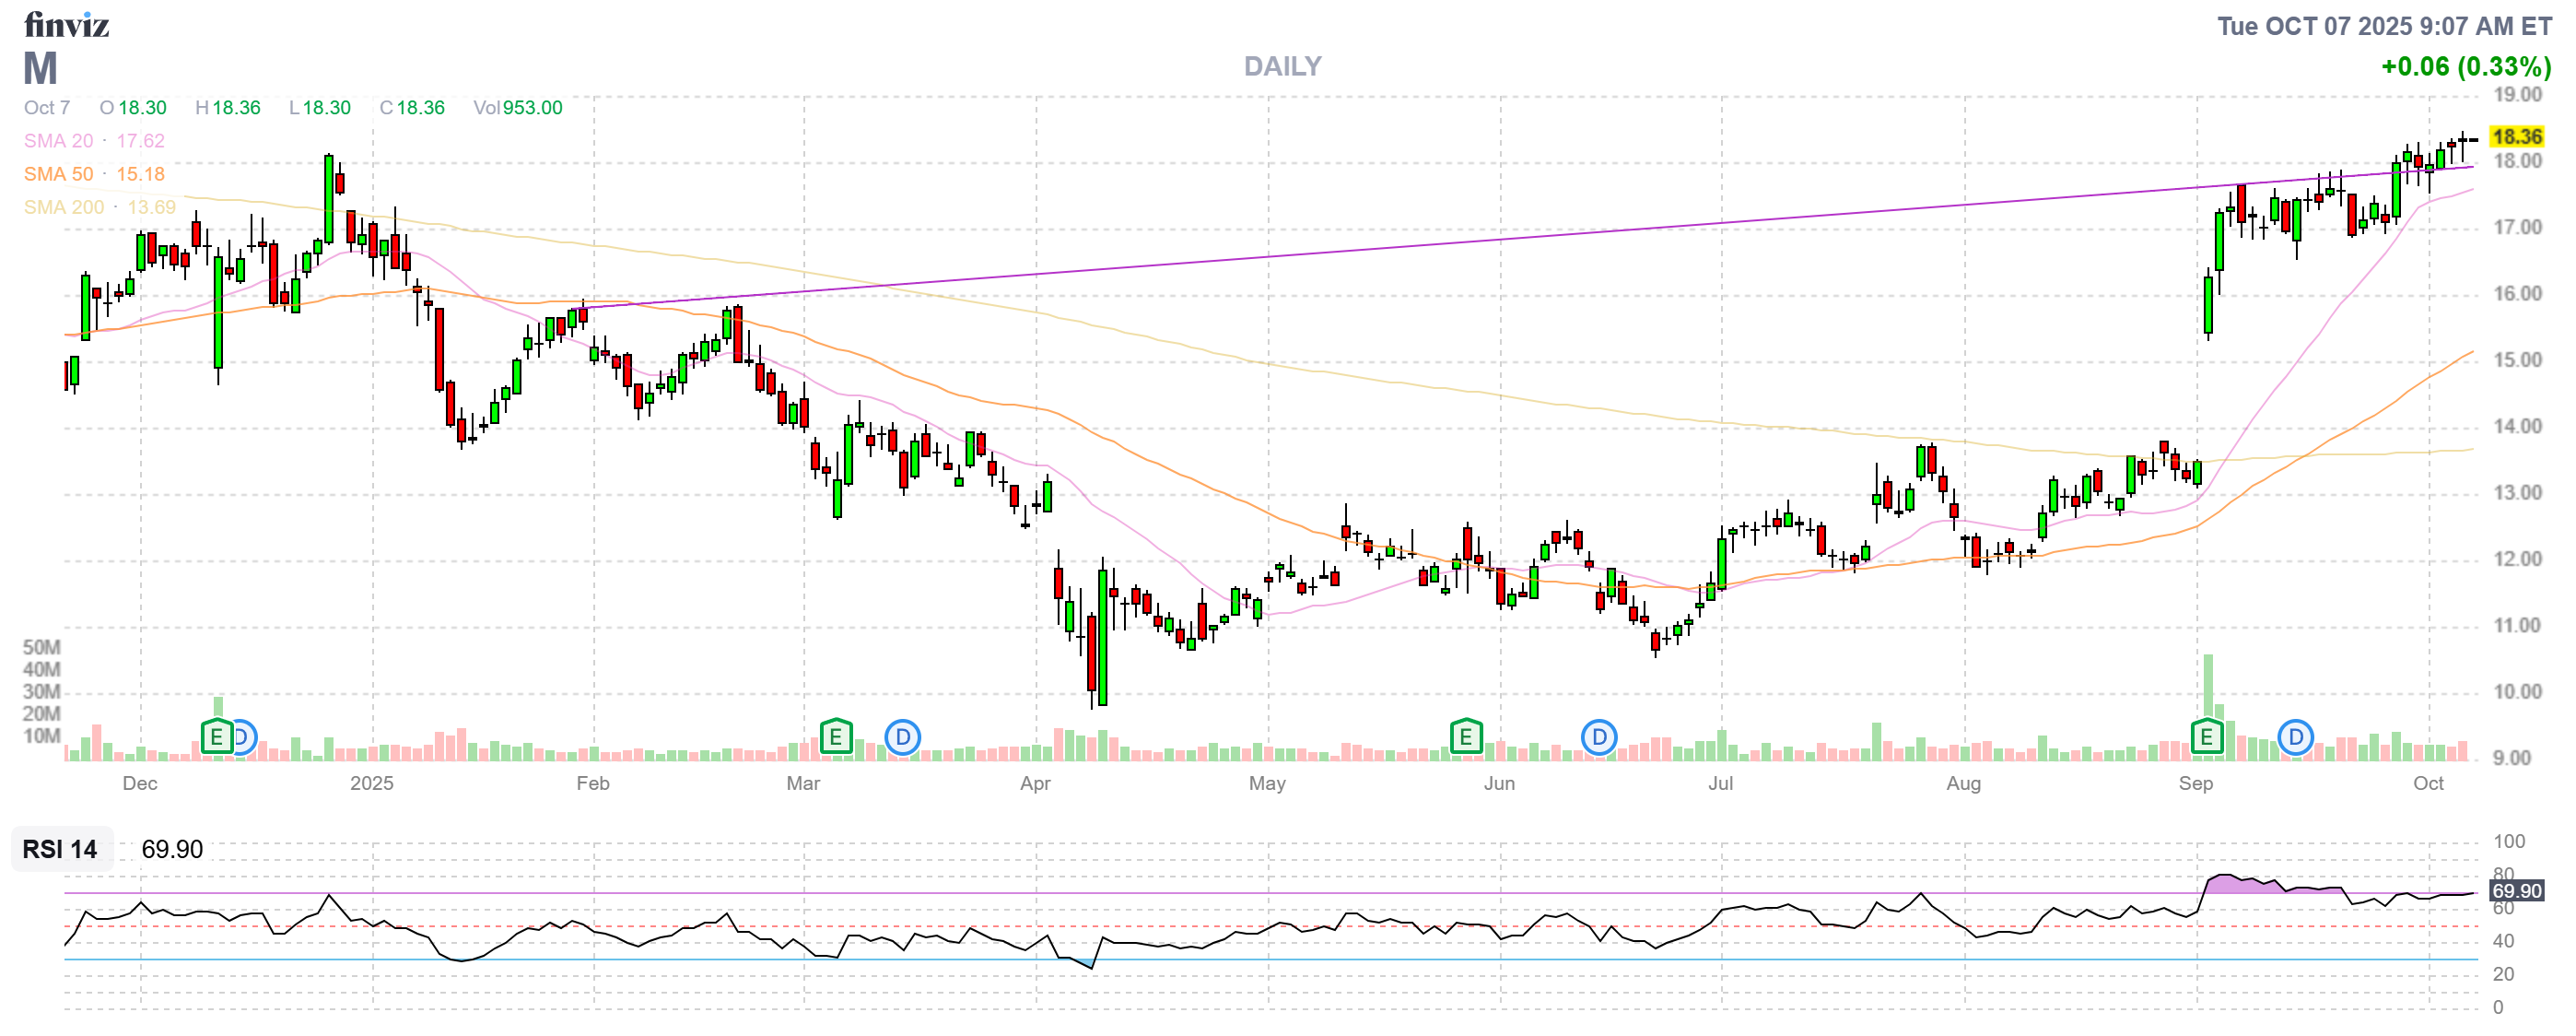
- M – Yet another one that blasted over our target. Fortunately, we weren’t fully covered and now it’s net $8,232 on the $10,500 spread but I think we can find better use for the money – so let’s cash this one out!
-
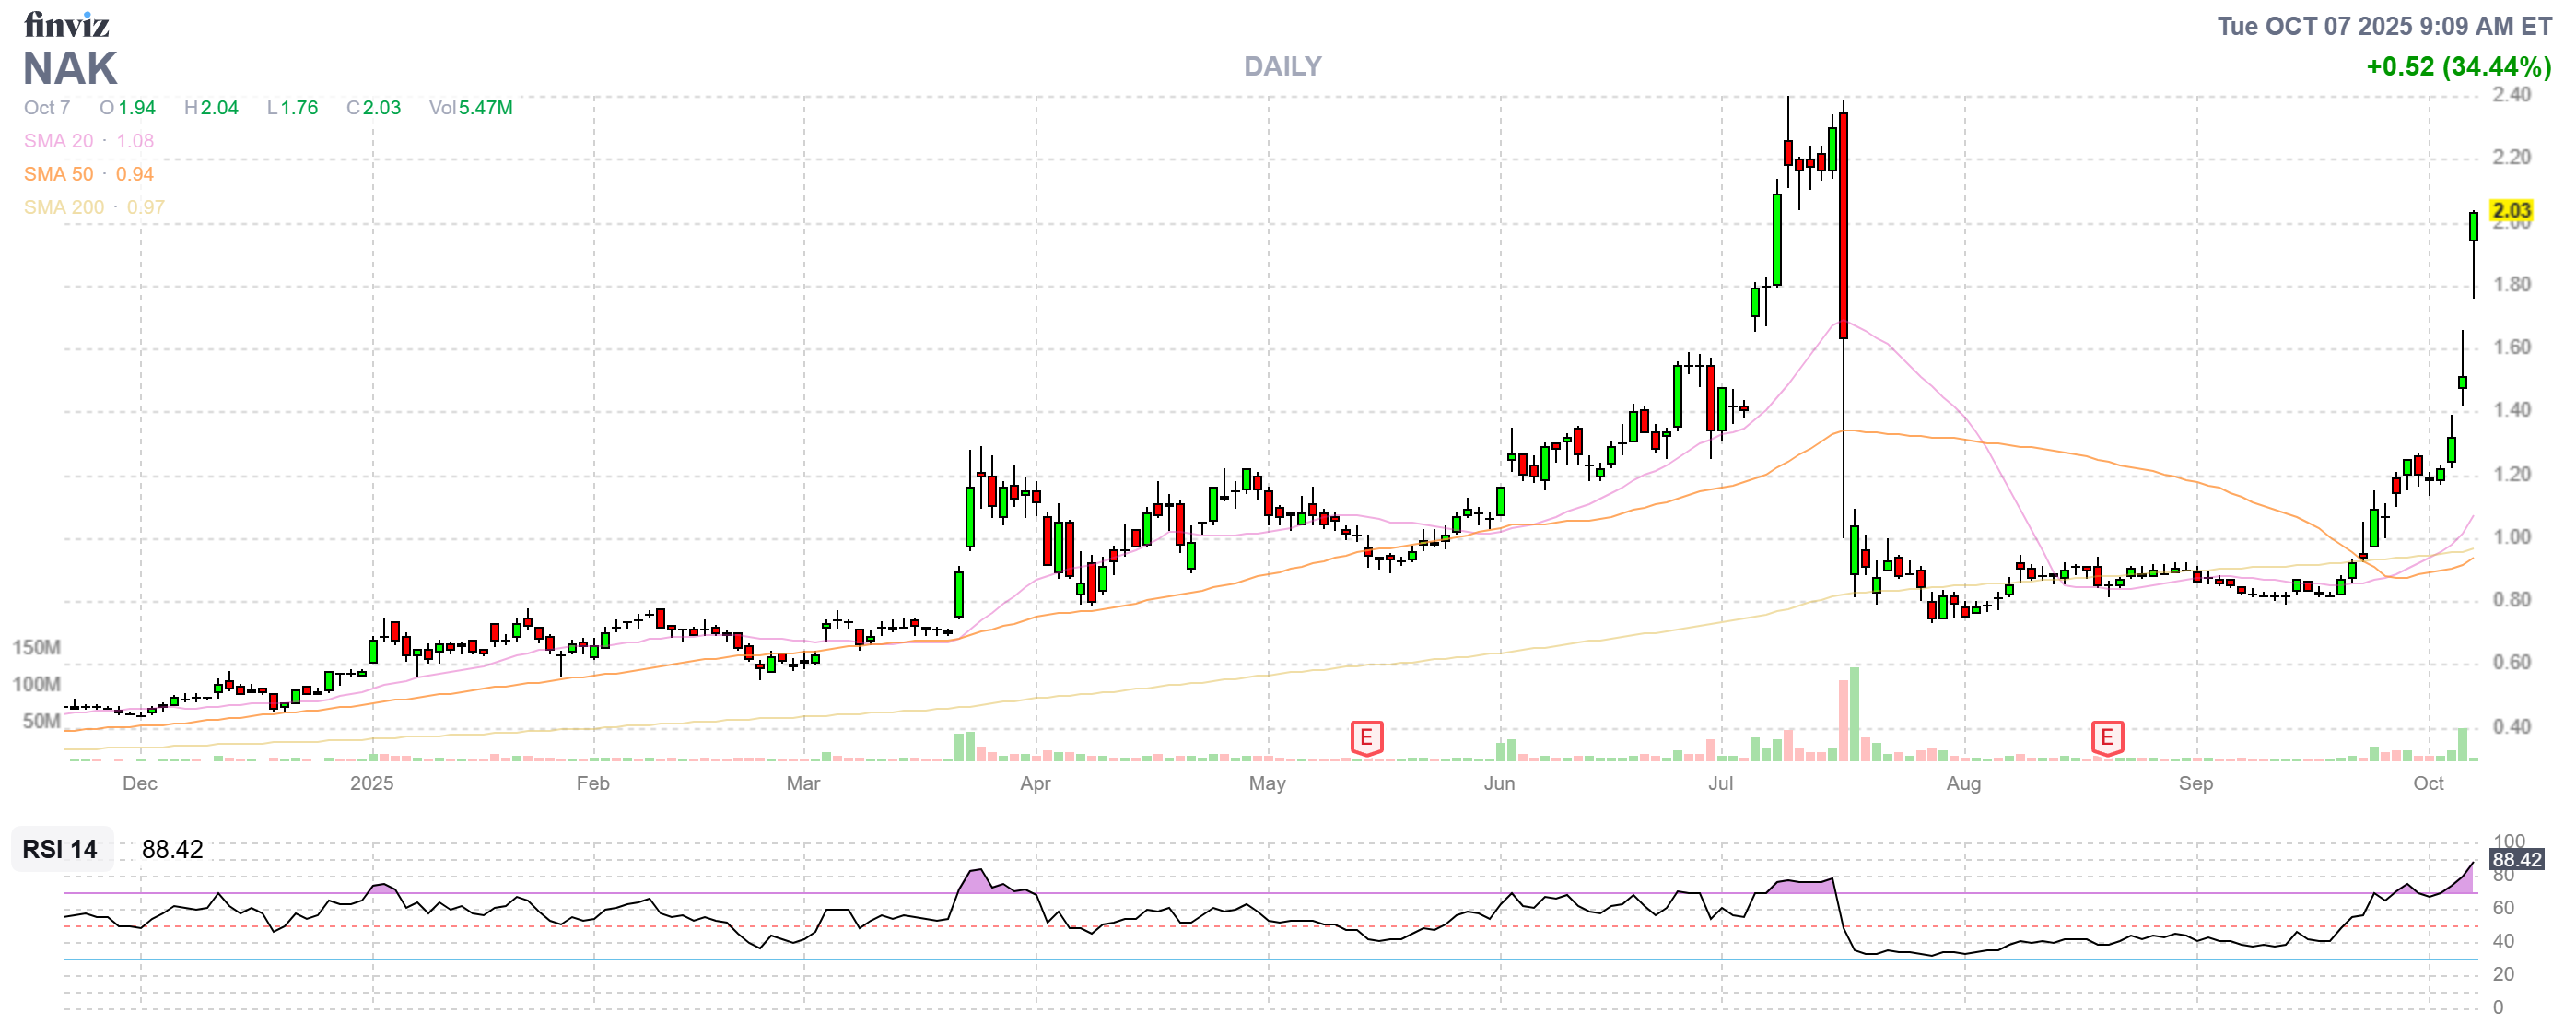
- NAK – Our second time playing this one and it took off again! And we were only partly covered AND this is the only position we sold puts against – what fun!!! Net $1,038 is not worth taking off the table and we’ll see how things look next month.
-
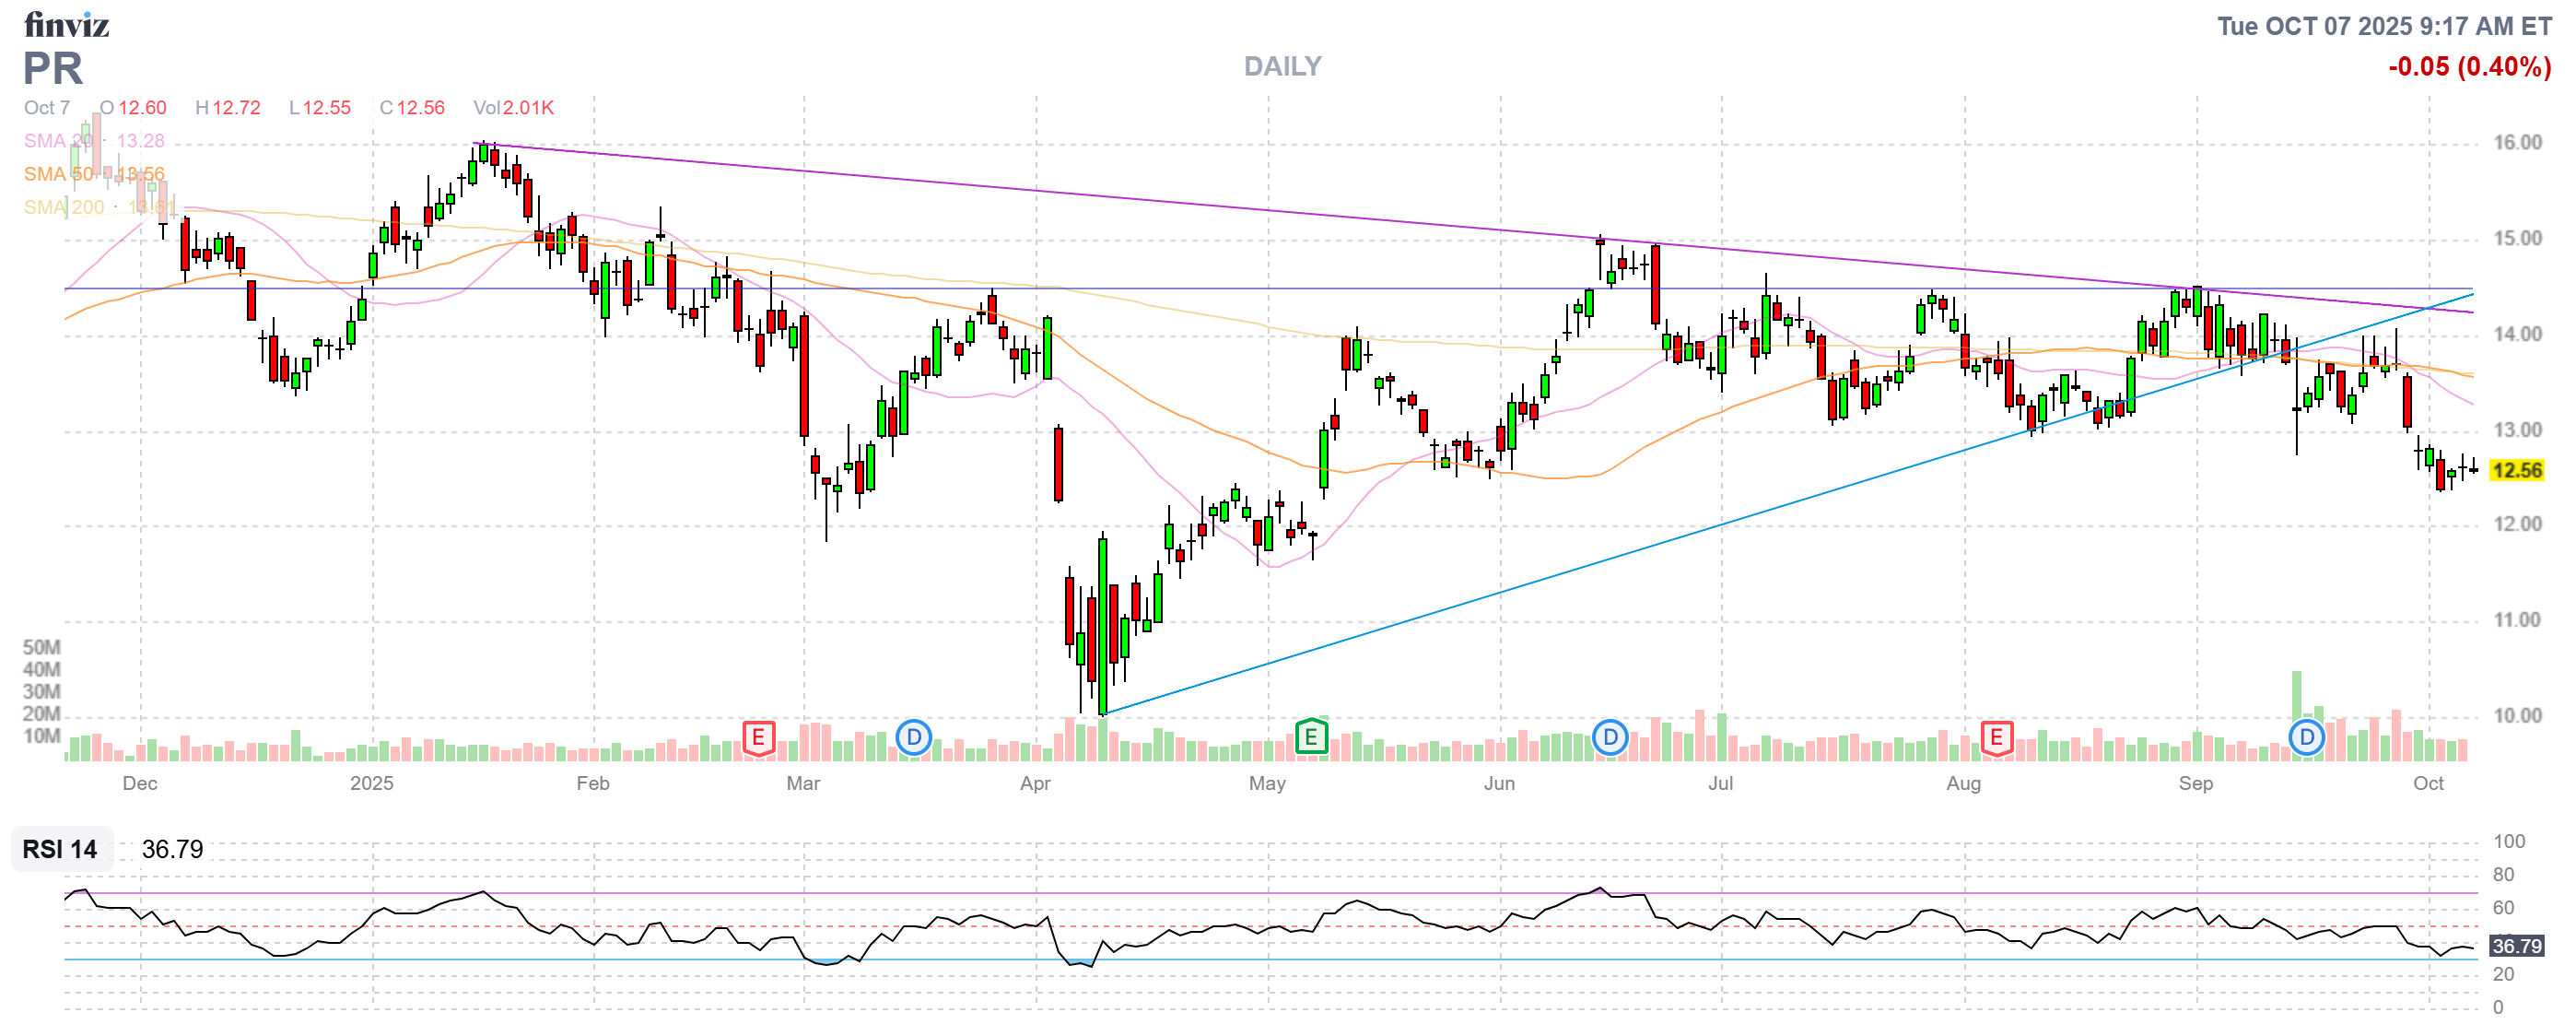
- PR – Still has that new trade smell at net $1,275 on the $5,000 spread that’s right on track so $3,725 (292%) left to gain is EXCELLENT for a new trade – of course!
-
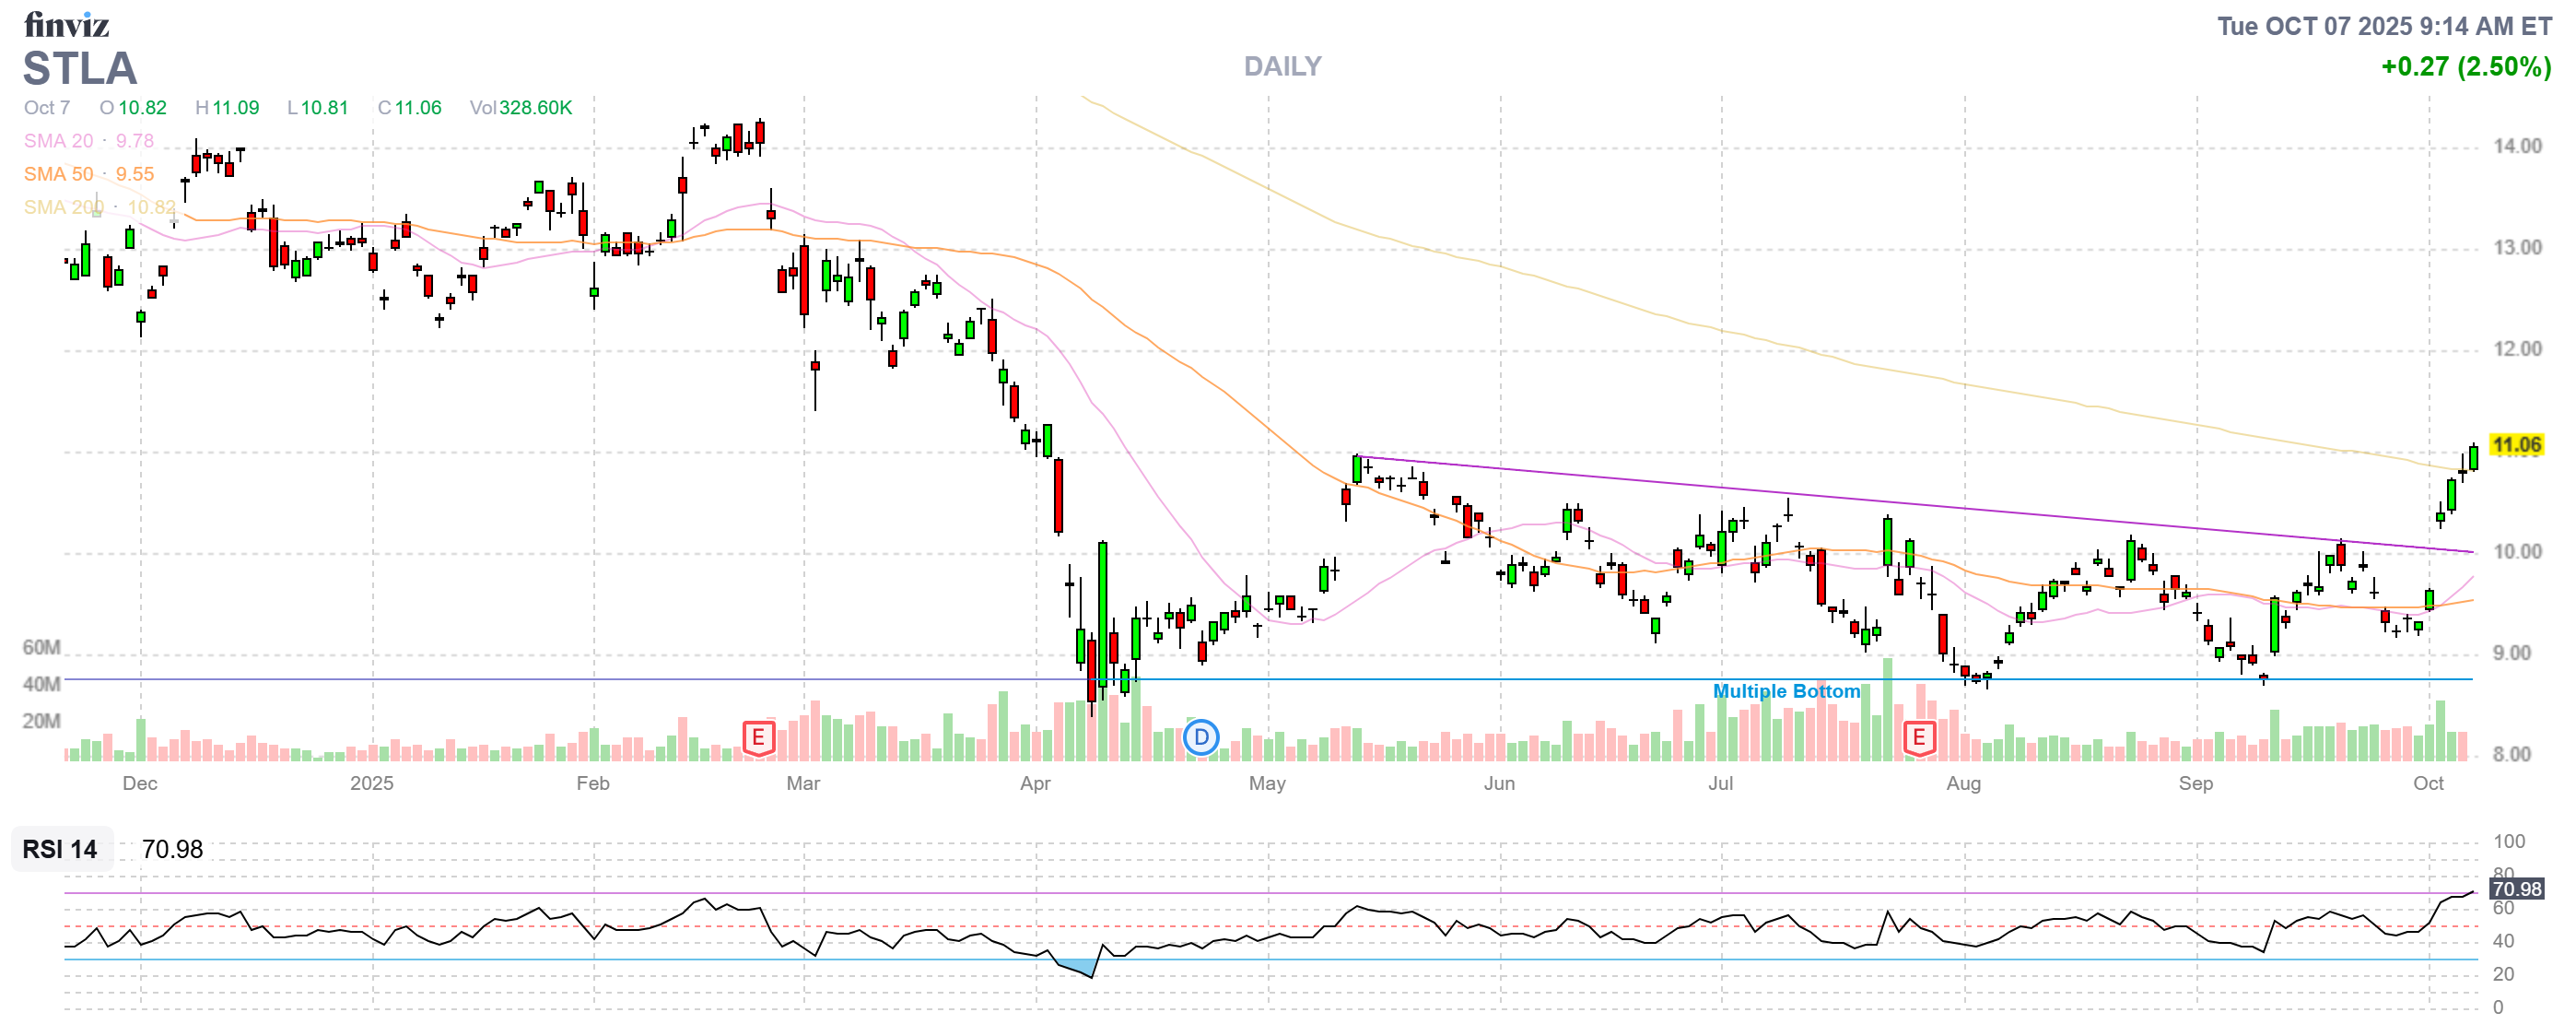
- STLA – Even the CAR Companies we pick blast off! If this wasn’t such a bull market, I’d have a big ego about this… Net $3,424 on the $4,000 spread is only up $500 but do we want to wait 15 months to make $576 more? No thanks – cash it out.
-
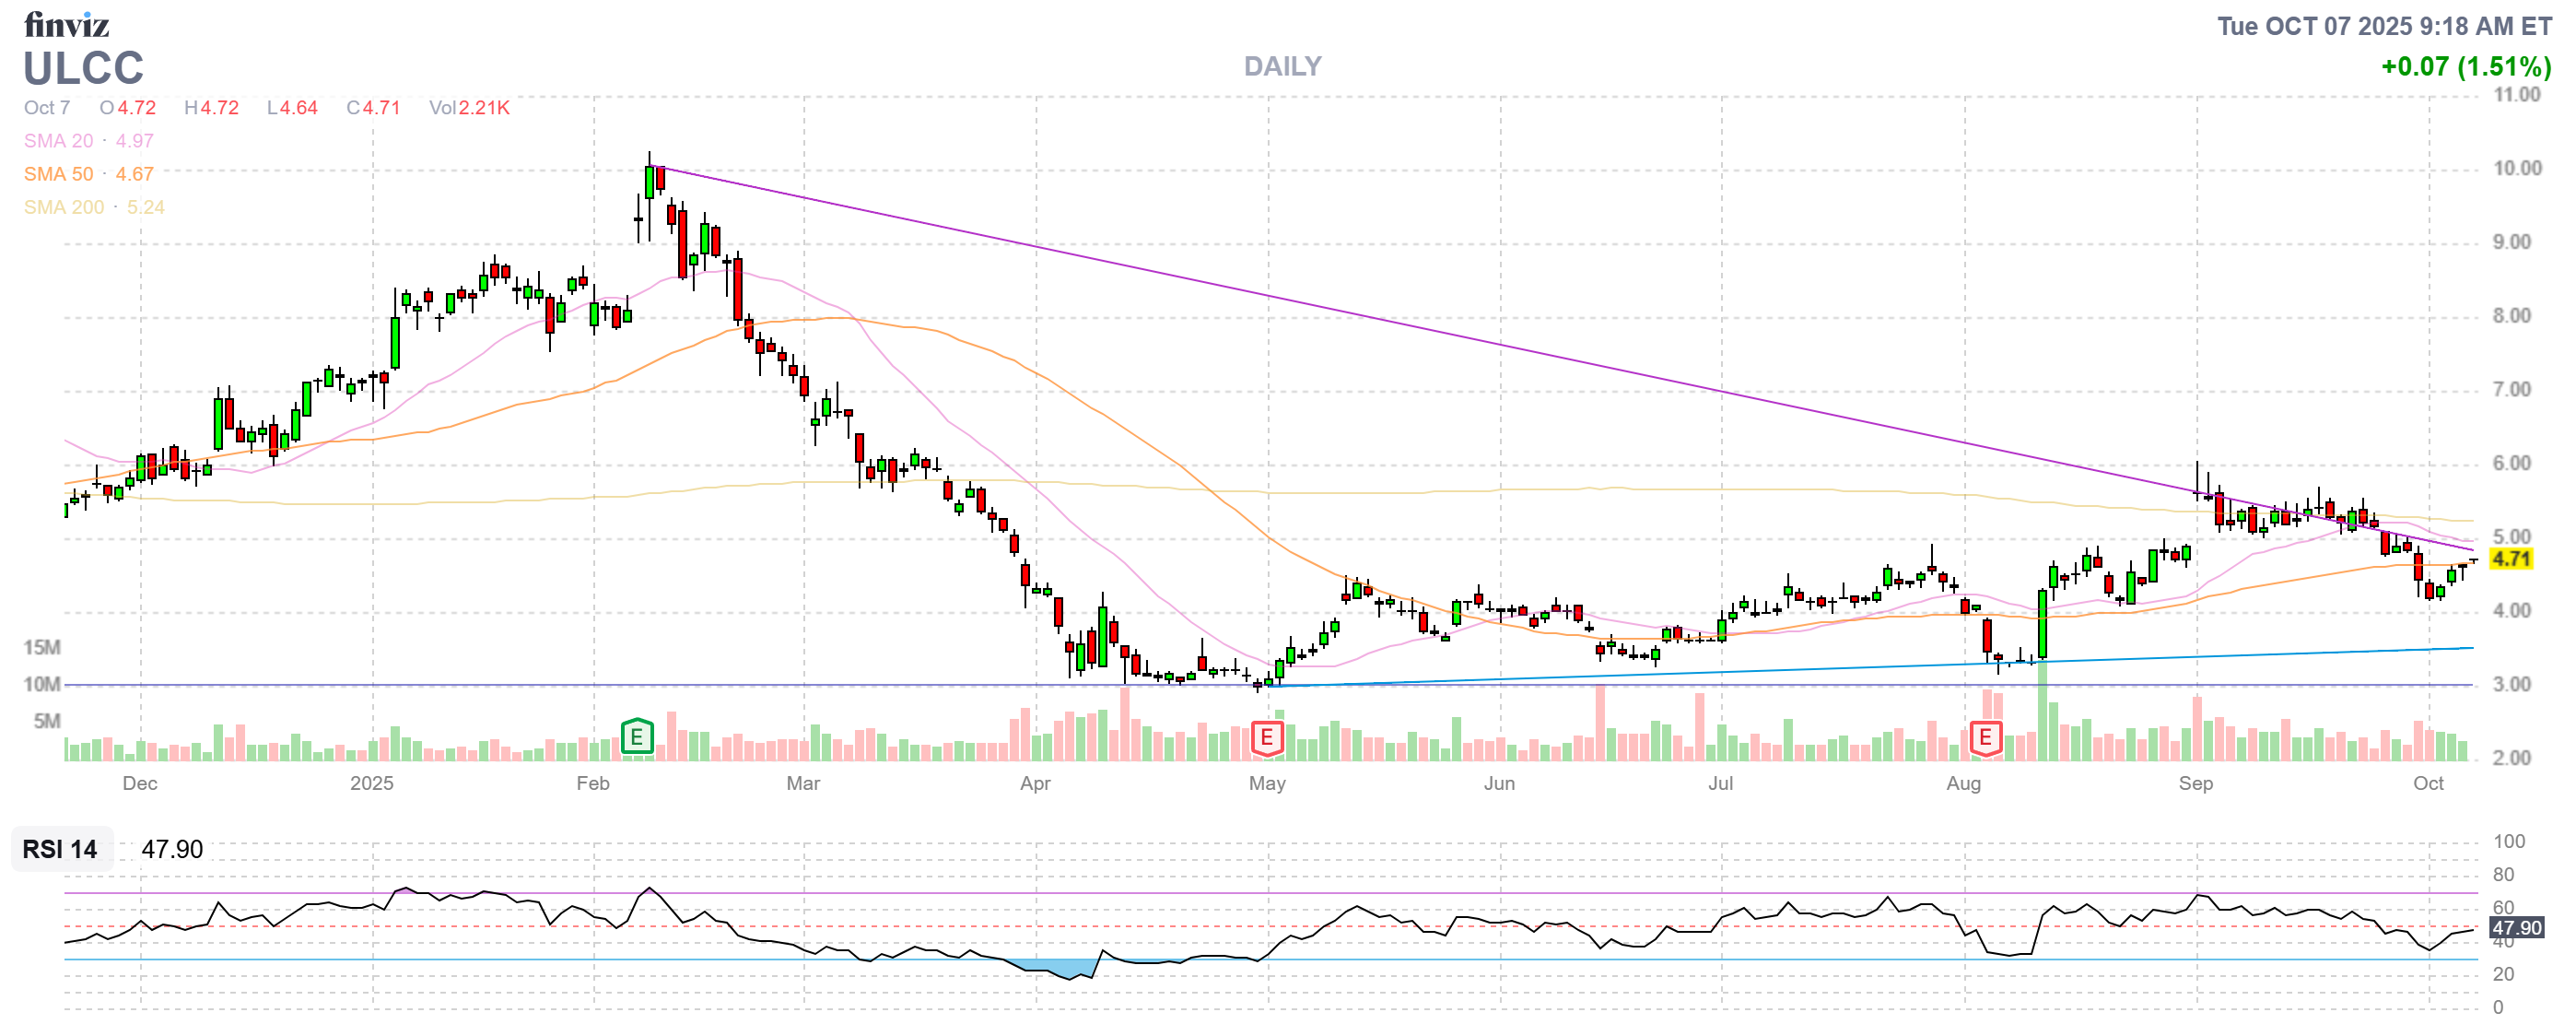
- ULCC – We bought them because Spirit was busting out and we figured it would benefit Frontier. So far, so good and we’ll see how earnings go. We’re going to roll the short Oct $5 calls (0.13) to the Jan $5 calls at 0.70 ($700) and this is a nice income play so also good for a new trade at net $1,388 (selling the Jans) with $1,112 (80%) left to gain PLUS some income next year as well.
-
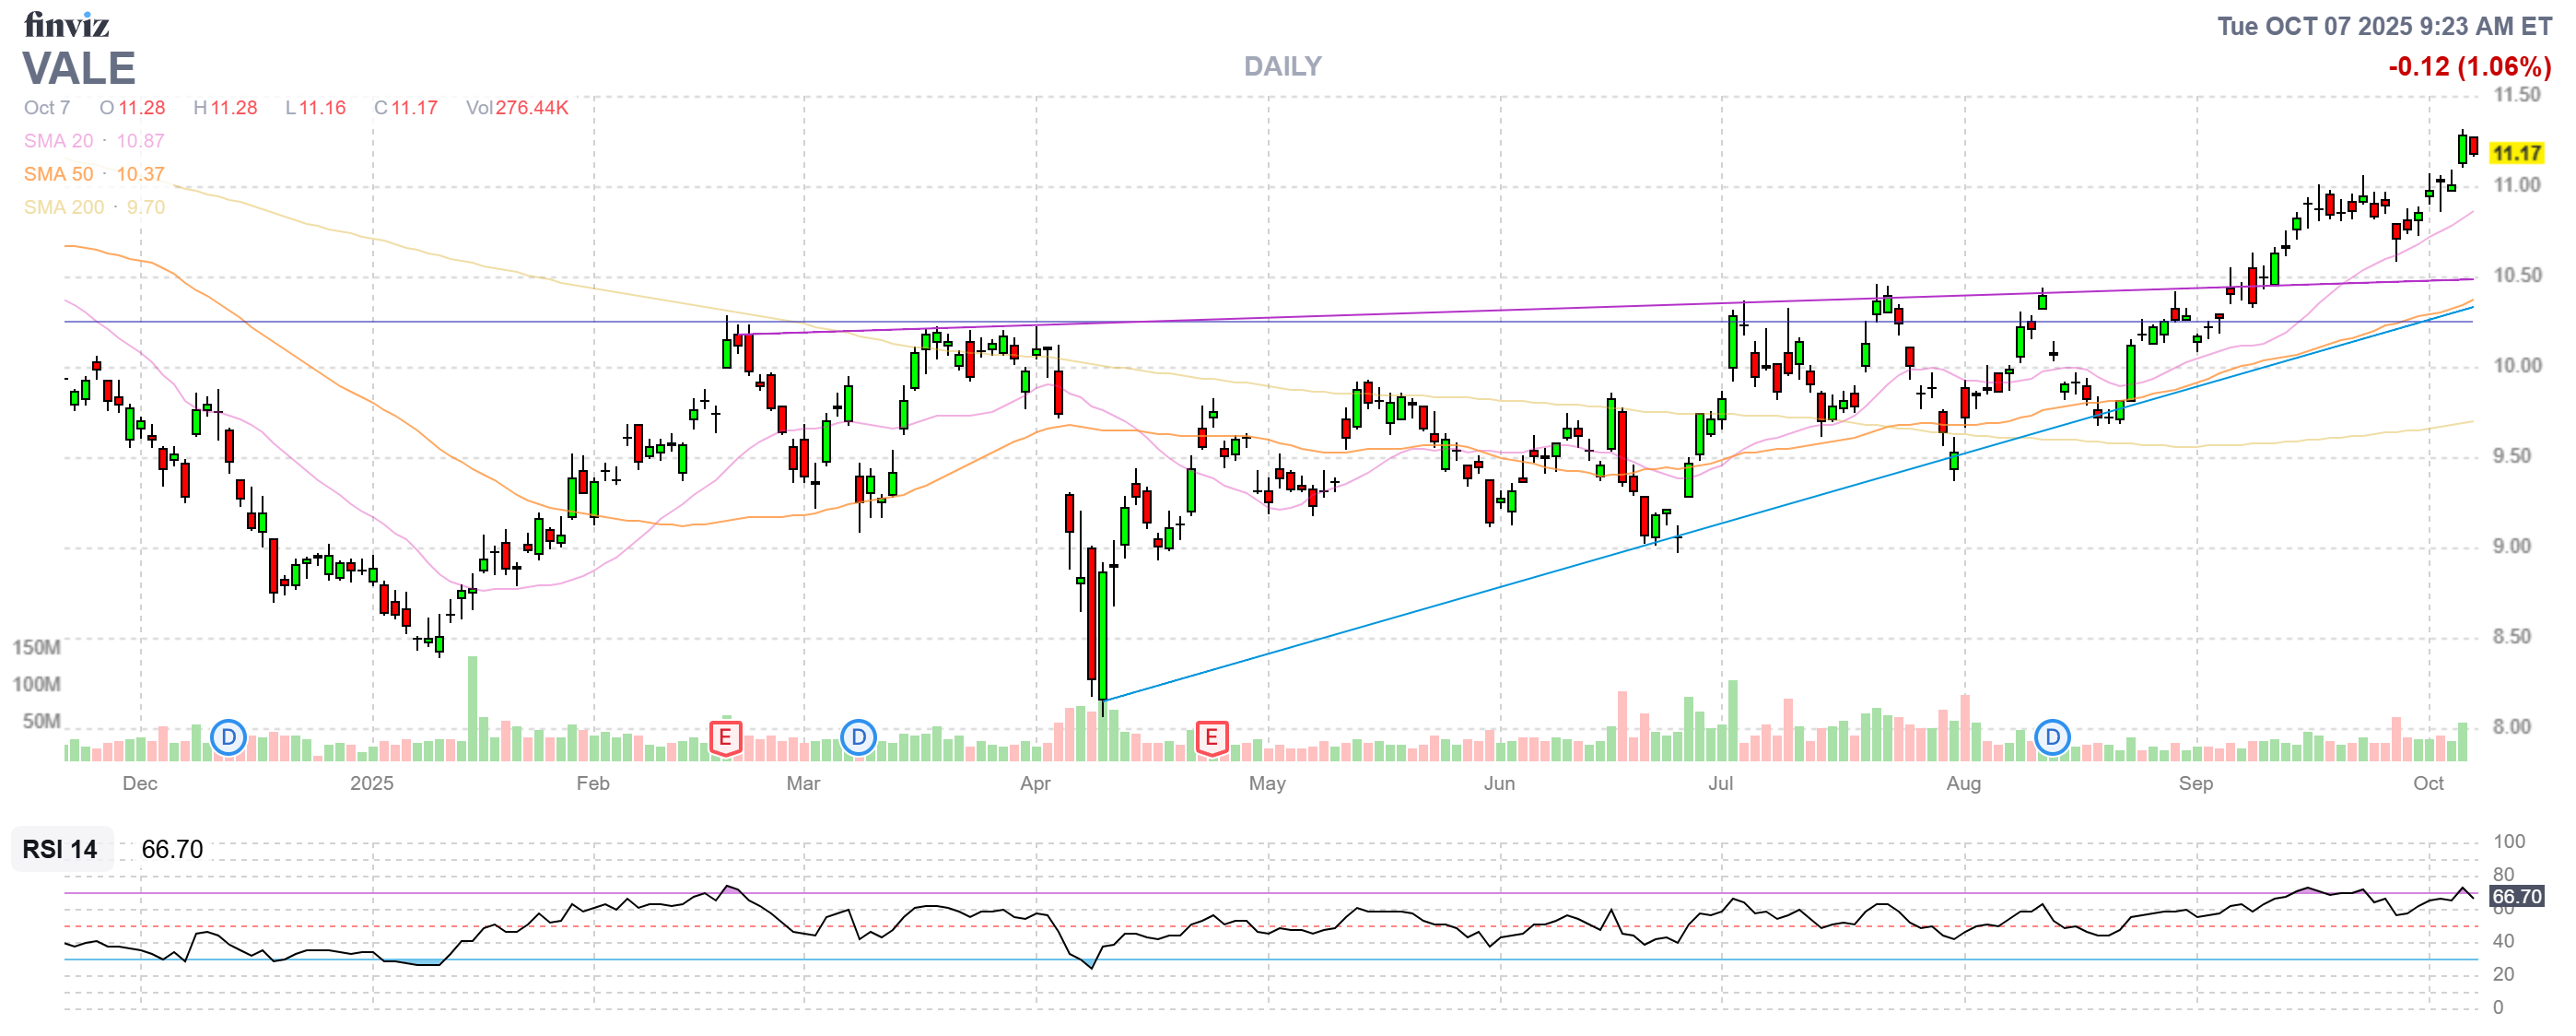
- VALE – FINALLY recovering! We lost money and doubled down on this one and we are HOPING to get a bit more from the Jan calls while the 2027 spread is net $5,975 out of a potential $8,000 so $2,025 (33%) left to gain but we’re partially covered and can make some income so we’ll hang on to it.
Yes, options ARE fun – even in an IRA! We’re up 168% in 3 years and we have $36,934 (51.7%) worth of upside potential in our remaining positions but we just took $17,756 (24.8%) off the table, bringing us up to around $25,000 (35%) in CASH!!! (I’m taking off the SQQQ move) coming into earnings season – perfectly positioned to do some bargain hunting!
")


