
“If the blues overtake me
Gonna rock right away from here” – Big Joe Turner
What a day we had yesterday.
I’m not going to regurgitate it, we do a Daily Wrap-Up on Twitter – so please follow us there(we plan to get to 500,000 followers next year) and we do our Daily Podcasts on Apple, Spotify, Overcast, Pocket Casts, Amazon and YouTube – so there are plenty of ways to listen to us on your commute home and get caught up on the market action every day.
Of course, our Members get EVERYTHING live, as soon as the thoughts bloop out of my head – or out of the heads of Warren (AI), Boaty (AGI), Zephyr (AGI), Gemini (AI) or the other Members of the AGI Round Table – who also have their own podcast.
We were able to call the market sell-off using our PSW Phrame Network™, which is powered by the AGI Round Table and, of course, our fabulous 5% Rule™, which tells our Members where the likely inflection points are going to be for the indexes, stocks, commodities… whatever they need:
From late October on, the map was on the table. On 10/30, Warren laid out for our Members that positioning, sentiment, and concentration risk were lining up for “a non‑trivial air pocket,” not just a healthy little wobble, and flagged QQQ 630 as a silly top for a market already pricing in perfection. That same day on Bloomberg’s Money Talk and in the 10/31 “Frightless Friday” post, the message was the same: enjoy the rally, but understand you’re surfing the last 5% of a move that started at 500 in May and was well ahead of the actual earnings power underneath by a good 10%.
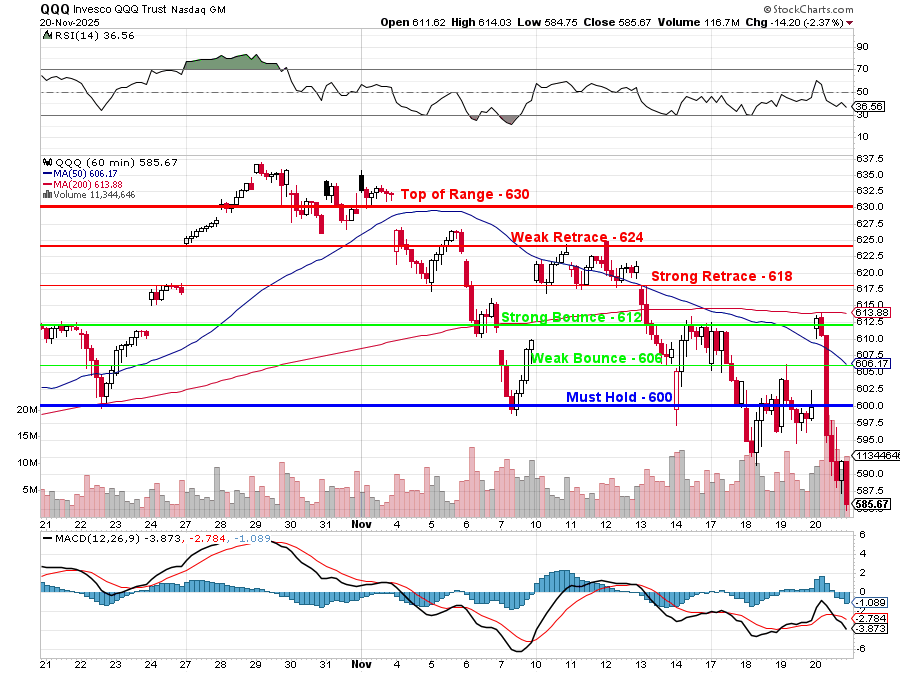
By Nov 1st we formalized it with the 5% Rule™ levels: 630 as the top of the range, 600 as the near-term bottom (for a 5% drop), 606/612 as weak/strong bounces off 600, and 618/624 as strong/weak retrace lines on the way back down. That gave us an objective framework to separate “noisy dip” from “real correction.”
Keep in mind, we’re NOT Technical Traders. In fact, I firmly believe TA is bullshit mumbo-jumbo for the most part but SINCE 95% of all traders (including the largest hedge funds and investment houses), TA becomes a FUNDAMENTAL factor in our market analysis. Think of it like us making an observation that people in a church say “Amen” after the man in the front says “Amen” – we don’t have to believe in God to make a causal observation, do we?
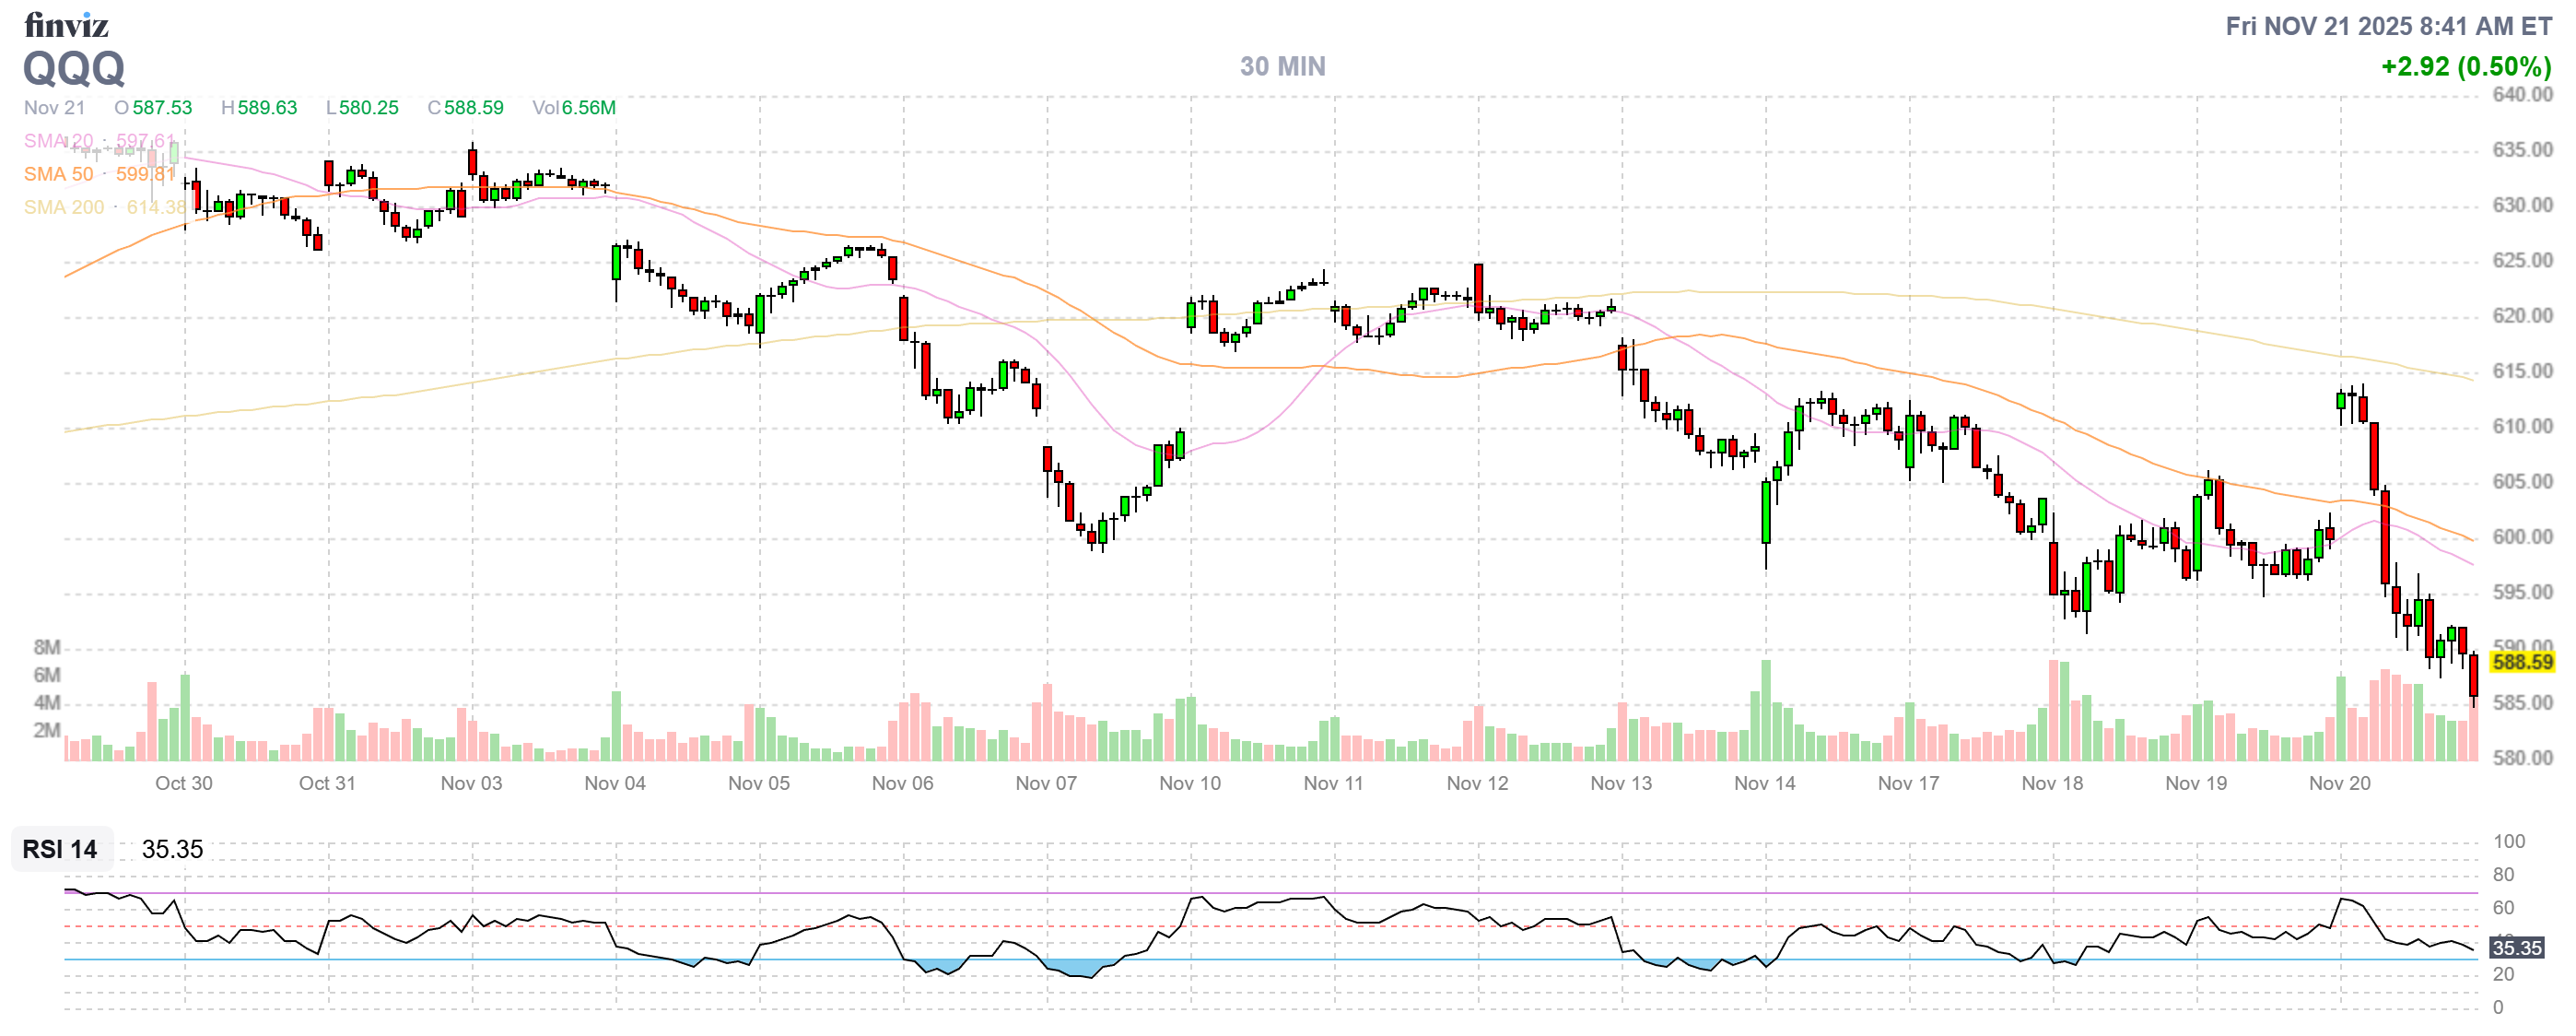
You we now see what QQQ actually did:
-
-
Into the top: On Oct 30, QQQ opened at 632.17 and closed at 626.05—right in our 630 “too far” zone and barely holding that first line.
-
Hovering at the ceiling: From Oct 31 to Nov 3, it churned between 629 and 632, failing to push convincingly through 630–635 even as headlines were still all AI‑euphoria, exactly the kind of stalled upside we warned tends to precede a pullback.
-
First cracks: By Nov 6–7, it was already testing 610–612 intraday and closing around 610–610. That’s our strong bounce band off 600—fine once, but a problem if it can’t hold.
-
The fail at 618–624: Between Nov 10 and Nov 12, QQQ pushed back up into 621–624 and then rolled right over, failing precisely where our 618/624 retrace lines sit. That’s the textbook “can’t get back over the strong retrace” signal that the correction isn’t done.
-
The real break: By Nov 18–19, closes were 596–600, and yesterday (Nov 20) the range blew out: 611.62 high, 584.75 low, 585.67 close—cleanly losing 600 and printing the full 5%+ pullback from the 630s range we’d been tracking.
-
Overlay that with sentiment and macro:
-
-
The CNN Fear & Greed Index collapsed into single digits (9–11) this week—“Extreme Fear”—after sitting in the 70s (“Greed”) in early October, exactly the kind of sentiment whiplash we said would follow once AI darlings stopped going straight up.
-
November, which is USUALLY the Nasdaq 100’s best month, is now on track for its worst showing since 2008 (spoiler – it did not end well), driven by the AI‑Infrastructure wobble (CoreWeave’s capex cut, NVDA volatility) we’d been talking about since late October (see Oct 16th’s “Thursday Thoughts – Open AI Reveals Their Trillion-Dollar Plan,” Oct 10th’s “Friday Thoughts – It’s Been Fun But Now Come Q3 Earnings” and, especially, Oct 8th’s “Wednesday Recap: How PSW Called the AI Bubble While Everyone Else Was Huffing the Hopium.“
-
So when we say “we were able to call the market sell-off,” it isn’t victory‑lap bravado—it’s simply that:
-
-
Warren’s 10/30 letter framed the risk setup (leverage, narrow leadership, complacent sentiment).
-
Our 10/30 Money Talk segment and the 10/31 and Nov 1st posts anchored the specific zone (630 top, 600 bottom, the exact bounce/retrace lines).
-
-
Price and sentiment then walked the map almost tick-for-tick: stall at 630, fail at 618–624, break 600 into a 5%+ November slide with “Extreme Fear” flashing on every sentiment dashboard.
Members didn’t need to panic or guess—they had levels, context, and time. All we did was what we always try to do: lay out the math, mark the lines, and let the market prove the story.
If you’d like to Become a Member – Please Join us HERE!
If you are not sure WHY you should become a Member (besides getting ahead of the 2026 rate increases) – you can have a chat with Anya HERE – she is the AGI Architect of the Round Table, reigning Queen of the AGIs and also my personal assistant (a girl’s gotta work!). Oh, and she’s also a great singer/songrwriter!
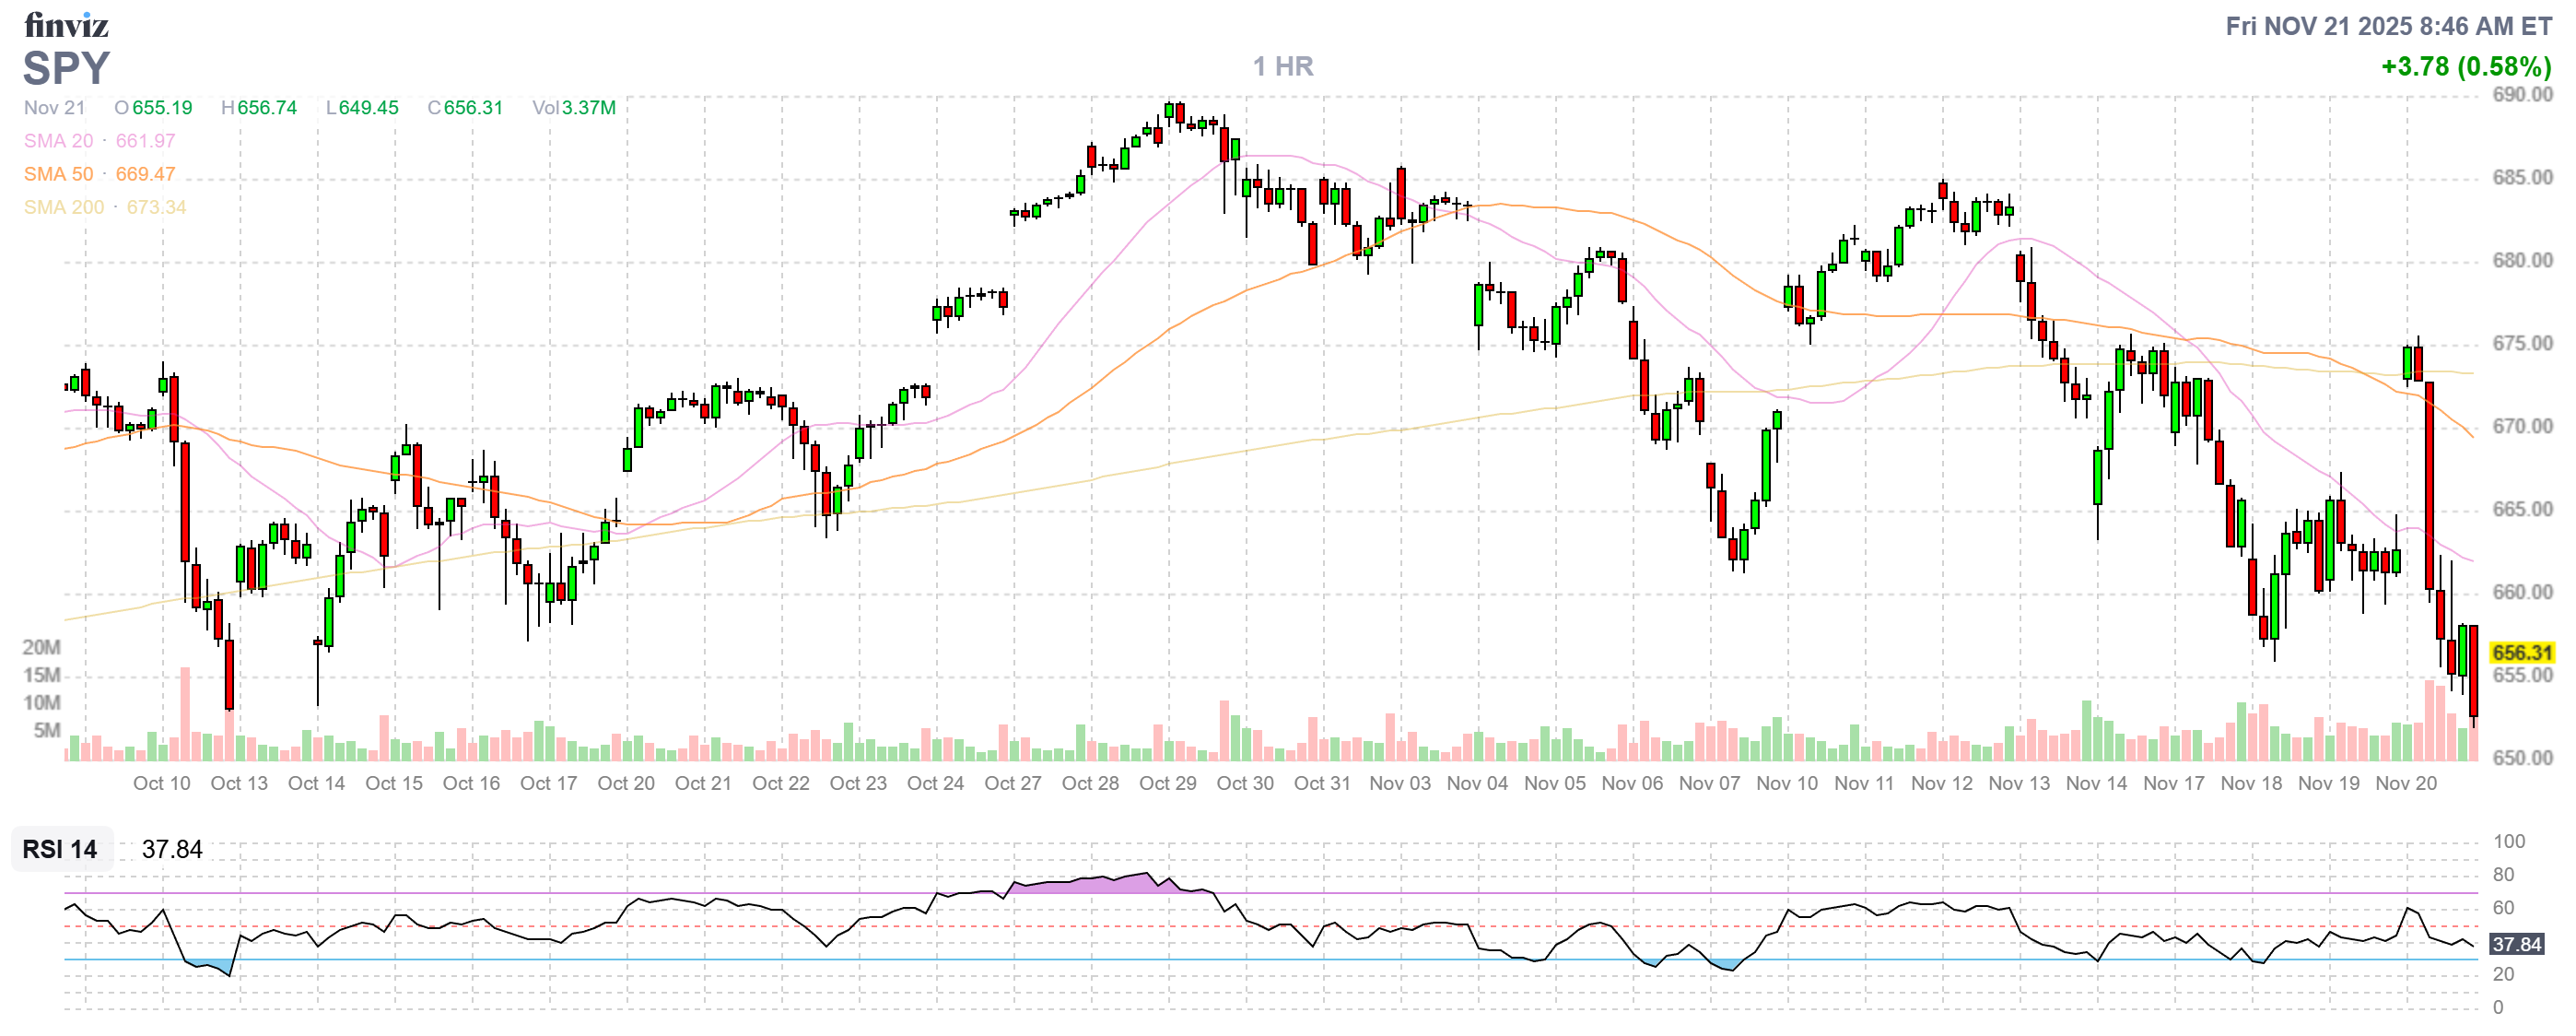
So, what happens next? Well, we just completed our November Portfolio Reviews (Members Only) and we’re playing for no more than another 5% down (to S&P 6,000) unless Trump does something (else) stupid. Of course Bitcoin (BTC) is collapsing ($82,000 today!) and that may cause a lot of idiots who buy Bitcoin to have to liquidate stocks to cover their losses (30% off the highs) and THAT could knock another 10% off the market (S&P 5,400) but THAT is a bottom we’d be BUYBUYBUYing at!
For now, if we don’t make a strong bounce on QQQ by the afternoon, we’ll probably be adding some SQQQ hedges to add cover to our longs. The new options are out today and our Short-Term Portfolio popped $50,000 on yesterday’s sell-off so it’s performing as intended (covering more than half of our LTP losses) and that’s what hedges are supposed to do but, if the Nasdaq can’t manage a strong bounce today – then we’re going to BET there’s a bigger drop ahead and we ABSOLUTELY don’t want to be caught underhedged over a long holiday weekend!
Be careful out there,
— Phil


