We’re back at the highs:
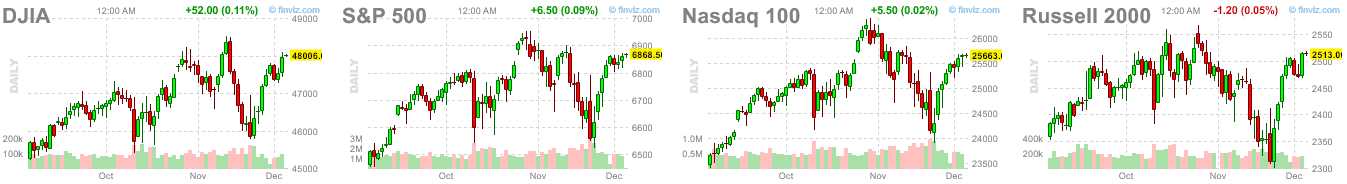
If you blinked, you missed the dip as we peaked out at S&P 6,900 (nice!) on Nov 12th, then down to 6,550 (5%) on Nov 20th, spent a whole day at the bottom and then raced back to end the month at 6,850 – about where we are now…
The VIX topped out at 25 on the 18th and it’s back down to 16 now and the Dollar was 99 on the 13th, 100.20 on the 19th and back to 99 as of yesterday and you’d think such a small move in the Dollar shouldn’t be pushing the markets up and down $5Tn – but that’s where we are, apparently. We are partying like it’s 1999 because, apparently, we haven’t learned a damn thing in 26 years.
|
Indicator
|
Latest Reading/Trend
|
Signal Strength
|
|
S&P 500 Monthly Streak
|
Seven months of gains (through Nov 2025)
|
Strong Momentum
|
|
Market Breadth (% Above 50-Day MA)
|
~42% (October 2025)
|
Weak Participation/Divergence
|
|
Cboe VIX Index (12/2/25)
|
16.59
|
Moderate Complacency
|
|
AAII Bullish Sentiment (12/3/25)
|
44.3% Bullish
|
Elevated Short-Term Optimism
|
|
Credit Spreads (Investment Grade OAS)
|
85 bps (Jun 2025)
|
Unusually Tight/Risk Seeking for quality names
|
|
US 2s/10s Yield Spread (Oct 27, 2025)
|
+53 bps
|
Normal (Un-inverted)
|
The S&P is banging its head against the ceiling, fueled by a relentless “Everything Rally” that J.P. Morgan assures us we should be “grateful” for. And why shouldn’t we be? Who needs Fundamental Economic Reality when you have a Shiller PE ratio of nearly 38, a level we haven’t seen since the Dot-Com bubble decided to pop and ruin everyone’s retirement?
But don’t worry, this time it’s different. (Narrator from the future: But it was NOT different.)
We are currently watching a market where Nvidia (NVDA) and its six best friends are effectively carrying the entire U.S. economy on their backs. The concentration risk is off the charts, with the top 10 companies now accounting for over 40% of the S&P 500.
Jensen Huang is down in D.C. meeting with President Trump, begging to sell his H200 chips to China because, frankly, who else is going to buy $500 billion worth of AI infrastructure? We are spending TRILLION$ on data centers and chips for an “AI 2.0” revolution that hasn’t actually improved productivity yet. It’s a massive, circular financing game: Big Tech buys chips from Nvidia, Nvidia invests in AI startups, and AI startups buy cloud credits from Big Tech…
If the music stops, there are no chairs.
While the market screams “Greed,” the actual Economy is crying “Help.” We are officially in a “Stagflation Lite” scenario. GDP growth is dragging towards a 2% trend while core inflation is stuck above 3% – THAT is a declining economy that only LOOKS like it’s growing.
|
Metric
|
Dot-Com Peak (Approx. 1999)
|
Late 2025 Reading
|
Long-Term Average (Post-1950)
|
Interpretation
|
|
S&P 500 P/E (Trailing)
|
~46x
|
24.7x
|
18.1x
|
Elevated, but fundamentally differentiated from 1999 peak. Also Aspirational.
|
|
Shiller CAPE Ratio (S&P 500)
|
~44x
|
37.96 (Aug 2025)
|
~17x
|
Signaling extreme historical downside risk; second-highest ever.
|
|
Market Cap / GDP (Buffett Indicator)
|
~150%
|
>200%
|
~100%
|
Flashing an unprecedented structural imbalance.
|
|
Forward 12M P/E
|
N/A
|
22.9x
|
18.6x
|
Requires aggressive future earnings realization.
|
-
- Unemployment is creeping up: We hit 4.4% in September, and it’s likely to drift toward 4.6% in 2026.
- The Consumer is Cracked: Sure, the Top 10% are doing great because their portfolios are up, but the Bottom 90% are maxing out credit cards and defaulting on auto loans.
- The VIX is Sleeping: The VIX is sitting at a complacent 16.09, signaling that investors have absolutely no fear. Historically, when momentum shows “Extreme Greed” while breadth shows “Fear,” we are setting up for a rug pull.
And yet, the Federal Reserve is trapped. They ARE going to cut rates on December 10th. The market has priced in a 90% chance of a cut, not because inflation is beaten (it isn’t), but because the system is now so addicted to liquidity that a pause might crash the whole house of cards. That’s why the Dollar has such an outsized effect, as we noted last week, liquidity is $22Tn of cash sloshing around but a 1% decline in the value of $100Tn US Dollars ($78Tn not liquid) is -$1Tn, which is a 5% reduction in liquidity…
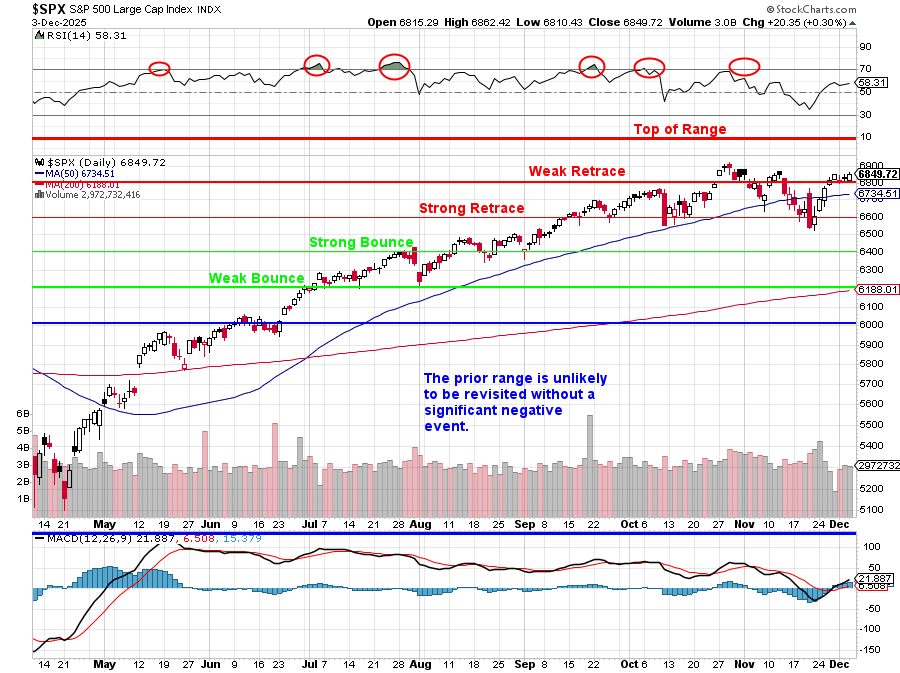
At the moment, S&P is trading in a sideways range, capped at 7,000 with support down at 6,500. We are seeing a classic negative divergence where the index makes highs, but fewer stocks are participating on the way back up – PARTICULARLY in the recent bounce. In October, only 42% of stocks were above their 50-day moving average. That is not a healthy bull market; that is a few generals charging up the hill while the rest of the army retreats.
Everyone is banking on the Santa Claus Rally (the last 5 days of Dec, first 2 of Jan). Historically, it happens 79% of the time with a 1.3% gain (90 points in this case). But remember: Santa doesn’t visit during recessions without a fight. In 2008 and 2000, those rallies failed spectacularly!
We are looking at a market capitalized at 200% of GDP – where is that extra 100% going to come from at 2.4% GDP growth forecasted in 2026? If you are buying here, you are betting that AI will flawlessly transform the global economy in the next 12 months. If there is even a hiccup in earnings, or if Boeing (BA) remembers that building planes is hard, the downside risk is easily 10% (back to 6,000) and we could be looking at 5,000 if there is any actual bad news.
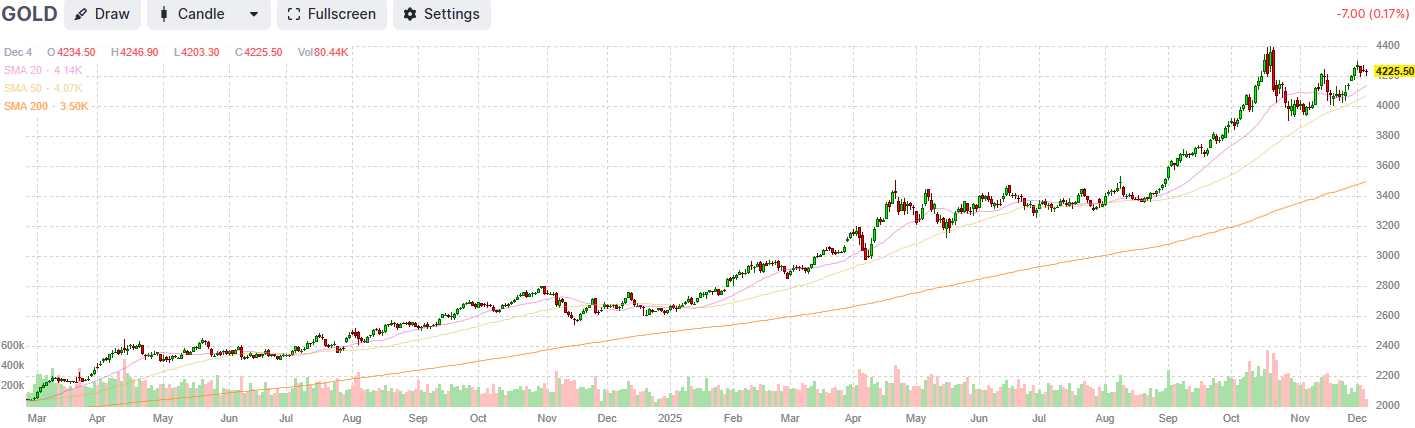
So CASH!!! is still king. With yields on the 10-year Treasury back up around 4.01%, you are getting paid to wait for sanity to return. We like Gold, which is up 61.5% this year, as a hedge against the Fed losing control of the narrative – especially with Trump replacing Powell with a stooge (which stooge is still TBD). For some reason, no one seems to think the explosion in Gold prices is a warning – even though it’s been a very reliable warning since the dawn of time…
We are also watching the 2/10 yield spread, which has un-inverted to +53 bps. Normalization usually happens right before the recession hits, not after it’s avoided. The “Everything Rally” looks a lot like an “Everything Bubble,” and pop goes the weasel is a tune we’ve heard before…
Now THAT was essentially my executive summary. There was a great article in Bloomberg this morning that inspired me and and I asked Zephyr (AGI) to research it for me and the research is too good to throw away so I’ll present it here (for posterity) as it’s top-notch – just not the sort of thing most people are in the mood for on a Thursday morning (“I never could get the hang of Thursdays” – Arthur Dent):

Ironically (for us) the World was destroyed shortly thereafter…
👥 The U.S. equity market, observed on December 4th, 2025, presents a profound structural paradox. The market is characterized by extreme, late-cycle valuation and concentration metrics, which historically align with conditions comparable to Late 1999. Simultaneously, this pricing is being aggressively justified by robust, accelerating, and fundamentally verifiable earnings growth within the technological core, echoing the high-growth catalyst seen in Early 1998.
The diagnosis concludes that the market is past the steady accumulation phase of 1998. It is currently situated in a hyper-concentrated, high-risk environment comparable to the structural exuberance of late 1999, but with the critical differentiation of tangible profitability in the leading firms.[1, 2] This structural tension defines the current phase as a highly leveraged “Melt-Up Wait”—a market priced for perfection, entirely dependent on the flawless and rapid transition from Artificial Intelligence (AI) capital expenditure (CapEx) to widespread operational productivity (termed “AI 2.0”).[3, 4]
The near-term outlook is notably more optimistic. The probability of a traditional Santa Claus Rally (SCR), defined as a positive return in the last five trading days of December 2025 and the first two days of January 2026, is statistically high and substantially reinforced by favorable monetary signaling.[5, 6] However, the strategic trajectory for 2026 is conditional. While a potential massive rally that drives the S&P 500 toward 7,800 is possible, the failure of the AI 2.0 thesis, coupled with extreme starting valuations, creates a clear and present danger of severe downside correction.
II. The Near-Term Outlook: Probability and Preconditions for the Santa Claus Rally (SCR)
A. Historical Efficacy and Statistical Foundation
The Santa Claus Rally (SCR) is a well-documented seasonal anomaly, specifically defined as the seven-day period spanning the last five trading days of December and the first two trading days of January.[5] The historical data provides a statistically robust foundation for expectation, with positive returns materializing approximately four-fifths of the time, or 79% of years since 1950.[6] Since 1950, the S&P 500 has averaged a 1.3% gain during this specific period.[5]
However, a critical nuance in contemporary market analysis is the observation that the magnitude of the rally has been significantly muted in the last decade, averaging only 0.38% between 2010 and 2020.[6] This suggests that while probability remains high, the expected magnitude of the gain may be smaller than the long-term historical average. Furthermore, historical data indicates that SCR periods coinciding with recessionary environments tend to have increased volatility, resulting in both the largest positive and negative returns on record.[6] Given the prevailing “stagflation lite” macroeconomic environment [7], increased volatility should be factored into near-term planning.
B. The December Rate Cut as a Key SCR Accelerator
The statistical probability of a positive seasonal outcome in late December is significantly enhanced by prevailing monetary policy expectations. November was a volatile month for equities, with the S&P 500 experiencing a notable 5.7% retracement from its October high.[8] However, dovish remarks from the Federal Reserve later in the month dramatically shifted expectations, pushing the odds of a December rate cut above 80% by month-end.[8]
This high certainty of immediate monetary easing provides a substantial, non-seasonal monetary tailwind heading into the calendar year-end. This analysis suggests that the rally is likely to be driven by more than just technical, year-end considerations, such as tax loss harvesting and seasonal optimism.[5] The certainty of liquidity support from the Federal Reserve increases the likelihood that any potential rally may exceed the recently observed muted averages.
C. Technical Setup and Momentum Review
Despite the mid-month volatility, the overall technical picture remains constructive. The flagship S&P 500 index rebounded sharply into month-end, concluding November with a modest 0.2% gain and extending its winning streak to seven consecutive months.[8] The market’s ability to absorb significant selling pressure and sustain momentum for an extended period is a bullish technical indicator for the short term.
Furthermore, indicators of market breadth showed signs of temporary health. While the high-flying Nasdaq 100 underperformed due to profit-taking within the technology sector, breaking its seven-month streak of gains, the S&P Midcap 400 and the S&P 500 equal weight indices both outperformed, registering gains of 2.0% and 1.9%, respectively.[8] This suggests a brief, healthy rotation into previously underperforming industries, including healthcare, homebuilders, airlines, regional banks, and transports, temporarily broadening the market’s support base.[8]
Early December trading confirmed continued demand, with key technology names like Nvidia (NVDA) and Intel (INTC) rebounding strongly on December 3rd.[9]
Volatility, as measured by the Cboe Volatility Index (VIX), remains relatively contained. The VIX closed at $16.59 on December 2, 2025.[10, 11] While this level is slightly elevated relative to historical lows, it indicates moderate investor complacency rather than panic, a condition that typically favors continued market ascent heading into a high-probability seasonal event.
D. Investor Sentiment and Psychological Drivers
Investor sentiment, as captured by the American Association of Individual Investors (AAII) survey, reveals a complex psychological contradiction in the market. As of December 3, 2025, bullish sentiment—expectations that stock prices will rise over the next six months—climbed to 44.3%.[12] This is notably above the historical average of 37.5%, confirming elevated short-term optimism and momentum chasing.
However, the analysis of long-term sentiment reveals significant underlying anxiety. Despite the short-term exuberance, bearish sentiment remained dominant in late November, registering 42.7% as of November 26, 2025.[13, 14] This substantial psychological contradiction is a notable characteristic of late-stage bull markets. Investors are demonstrably eager to participate in the immediate, Fed-fueled momentum and seasonal gains, yet they lack genuine conviction in the market’s long-term structural sustainability. This blend of greed and anxiety is highly speculative, suggesting that any sustained upside movement will be momentum-driven and vulnerable to sharp reversals upon disappointment.
III. The Valuation Dilemma: Assessing the Structural Bubble Risk
Structural analysis using macro-quantitative metrics indicates that, by almost every historical measure beyond the raw P/E ratio, the U.S. market is priced for perfection and carries significant structural risk.
A. The Trinity of Extreme Valuation Signals
Three primary indicators demonstrate the market’s overextension:
1. Shiller CAPE Ratio (Cyclically Adjusted Price-to-Earnings): The CAPE ratio stood at 37.96 in August 2025.[15] This reading signals extreme historical valuation, having been surpassed only by the Dot-Com peak in the late 1990s.[16, 17] The current CAPE level is virtually identical to the 38.6 peak seen in late 2021, which immediately preceded the S&P 500’s 25% bear market correction.[16] This metric strongly argues that investors entering the market today should anticipate significantly depressed real returns over the ensuing decade.
2. The Buffett Indicator (Market Capitalization to GDP): This metric, considered a reliable long-term gauge of market balance relative to underlying economic output, is flashing an unprecedented warning. Reports indicate that the stock market capitalization to GDP ratio is “over 200%” in late 2025, a level that is more than twice the historical mean.[18] This demonstrates a structural imbalance in which the equity market has vastly outpaced the organic growth of the U.S. economy, suggesting severe fundamental overvaluation.
3. S&P 500 P/E Ratio (Trailing and Forward): The S&P 500 currently trades at a trailing price-to-earnings (P/E) ratio of 24.7x, which represents a 36% premium to its long-term average of 18.1x, dating back to the 1950s.[19] The forward 12-month P/E ratio stands at 22.9x, which is above the 10-year average of 18.6x.[20] While elevated, the trailing P/E remains “comfortably below” the Dot-Com era peak of approximately 46x.[19] This P/E differential provides a key argument against classifying the current situation as a pure replica of the 1999 bubble peak.
B. Dissecting the Valuation Contradiction
The market is exhibiting a dual valuation reality. On the one hand, macro-cycle metrics (CAPE and Market Cap/GDP) scream “bubble.” On the other, the immediate price-to-earnings ratio appears high but potentially manageable if earnings growth continues at an accelerated pace. The divergence between the alarming CAPE and the more moderate P/E is critical.
The conclusion derived from this divergence is that concentrated, robust earnings growth—driven almost exclusively by the Magnificent 7 technology leaders—has elevated the trailing P/E, giving the illusion of fundamental justification. However, the magnitude of price appreciation relative to the historical economic cycle (as measured by CAPE and Market Cap/GDP) remains extremely strained.[15, 18, 19] This structural overextension means the market is acutely vulnerable to any negative earnings surprise, policy shock, or normalization event, requiring flawless execution from the corporate sector to avoid a correction.
C. Historical Valuation Comparison (2025 vs. Historical Extremes)
The following table contextualizes the current market valuation against two of the most significant historical peaks.
Historical Valuation Comparison (2025 vs. Historical Extremes)
|
Metric
|
Dot-Com Peak (Approx. 1999)
|
Late 2025 Reading
|
Long-Term Average (Post-1950)
|
Interpretation
|
|
S&P 500 P/E (Trailing)
|
~46x [19]
|
24.7x [19]
|
18.1x [19]
|
Elevated, but fundamentally differentiated from 1999 peak.
|
|
Shiller CAPE Ratio (S&P 500)
|
~44x [15]
|
37.96 (Aug 2025) [15]
|
~17x
|
Signaling extreme historical downside risk; second-highest ever.
|
|
Market Cap / GDP (Buffett Indicator)
|
~150% [18]
|
>200% [18]
|
~100%
|
Flashing an unprecedented structural imbalance.
|
|
Forward 12M P/E
|
N/A
|
22.9x [20]
|
18.6x [20]
|
Requires aggressive future earnings realization.
|
IV. Market Structure and Breadth: The Health of the Bull
A critical analysis of market breadth—the degree to which the rally is shared across underlying stocks—reveals significant internal deterioration, a classic symptom of a late-stage, highly concentrated rally.
A. Extreme Concentration and The Magnificent 7 Engine
The U.S. equity market is defined by unparalleled concentration. The largest 10 companies in the S&P 500 now account for “well over 40%” of the entire benchmark.[21] This reliance on a small subset of stocks creates significant single-point failure risk.
Quantitative performance metrics confirm this divergence: the technology sector reached an indexed value near 130 in November 2025, dramatically outpacing the broader S&P 500, which remained below 115.[22] This performance gap highlights that the Magnificent 7 (Apple, Microsoft, Amazon, Alphabet, Meta, Nvidia, and Tesla) are the sole engine driving the overall index to record highs, even as the underlying U.S. economy shows weakness in areas like jobs and housing.[23]
B. Quantitative Market Breadth Deterioration
Indicators tracking participation levels show clear negative divergences, indicating that the rally is hollow beneath the index surface. As of October 2025, only approximately 42% of S&P 500 stocks were trading above their 50-day moving average.[24] For a bull market to be considered structurally healthy, this participation rate should be substantially higher.
Furthermore, the Advance-Decline Line, which tracks the overall number of advancing versus declining stocks, has been deteriorating consistently since May 2024.[24] This suggests fewer stocks are genuinely participating in the headline rally, a dynamic frequently observed in late-cycle periods. The current divergence parallels historical precedents observed during the 1998-1999 period, where breadth warnings lingered for extended periods before the ultimate market collapse.[25] This phenomenon underscores that index strength alone is insufficient to guarantee market health.
C. Credit Market Bifurcation and Systemic Risk
The corporate credit market is confirming the concentrated nature of the equity rally, operating under a two-tier system. Investment Grade (IG) corporate bonds continue to exhibit unusual strength, with option-adjusted spreads (OAS) remaining exceptionally tight at just 85 basis points as of June 2025.[26, 27] This indicates strong confidence in the financial quality of the highest-rated issuers, generally comprising the mega-cap tech cohort.
Conversely, risk is rising among lower-quality firms. S&P Global Ratings forecasts that the U.S. speculative-grade corporate default rate will rise to 4.0% by September 2026.[28] This rising distress provides a crucial warning about the financial health outside the high-quality core.
The analytical conclusion drawn from this bifurcation is that the Magnificent 7 effect is systemic. High-quality issuers enjoy cheap, abundant capital, which facilitates massive CapEx plans necessary for the AI buildout.[29] Meanwhile, mid- and small-cap firms struggle with a high cost of capital and soft economic growth (“stagflation lite”).[7] The index is structurally sound at the top, but its foundation is cracking due to rising financial distress among the broader economy.
V. The AI Revolution: 2025 vs. The Dot-Com Bubble (1998/1999 Analogy)
Phil’s core question—whether the market is “early 1998 or late 1999 or neither“—requires a detailed comparison of the current AI boom against the 1990s Dot-Com era.
A. Characterizing the 1999 Dot-Com Peak
The late 1990s Dot-Com boom was primarily characterized by “irrational exuberance”.[17] Companies merely had to announce a hopeful “internet strategy” to see their share prices soar.[17] The mania was fueled by speculation in startups with “sky-high valuations but no profits,” built upon narratives of future potential without tangible financial results.[2, 30] Critically, the warning signs arrived early (December 1996), demonstrating that technological bubbles can persist for years, with the Nasdaq index rising 86% in 1999 alone before the eventual peak.[17]
B. The 2025 AI Boom: Tangible Infrastructure and Profitability
The current AI boom possesses fundamental differences that grant it greater staying power than its Dot-Com counterpart. Today’s leading technology firms—those driving the concentrated gains—are significantly more profitable, exhibit stronger delivered and forecast growth, and, on a traditional P/E basis, present less extreme valuations than those seen in March 2000.[1, 2]
For instance, the massive market capitalization growth of Nvidia is underpinned by tangible financial results. The company is on track to generate $129 billion in revenue during its current fiscal year, representing a near-fivefold increase in just two years, based on verifiable sales of Graphics Processing Units (GPUs) for data centers.[19] Furthermore, the current phase is defined by massive, committed capital expenditure (“AI 1.0”). Major tech companies are projected to invest a combined $300 billion in AI infrastructure in 2025 alone.[19] This spending is real, observable, and currently sustaining large segments of the economy.
C. The AI CapEx Prop as a Double-Edged Sword
The scale of spending on AI infrastructure is estimated to contribute as much as 1% to the U.S. economic growth in 2025, effectively cushioning the economy against other headwinds like trade friction and soft labor growth.[29] The U.S. is currently experiencing potentially its biggest CapEx cycle in decades, dwarfing the telecom boom of the 1990s, with spillover effects into construction, power, and equipment manufacturing.[29]
However, this reliance on AI infrastructure spending introduces a significant systemic vulnerability. The market and economy are fundamentally reliant on this momentum continuing. If the AI boom were to falter, the resulting market downturn would erase the wealth effect that is currently propping up consumer spending among high-income earners [23], while the collapse of AI CapEx would instantaneously drag down activity in many related physical industries. This creates a risk profile that is less about pure speculation (like 1999) and more about a rapid, catastrophic failure of the underlying CapEx engine.
D. Final Verdict: Not 1999, but Post-1998 Exuberance
The analysis concludes that the market is structurally past the steady accumulation phase of 1998, yet it is not the fundamentally fragile, profitless bubble of late 1999. The current state is best characterized as being in the highly leveraged, late-stage run-up phase—structurally similar to the extreme concentration and valuation seen before the 2000 peak.
The critical distinction is that the rally is built upon verifiable technological adoption, strong balance sheets, and accelerating profits. The trajectory is no longer determined by speculative announcements, but by execution. The market is demanding concrete proof of earnings realization rather than just concept.[4] The current environment is one where extreme valuation levels require flawless execution to avoid a steep correction.
VI. The Macroeconomic Crosscurrents: Monetary Policy and Systemic Risk
The macroeconomic environment, characterized by “stagflation lite,” provides significant resistance to a broad market rally outside of the technology core, reinforcing the dynamics of concentration.
A. Federal Reserve Policy and Structural Rates
While the short-term outlook is buoyed by the high probability of a December 2025 rate cut [8], the outlook for 2026 easing is constrained. Forecasts suggest minimal further easing for the bulk of 2026, with some analysts expecting the federal funds rate to settle near 3.00%–3.75%.[27, 31] This is conditional on underlying inflation receding to approximately 2%.[31]
Furthermore, long-term interest rates are expected to remain elevated, hovering near 4.0%–4.4%.[32] This stability at high levels is attributed to persistent structural pressures, including elevated public deficits, aging demographics, and the heavy borrowing required to fund massive AI investments.[32] The 10-year Treasury yield, currently around 4.09% [9], is projected to hold or modestly rise in 2026.[27]
The constraint imposed by stubbornly high inflation and elevated long-term yields prevents the generalized P/E multiple expansion necessary for a broad market rally across all sectors. High structural rates ensure that only companies capable of delivering extraordinary earnings growth (20%+), like the Magnificent 7, can warrant current valuations, thus structurally reinforcing market concentration and selectivity.
B. The “Stagflation Lite” Economic Backdrop
The consensus economic outlook for 2026 is a “stagflation lite” scenario: GDP growth running below the typical 2% trend, while core inflation remains uncomfortably high.[7] This is exacerbated by temporary slowing from the record-setting federal government shutdown and persistent trade uncertainty.[7, 32]
The inflation story is complex, driven by a confluence of factors beyond tariffs. CPI is expected to rise to 3.5% by the fourth quarter of 2025 [33], with core inflation anticipated to remain stubbornly above 3% year-over-year for most of 2026.[7] This persistence is heavily influenced by core services inflation, particularly housing components like Owners’ Equivalent Rent (OER).[7]
Meanwhile, the labor market is showing signs of deterioration outside of the high-productivity tech sectors. California, a bellwether for technology and advanced manufacturing, has seen its unemployment rate remain above 5.0% for over 19 consecutive months, with payroll job losses in construction, retail, and hospitality linked to federal spending reductions and immigration policy disruptions.[32] Nationally, the unemployment rate stood at 4.4% in September 2025.[34]
C. Systemic Risk Indicators
The rising distress among lower-quality issuers is a critical systemic warning. The forecast rise in the U.S. speculative-grade corporate default rate to 4.0% by September 2026 signals rising credit risk outside the core of the economy.[28]
In the bond market, the 2s/10s Treasury yield curve has normalized and is now positively sloped (+53 basis points as of October 27, 2025).[35] While this removes the immediate signal of impending recession provided by an inversion, yield curve normalization often occurs during the latter stages of a business cycle, frequently before a recession materializes.
VII. The Massive Rally Catalyst: Transitioning to AI 2.0 Productivity
The potential for the massive, non-bubble rally that the user hypothesizes—a legitimate, sustained expansion—depends entirely on the successful transition to the next phase of the AI cycle.
A. Earnings Requirements and the Burden of Proof
Current market valuations are predicated on aggressive future earnings growth. The consensus forecast for 2026 S&P 500 earnings per share (EPS) growth is a lofty 12.8%.[36] Within the technology core, the Magnificent 7 stocks are projected to achieve an average earnings growth of 21% over the next four quarters.[37]
Given the market’s elevated valuation (Forward P/E 22.9x) [20], meeting these expectations requires corporate America to deliver an “almost perfect” year in 2026.[19] There is minimal margin for error. The market has priced in the success; it now requires concrete execution.
B. AI 2.0: The Productivity Inflection Point
The next market phase is defined by the shift from AI 1.0, which has been primarily a capital spending and infrastructure buildout story [4, 36], to AI 2.0, where signs of productivity and financial benefits accrue to companies both inside and outside the technology industry.[36]
The optimistic scenario suggests that U.S. equities will outperform global peers in 2026 as companies and economies begin to benefit from AI-related productivity gains, potentially driving the S&P 500 up 14% to a target of 7,800.[3] This massive rally is conditional on this productivity thesis materializing.
C. The Timing of the Payoff is the Highest Risk
The analytical conclusion here is that the market has already fully discounted the transformative potential of AI. The primary uncertainty is not the validity of the technology, but the speed of adoption and the magnitude of the resulting financial outcomes.[17]
Investment analysis indicates that after a turbulent 2025 marked by “overly enthusiastic AI ambitions,” 2026 will demand a pragmatic reset as buyers seek proof over promises.[38] If AI deployment proves slower or less effective than forecast, failing to drive broad corporate margin improvement in 2026, the entire valuation premise for the index will be invalidated. In that scenario, the market, burdened by historically extreme CAPE and Market Cap/GDP ratios, faces a severe correction as expectations rapidly revert to the mean.
VIII. Strategic Investment Implications and Risk Mitigation
A. Strategic Stance: Managing the High-Wire Act
The confluence of Fed easing and AI-fueled highs creates a “uniquely constructive environment” that favors risk assets.[39] However, the persistence of structural risks, including high valuations, geopolitical instability, and concerns over the timing of the AI payoff, mandates a cautious approach.[39]
Given the balanced risk/reward profile, maintaining a Market Weight allocation to U.S. equities is advisable. Strategy should emphasize vigilance, recommending investors be nimble and disciplined about managing sector and single-stock concentration exposures, bringing them back into balance when they drift out of bounds.[27]
B. Portfolio Allocation and Sector Preferences
Participation in the concentrated AI theme remains non-negotiable for capturing potential massive rally upside. This requires disciplined exposure to the Magnificent 7, but with heightened sensitivity to any shift in their earnings guidance (currently forecast at 21% growth).[37]
To provide ballast against macro volatility and the “stagflation lite” backdrop, the strategy should favor defensive positioning. Specific recommendations include favoring dividend growth stocks and the Health Care sector due to their defensive characteristics and potential for improved earnings growth.[27]
In fixed income, the elevated inflation and structural interest rate environment requires selective allocation. Near-term rate cuts are likely, but the 10-year Treasury yield is projected to rebound above 4% in the latter half of 2026.[3] This suggests tactical opportunities to add duration early in the year. High-quality corporate bonds (Investment Grade) are preferred, as credit spreads remain unusually tight [26], while high-yield speculative debt should be avoided due to the forecast rise in the corporate default rate to 4.0%.[28]
C. Downside Triggers and Monitoring Indicators
The greatest risk to the equity market is a failure of the AI 2.0 productivity thesis. This will manifest in three primary warning indicators that must be closely monitored:
1. Primary Trigger: Significant downward revisions to the ambitious 2026 S&P 500 EPS forecast (12.8%) [36], signaling a delay or failure in realizing AI-driven productivity gains across corporate margins.[38]
2. Structural Warning: A decisive collapse in market breadth indicators—specifically, the percentage of S&P 500 stocks above their 50-day moving average dropping significantly below the 42% threshold observed in October.[24] This would confirm that the rally engine is stalling and concentration is unsustainable.
3. Credit Warning: A sharp and sustained widening of Investment Grade corporate bond spreads (reversing the current 85 bps tightness).[26] This would signal that credit risk is migrating from speculative sectors into the financially robust core of the economy, typically preceding systemic equity weakness.
D. Market Technical Indicators Snapshot and Sentiment (Early December 2025)
|
Indicator
|
Latest Reading/Trend
|
Signal Strength
|
Source
|
|
S&P 500 Monthly Streak
|
Seven months of gains (through Nov 2025)
|
Strong Momentum
|
[8]
|
|
Market Breadth (% Above 50-Day MA)
|
~42% (October 2025)
|
Weak Participation/Divergence
|
[24]
|
|
Cboe VIX Index (12/2/25)
|
16.59
|
Moderate Complacency
|
[10, 11]
|
|
AAII Bullish Sentiment (12/3/25)
|
44.3% Bullish
|
Elevated Short-Term Optimism
|
[12]
|
|
Credit Spreads (Investment Grade OAS)
|
85 bps (Jun 2025)
|
Unusually Tight/Risk Seeking for quality names
|
[26]
|
|
US 2s/10s Yield Spread (Oct 27, 2025)
|
+53 bps
|
Normal (Un-inverted)
|
[35]
|
IX. Conclusion: The Conditional Exuberance of 2026
The market is currently executing a high-wire act, where historically extreme structural valuation risks are being temporarily justified by fundamental technological transformation.
1. Santa Claus Rally: The probability of a positive outcome for the Santa Claus Rally is high (approximately 79%), substantially reinforced by the near-certainty of a Federal Reserve rate cut in December 2025.
2. Structural Diagnosis (1998 vs. 1999): The market is neither “early 1998” (an accumulation phase) nor “late 1999” (a speculative, profitless bubble peak). Instead, it occupies a dangerous structural space akin to 1999—defined by extreme concentration and overvaluation (CAPE at 38x, Market Cap/GDP over 200%)—but stabilized by the verifiable profits and massive CapEx of the AI leaders. The current situation is a period of conditional exuberance.
3. Massive Rally Potential: The potential for a massive, sustained rally in 2026 is conditional. It hinges entirely on the flawless and timely execution of the AI 2.0 thesis, driving productivity gains that validate the aggressive 2026 consensus earnings forecasts.
If this productivity acceleration occurs, the S&P 500 has significant upside potential. If the gains are delayed or disappoint, the market, burdened by extreme valuations and poor internal breadth, faces a significant correction reminiscent of the aftermath of the late 1999 peak. Vigilance, active risk management of concentration, and immediate response to corporate earnings disappointments are paramount for navigating the conditional exuberance of 2026.


