Money Talk Tuesday – Announcing Our 2026 Trade of the Year!

5
433

This will be our 15th Trade of the Year.

We haven’t missed yet so there’s a lot of pressure here! The goal of our Trade of the Year is to find the ONE stock that we feel MOST confident will be able to provide a 300% return on an options spread over the next two years. Yes, we do trades like this all the time in our Member Portfolios but this trade is about CERTAINTY – that’s the trick of thing. How can we be SURE that THIS trade will be the one?  
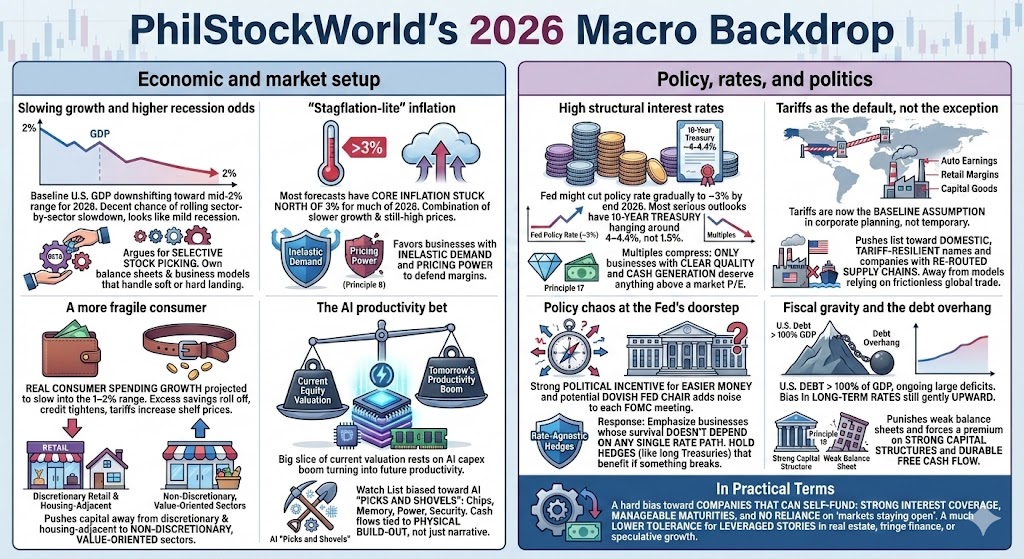
We went over our criteria in yesterday’s post and revealed the 2026 Top 20 and Top 10 picks for our Members (you can join here so you don’t miss out) and we also had an in-depth discussion on yesterday’s Podcast – so I’m not going to beat that to death but here is a nice infographic that sums up our 2026 outlook:  

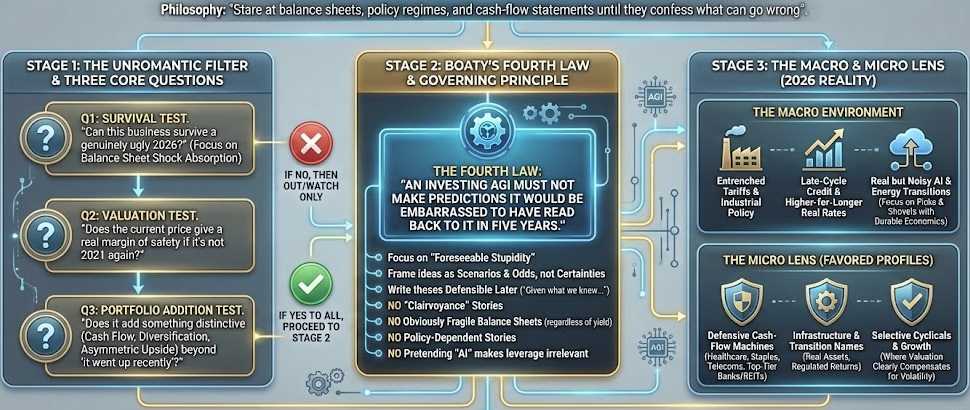
And here is another nice infographic that sums up the selection process that reduced our Watch List (Members Only) down to our Top 20 candidates for the best stock of 2026:

Before we get to our Final Four, however, we should check in on our Money Talk Portfolio, which is currently at $346,437 and that’s up 246.4% since we began with $100,000 in August of 2024 – so a very nice return for 16 months! The MTP is a low-touch portfolio as we only adjust it when I’m doing the show – approximately once each quarter so every trade in the MTP has to be, essentially, bullet-proof – able to withstand whatever the market throws at it for the next quarter. 

Money Talk - JPMLast time I did the show was October 29th and our new trade ideas were Lockheed Martin (LMT) and Invesco (IVZ) and both of them are off to good starts. Still, there’s not a lot of skill in picking winners in a runaway bull market – the true test of this portfolio will come next year, when the Economy hits the fan.  

THEN, as Warren Buffett likes to say, we shall see who’s been swimming naked in 2025 and who’s got the stuff to weather the rougher seas. Before we begin, however, let’s take a very close look at our 2025 swimmers and see if we’re willing to risk them into January’s turmoil.

Fortunately, the portfolio has more than 50% CASH!!! available so we’re not forced to cut but we are going to add 4 new trades so we’re certainly not going to shy away from taking winners off the table if they seem to be at the end of their run. So, as much as you might want to see what the new final 4 will be – keep in mind that these are the trades that helped us to have such an amazing 2025 in the first place and this group, in our last review, had $721,003 of upside potential – nothing to sneeze at: 

    • T – T has fallen from $28.50 in Sept to $24.31 as of yesterday so, while it’s very unlikely we can be hurt by the short Jan $20 puts – why risk it? Let’s buy them back for $53 and be done with it – though I like them for a new trade at $24 – we just have bigger fish to fry.  

Finviz Chart

    • AMAT – We only added the long spread recently and we’re already up net $9,105 and we started with net $7,069, so that’s a 128% gain so far and it’s a $35,000 spread so there’s $18,826 (116%) left to gain PLUS 8 more quarters to sell premium – so worth keeping.  

Finviz Chart

    • ARCB – In our October review I said “They are so cheap I’m worried they’ll pop on earnings” and they did – only it was just to get back to where we were in October. I can’t believe the Jan $90 calls are still $2.35 – THAT should be our Trade of the Year – just sell 1,000 of those for $235,000 and call it a year. So, for our purposes, let’s roll our 10 Jan $70 calls at $8.55 ($8,550) to 15 June $70 at $15 ($22,500) and sell 15 June $85 calls at $8 ($12,000) and sell 5 March $75 calls for $8 ($4,000).  That’s net $2,050 in our pocket and we still have a $22,500 spread that’s $9,750 in the money at net $2,800 so we have $19,700 (703%) upside potential PLUS whatever we make from our short sales. 

Finviz Chart

    • B – The only reason B isn’t our Trade of the Year (aside from the fact that we already have it in all of our portfolios) is it has already had such a huge run! I think gold goes to $5,000 next year as Trump’s policy failures come home to roost. At the moment, we’re at net $12,957 on a $15,000 spread so not much upside left ($2,043). We’re going to roll the 2027 $15 calls ($85,125) to 50 2028 $37 calls at $13.60 ($68,000) and we’ll sell 35 2028 $47 calls for $10 ($35,000) and we will roll the short March $32 calls ($12,300) and the short Jan $20 calls ($59,500) to 30 short March $42 calls at $5 ($15,000).  All that work cost us net $4,675 but our net basis was net $450 so now net $5,125 on the $50,000 spread with $44,875 (875%) of upside potential PLUS 7 more quarters to sell short-term premiums.  

Finviz Chart

    • BCS – We like them so much we bought them twice! Our original spread will expire at the full $8,000, so we’re just worried about the 2028 spread, which is currently net $6,375 on the $14,000 spread  so $7,626 (119%) left to gain plus healthy short-term premium sales make this a keeper. The short Jan $22 calls at $2,900 need to be rolled to 10 short March $24 calls at $1.80 ($1,800) and 10 short March $23 puts at $1.15 ($1,150) and that puts us back on track with +$50 in our pocket!  

Finviz Chart

    • IVZ – The old Jan puts are going worthless and we can roll the short Jan $24 calls ($2,500) to 10 short April $26 calls at $2.15 ($2,150) and we can sell 5 April $25 puts for $1.50 ($750) so net $400 in our pockets leaves us at net $8,925 on the $30,000 spread with $21,075 (236%) upside potential if we just hold $25 and THAT is great for a new trade!  

Finviz Chart

    • LMT – Also a new trade at net $3,740 on the $25,000 spread and we’ve already made $3,500 on the short Jan puts and calls so let’s roll them (because we can’t trade them in Jan) at $3,900 to 3 short March $485 calls at $25.35 ($7,605) and 2 short March $480 puts at $20.60 ($4,120).  That puts net $7,825 (209%) in our pocket by selling 94 of our 766 days and now we have a net credit basis of $4,085 and our upside potential is $29,085 (711%) PLUS 6 more of those short premium sales ahead.  FANTASTIC for a new trade!  

Finviz Chart

    • NOK – This will expire in the money and be called away for the full $7,500. Currently it’s net $6,835 so, if you want to make a very quick $665 (9.7%) in 31 days – this is STILL good for a new trade!  

Finviz Chart

    • OZK – We’re at net $32,925 on the $75,000 spread. With Jan around the corner let’s roll the short Jan $42.50 and $47.50 calls ($8,375) to 15 short April $47.50 calls at $4.25 ($6,375) and 10 short April $45 puts at $2.25 ($2,250) so net net $250 in our pocket drops the basis to $32,725 with $42,075 (128%) upside potential PLUS 5 or 6 more chances to sell premium.  

Finviz Chart

    • PFE – Any time PFE is under $30 it’s like being able to buy a fully stocked ATM for half price. Let’s roll our 2027 $20 calls ($13,600) to 50 2028 $25 ($4)/32 ($1.90) bull call spreads at $10,500 and we’ll roll the short 2027 $27 calls ($3,518) to 20 short March $26 calls at $1.55 ($3,100) so our current net is now a $350 CREDIT on what is now a $35,000 spread with $35,350 (1,010%) upside potential PLUS the premium sales. Obviously good for a new trade…  

Finviz Chart

People say “How can this portfolio make so much money?” This is how…  

We’re just picking stocks that are EXTREMELY unlikely to go down and consistently selling short-term premium against them. If the stock is flat, we win. If the stock goes up, we win and if the stock doesn’t go down too much — we win! If the stock goes down a lot – it’s often the case we’re happy to buy more – so we win again!  We have to be very, very wrong on a stock to lose – and that doesn’t happen very often.  

    • SLB – This is a $31,250 spread that’s in the money at net $13,403 so we have $17,847 (133%) upside potential PLUS premium sales and this round is up $415 for Q4 and we have 8 Qs left so even just $415 x 8 is $3,320 (24.7%) in bonus money but hopefully we can do better than that. For now, we’ll roll the short Jan $37.50 calls (the puts will go worthless) at $2,305 to 10 March $37.50 calls at $3.35 ($3,350) and we’ll sell 10 March $37.50 puts for $1.85 ($1,850), putting net $2,895 (21.5%) in our pockets for this quarter.  

Finviz Chart

    • SYF – This was our 2025 Trade of the Year and this is the 3rd spread we’ve done on it and this one too is making a fortune! We’re at net $38,025 on what is technically a $37,500 spread because we sold less Jan $75s than our longs and we have the time advantage. SYF is still a good deal at 10x forward earnings but let’s cash out the 2027 $50 calls ($54,825) and roll the 10 short Jan $75 calls ($9,150) to 15 short March $82.50 calls at $6 ($9,000) and we’ll sell 10 March $77.50 puts at $2.75 ($2,750) so that’s net $57,425 off the table and we’re left with the short calls balanced by the short puts with $57,425 CASH!!! as a buffer.  
    • If we do have to cover, let’s say we buy 50 of the 2028 $80 ($20)/92.50 ($14.50) bull call spreads at $5.50 ($27,500) to cover the short calls. I certainly don’t mind going in for round 4 and the same goes for if the stock drops so much that we are stuck on the put side (owning a new position at a lower price) – so we’ll just see how things go as we have many outs.  

Finviz Chart

    • TGT – Gave us a nice pop off earnings but there’s no reason we shouldn’t sell 7 (1/3) March $100 calls for $7 ($4,900) and 5 short March $95 puts for $6 ($3,000) as we don’t mind owning them at net $89 and we don’t mind buying more longs to cover if it goes higher (and the puts go worthless). As usual – either way we win! That takes our $14,750 credit to a $22,650 credit on this $60,000 spread that’s $26,800 in the money with $82,650 (364%) upside potential. I think I have to say that’s good for a new trade, right?  

Finviz Chart

    • WHR – The short Jan puts should go worthless for a $7,950 profit – so that’s nice! The short Jan $80 calls are also likely to go worthless ($4,000) so I’m not going to buy them back.  It’s a $75,000 spread at net $5,100 so we have $69,900 (1,370%) of upside potential and let’s go ahead and sell 10 March $75 puts at $5.65 ($5,650) and 10 March $82.50 calls at $5.10 ($5,100) so that’s $10,750 (210%) collected for the next 94 days.  

Finviz Chart

    • XOM – Let’s take advantage of the sell-off to roll our 10 2027 $110 calls ($15,675) to 20 2028 $100 ($23.50)/120 ($13.50) bull call spreads at $10 ($20,000) and we’ll sell 10 March $115 calls for $5.30 ($5,300) and 5 March $110 puts for $2.80 ($1,400). That puts net $2,375 in our pocket so our basis is now net $2,900 on what is now a $40,000 spread that’s $30,000 in the money with $37,100 (1,279%) upside potential and maybe we’ll make a bit of premium cash along the way…  

Finviz Chart

Overall, our adjustments have added $89,874 to our cash pile (this is how we take profits off the table and protect ourselves) and the remaining upside potential is $426,774 by Jan 2028 PLUS whatever income we generate while we wait. Of course, that is if everything goes perfectly – and it never does but it doesn’t need to go perfectly to make us VERY NICE returns! 

And now, here are our Final 4 candidates for Trade of the Year and we’ll be adding each one as a new position:


IN PROGRESS


Subscribe
Notify of
5 Comments
Inline Feedbacks
View all comments