Finally some clarity!

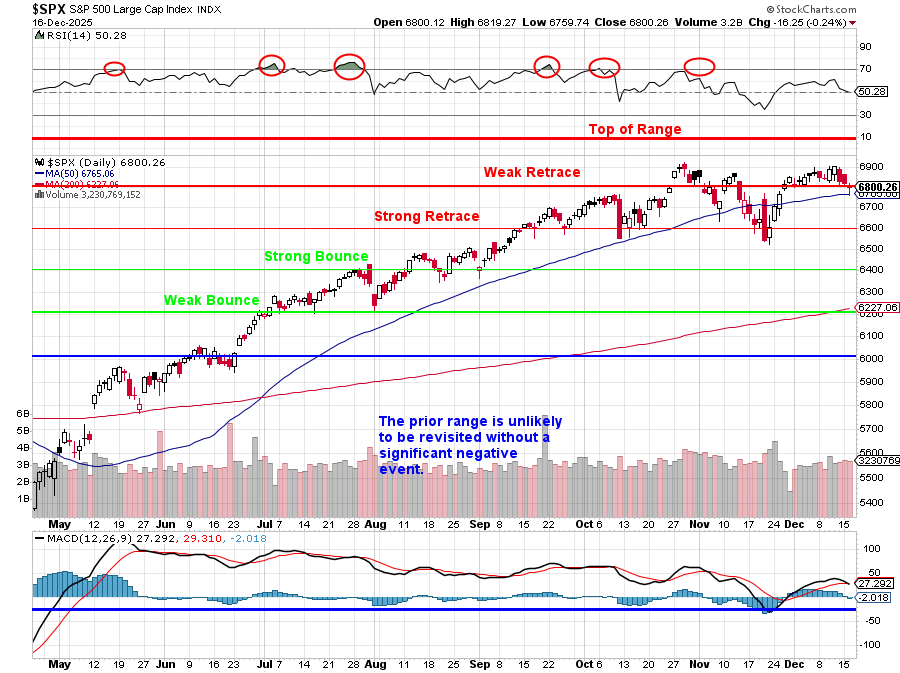
In the last month we finally got a “test(perfectly along our 5% lines) as the indexes pulled back 5% and reminded everyone that trees do not grow to the sky. This month the S&P has lurched right back to the highs, but if you look past the index line and into the Heat Map, it’s obvious this is not the same broad, easy rally we enjoyed off the June lows.

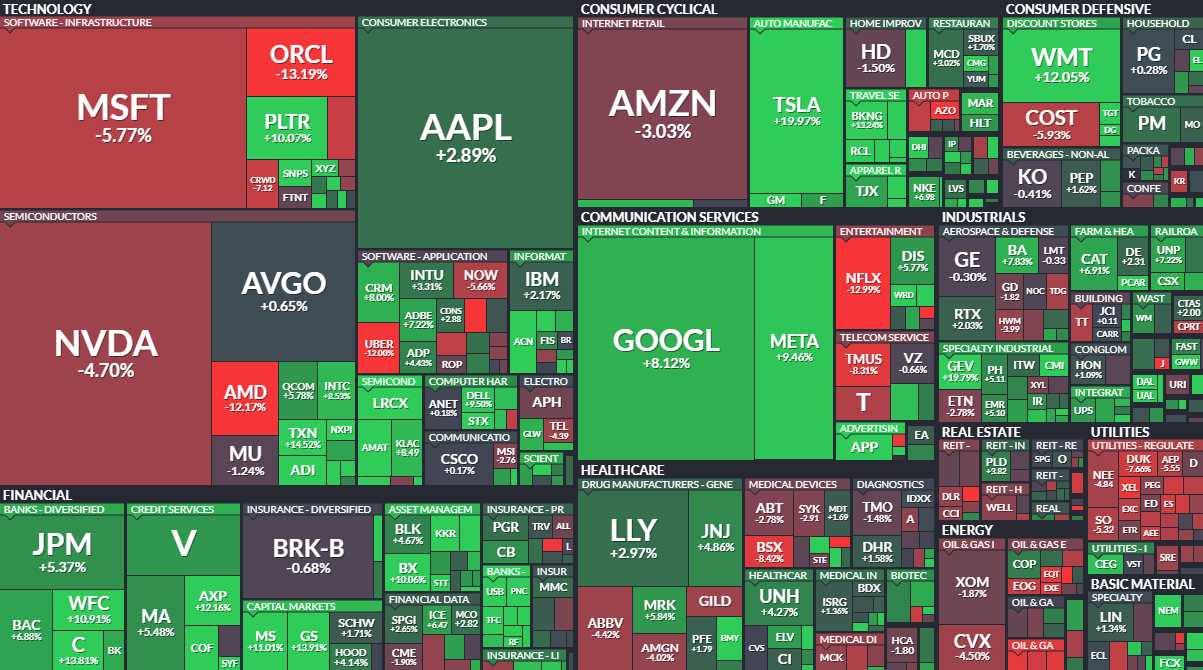
Under the surface, leadership has narrowed and rotated. Mega-cap tech and a handful of AI darlings are still doing the heavy lifting while whole sectors – especially energy and parts of healthcare – have quietly gone on sale. That’s exactly what long-term fundamental investors should want to see from an “overbought” market: dispersion, not disaster…

Since our last check-in, the S&P 500 has continued its “melt-up,” back to 6,800 BUT beneath the surface, the rotation is violent. We’ve seen a sharp pullback in some of our favorite sectors (Pharma, Energy) – which is EXACTLY what we had cash waiting for!

​Pfizer just guided lower for 2026, and the stock barely budged, cementing it as our Trade of the Year. Energy prices have softened, bringing our favorite pipelines (ET) back into the “buy zone.” This is the accumulation window for 2026. We are using this December volatility to deploy some of that massive cash pile into our “Final 4” conviction trades for the coming year.

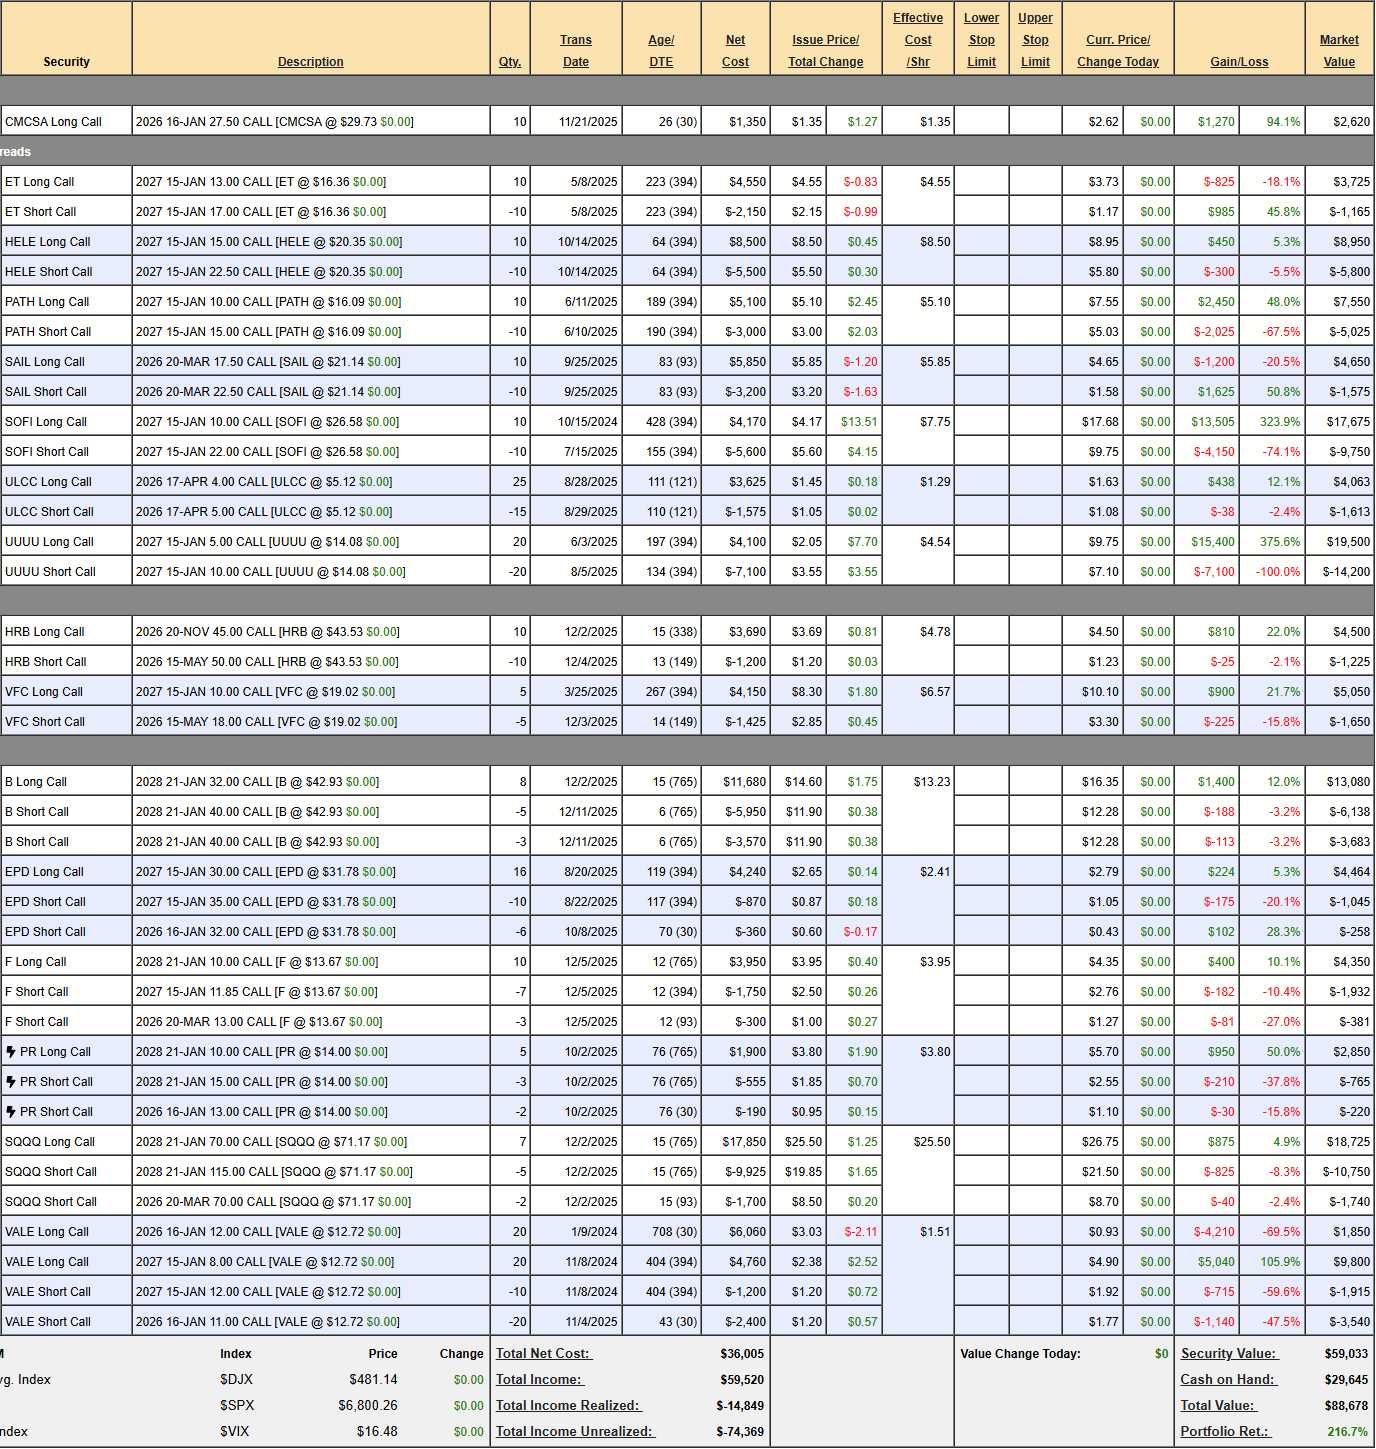
Remember where we came from this year: We cashed out before the Q1 crash, restarted the main portfolios on June 4th around S&P 6,000, and rode the market as it sprinted to 6,900 before that first real shakeout. Even after all the drama, we’re still sitting on triple‑digit gains for the year and, more importantly, a very healthy CASH!!! cushion that lets us treat the red on that screen as opportunity instead of catastrophe.

So for this December review, the goal is to get your head in that mindset before we even look at a single position:

First the big picture (SPX), then where the money actually flowed (Heat Map) since our Nov 19th Review, and NOW the portfolios. We’re not here to guess the next 100 point move on the index – we’re here to decide which companies are worth owning into 2026 (see our new Watch List 1 & 2 and our Top 20 List and our 2026 and our Trade of the Year)  and which ones just had a good run and can be replaced by something better.

Money Talk Portfolio Review: We just did it yesterday but I realize that, when I go to look for our positions, I use these monthly reviews and just posting the image doesn’t help me search so, to summarize:  

Symbol Key Long Spread Total Position P/L
AMAT 2028 $270/220 spread +$8,980
ARCB 2026 $90/70 spread +$4,048
B 2027 $20/15 spread +$12,140
BCS 2028 $25/18 spread +$9,695
IVZ 2028 $25/20 spread +$8,120
LMT 2028 $500/450 spread +$1,591
NOK 2026 $4.5/3 spread +$5,440
OZK 2028 $55/30 spread +$26,840
PFE 2027 $27/20 spread +$2,230
SLB 2028 $42.5/30 spread +$5,033
SYF 2027 $50 Call (No vertical short) +$27,365
T Short Put (No spread) +$3,353
TGT 2028 $115/85 spread +$10,250
WHR 2028 $90/60 spread +$18,080
XOM 2027 $130/110 spread +$943


So, that’s all we need to worry about at the moment – it does not reflect the adjustments we made yet, of course.  

$700/Month Portfolio Review: Also JUST reviewed 2 weeks ago but two weeks is a long time in these markets so let’s take a quick look. We were at $82,818 and now we’re at $88,678 – so it’s been a great two weeks but the trick is whether we can lock in our gains and keep them in the next fluctuation? 

For example, in the MTP yesterday, we locked in our biggest gain by cashing out the +$27,365 SYF longs for $54,825 – THAT is how we make sure we lock in profits!

Symbol Key Long Spread Total Position P/L
B 2028 $32/40 spread +$1,099
CMCSA 2026 $27.50 Call +$1,270
EPD 2027 $30/35 spread +$151
ET 2027 $13/17 spread +$160
F 2028 $10/11.85 spread +$137
HELE 2027 $15/22.5 spread +$150
HRB 2026 $45/50 spread +$785
PATH 2027 $10/15 spread +$425
PR 2028 $10/15 spread +$710
SAIL 2026 $17.5/22.5 spread +$425
SOFI 2027 $10/22 spread +$9,355
SQQQ 2028 $70/115 spread +$10
ULCC 2026 $4/5 spread +$400
UUUU 2027 $5/10 spread +$8,300
VALE 2027 $8/12 spread -$1,025
VFC 2027 $10/18 spread +$675


I think we’re fine for now – next review is early January and we have plenty of cash to spend AND we even have a hedge in this portfolio…

This is a great example of Buffett’s Rule #1: Don’t lost money! If you follow that rule by making solid, defensible selection that consistently grind out premium returns – a few of them (SOFI, UUUU, ones we’ve already cashed…) will surprise you and you’ll do better than planned WITHOUT taking unnecessary risks. 

Consistency is what matters over time.  

Short-Term Portfolio (STP) Review: These are our hedges and also the hedges of our hedges (in case the market goes up) and also some short-term trades that need more daily attention than we give the LTP. We had a great month as we called the dip AND the recovery correctly and that is a bit of gambling we allow ourselves – only because I’m REALLY good at making those calls (using our 5% Rule™, of course).  

Our SPY, SQQQ and TZA positions are insurance policies which, like Life Insurance, we HOPE to lose money on but, because we know how to BE the House – we also know that we can sell premium against our insurance policies to other people who think they will die (or live – we don’t care) and, if that premium is greater than the premium we’re paying – we can actually make a profit while still being well-insured.  That’s the STP in a nutshell: 

    • TSLA – How dare we short TSLA!  $3,750 down the drain on that one.  
    • Short Puts: Are there any we don’t REALLY want to own at the net strike? I’m just looking at the questionable ones: 
    • B – Not much left to gain but so low at the net ($25.50) that there’s no point in buying them back.
    • CSCO – Also one we’d love to own at the net as are DHI, EPD, FCX, GOOGL, HELE, LULU (liked them twice!), ON and TGT (another two-timer).
    • That leaves T at net $26.10 and we already have lots of it in the LTP but I sure don’t mind buying lots more down here and it’s “only” 2,000 potential shares so we’ll take advantage of the dip, which has left this position with just $1 in premium, and we’ll roll these short puts ($14,000) to 40 2028 $25 puts at $4 ($16,000).  So we collected net $2,000 and we started with $7,800 so now that’s $9,800/4,000 contract = $2.45/contract or net $22.55 is our new entry on 4,000 shares of T – if all goes well?  
    • And, keep in mind that IF we are assigned 4,000 shares of T at $22.55, it pays a 7% ($1.70) dividend which is really a 7.5% dividend at our net AND we would simply sell 2028 $23 calls (now $3.75) to drop our basis to $18.80 by putting $15,000 back in our pocket. THAT is what our decision is based on – 3 moves down the line we’re fine with the worst case! I think I’d even sell more puts….

Finviz Chart

    • TZA – With all Ultra ETFs, they go 3x inverse to the underlying (Russell in this case) and we hedge against a 20% drop so 1.6 x $7.20 is $11.52 so that is our “protection” and our short calls are $10 so it’s a $5 x 200 spread for $100,000. The current net is $44,750 and that’s about how in the money we are. With 50 open longs it’s a sin not to sell premium so let’s sell 75 April $7 calls for $1.10 ($8,250) using 121 of the 765 days we have to sell.
    • You can see how we are going to be able to recoup our $44,750 outlay over time so FREE INSURANCE is the best kind of insurance – don’t you think? If TZA does pop, the 2027 $10s are $1.35 – MORE than the April $7s so we can expect to roll out of trouble and we’ll have 25 extra (uncovered) calls to deal with – so mental stops on those 25 if they go over $2 ($5,000). 
    • Call this net $60,000 downside protection. 

Finviz Chart

    • SPY – This is the underlying 1x ETF so we’re playing the put side but same rules apply. 20% drop on SPX takes SPY down to $542 so about $100 spread x 15 = $150,000 potential (the time difference makes it a lot more but we like to be conservative) and the current net is $44,943 so we know this is a more efficient spread than TZA – just by doing our math!  
    • The $635 puts should go worthless and we have 8 uncovered puts so we may as well sell 10 (2 oversold) March $645 puts for $10.15 ($10,150) following the same logic that we’d like to make our $44,493 back and the 2027 $540 puts are $13.50 – so we will get our $100 spread – even if the S&P drops enough to give us trouble. Call this net $100,000 downside protection

Finviz Chart

    • TSLA – Not too much damage thanks to Theta being on our side but is it worth sticking with? We’re crossing the threshold where March is not a very exciting place for us to be. The Jan $350 puts are $39 and the $250 puts are $15 so net $24 if we roll there ($48,000) and we can sell 10 (aggressive but we have the March puts) Jan $450 puts for $11.30 ($11,300) and obviously they can roll down to the Jan $250s so we should be good for 10x(ish) $11(ish) ($110,000ish) back on our net $36,700 outlay so, why not? Upside potential here is $73,300 (199%).  
    • Remember, this one pays off if the market DOESN’T go down (unless TSLA goes down on it’s own, of course) so it’s a great hedge for our hedges.  

Finviz Chart

    • WBD – I thought we already killed them but kill them.  

Finviz Chart

    • SQQQ – The 22 short are the translated short calls from the old SQQQs we were stuck with. I translated them because the old ones showed zero value and weren’t very informative. SQQQ is at $71.17 so our 20% downside target is 1.6 x $71.17 = $113.87 so we’re in great shaped and I think we’ll kill the short $90 calls ($2,295) and wait and see where we are in January before selling more short calls.  It’s a $300,000 spread, currently at net $12,390 so we have a FANTASTIC $287,610 of downside protection and that is, by far, the most efficient hedge!  

Finviz Chart

    • SRPT – Right on track, making good steady progress at net $16,487 on the $22,500 spread. The short calls should go worthless and then we sell 15 more for the next Q and this is a lovely little income-producer!  

Finviz Chart

So it’s:

Cash Outlays (Spends):

      • TSLA: Rolling the Jan $350 puts to Jan $250 puts ($48,000 cost) and selling Jan $450 puts ($11,300 credit) resulted in a net outlay of $36,700.

      • SQQQ: Buying back (“killing”) the short $90 calls cost $2,295.

      • WBD: The instruction is to “kill them” (close the position), but no specific price was listed in the text, implying a negligible cost or one not factored into the total provided estimates.

Cash Inflows (Credits/Income):

      • T: Rolling the short puts to 2028 $25 puts generated a net collection of $2,000.

      • TZA: Selling 75 April $7 calls generated $8,250.

      • SPY: Selling 10 March $645 puts generated $10,150.

Net Calculation:

      • Total Spent: $38,995

      • Total Collected: $20,400

Net Amount Spent: $18,595

That leaves us with PLENTY of cash (over $360,000) on the sidelines and we have $440,610 of downside protection against a 20% drop in the market and we LOVE our longs so this sound very, very good to me! Also, we just survived a nice 5% stress test – also great!!!  


IN PROGRESS


Subscribe
Notify of
5 Comments
Inline Feedbacks
View all comments