
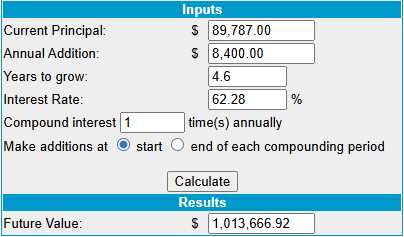
 $89,787!
That’s up $6,969 (since our Dec 2nd Review) but $700 of that was our monthly deposit but we still gained net $6,269 (7.5%) in a very nice 30-days for us – where we pretty much left things alone, actually. We’re on track to hit our $1M goal by the fall of 2030 and, when I say “on track” I mean over 20 years ahead of our original 30-year goal!
We are now pacing at an annualized 62.28% and that’s nicely up from 58.74% last month and we know it’s an unsustainable pace but we will still hate to see it go. Last month we suffered from a declining VIX and that stopped hurting us in December and, of course, TIME is always on our side. We still have $910,213 (1,013%) left to gain and we have $28,730 (31.9%) in CASH!!! in a portfolio that’s using NO margin – so it’s all ready to deploy…
Despite all the excitement of the last 30 days – we’re back were we were at the start of December and THAT is why we did so well this period – because we did NOTHING! and NOTHING! allowed all that short premium we sold to wind down and THAT is how we reliably make our money – NOT by trying to time the market…
If you are just coming in, we began on Aug 25th, 2022 ago with $700 and each month we added $700 ($28,700) so far and each month we find things to buy under NO MARGIN rules (for 401K/IRA players). This is, despite the huge gains, a fairly conservative portfolio and we are generally quick to take our profits and run – as we always seem to find new opportunities to make more. Last year, our 11 prior Portfolio Reviews were:
-
- How to Become a Millionaire by Investing $700 per Month – Part 40/360
- How to Become a Millionaire by Investing $700 per Month – Part 39/360
- How to Become a Millionaire by Investing $700 per Month – Part 38/360
-
How to Become a Millionaire by Investing $700 per Month – Part 37/360 – Year 4 Begins!
-
How to Become a Millionaire by Investing $700 per Month – Part 36/360 – 3 Years In!
- How to Become a Millionaire by Investing $700 per Month – Part 35/360
- How to Become a Millionaire by Investing $700 per Month – Part 34/360
- How to Become a Millionaire (EVEN in This Market) by Investing $700 per Month – Part 33/360
- How to Become a Millionaire – EVEN in a CRASH!!! by Investing $700 per Month – Part 32/360
- How to Become a Millionaire by Investing $700 per Month – Part 31/360
- How to Become a Millionaire by Investing $700 per Month – Part 30/360
- How to Become a Millionaire by Investing $700 per Month – Part 29/360
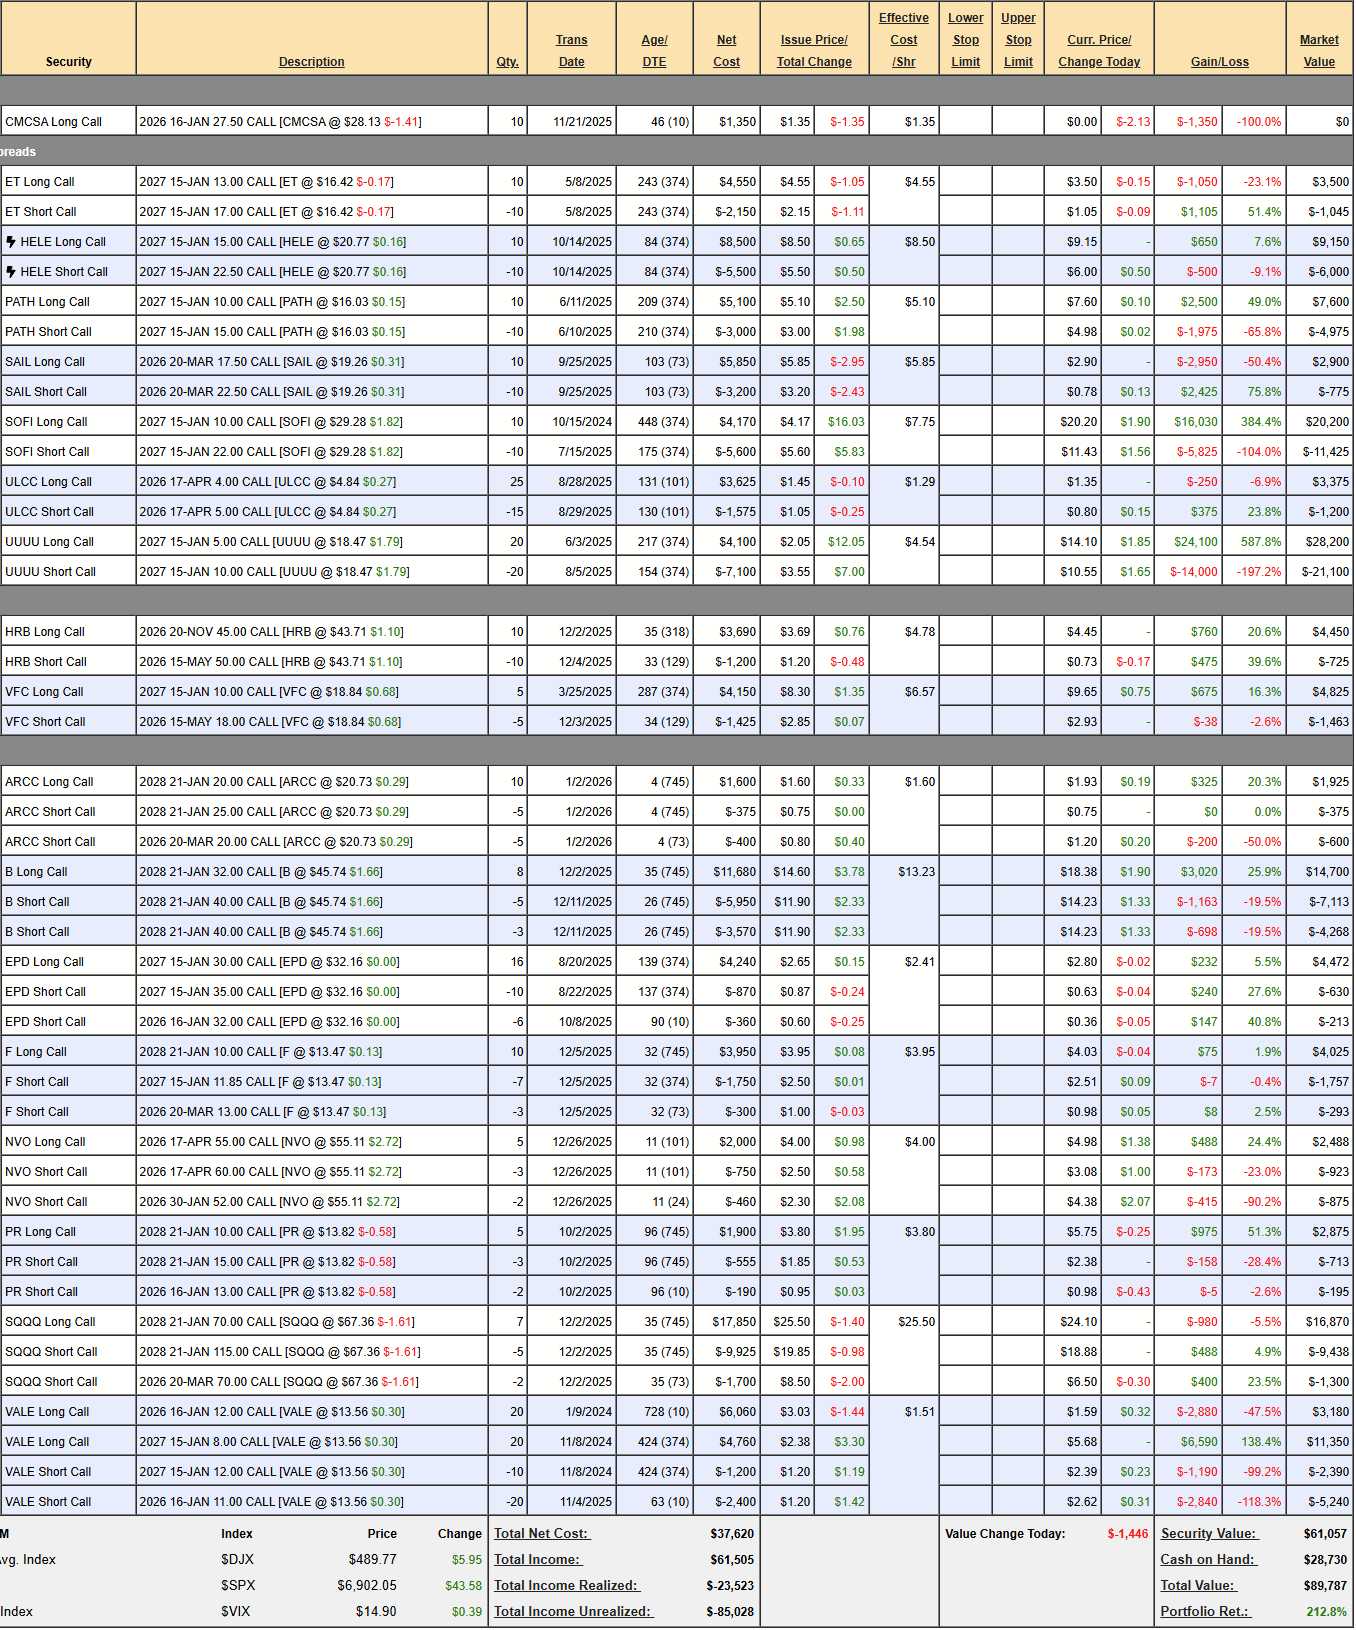
Now you are all caught up. We have just $47,111 in positions at the moment and the rest is CASH ($35,707) and we need to re-establish our SQQQ hedge and THEN we will certainly be looking for more things to buy – either here today or in our Live Member Chat Room in the month ahead.
As usual, before we consider adding positions, we first see if any of our current positions (18 now) need to be adjusted:
-
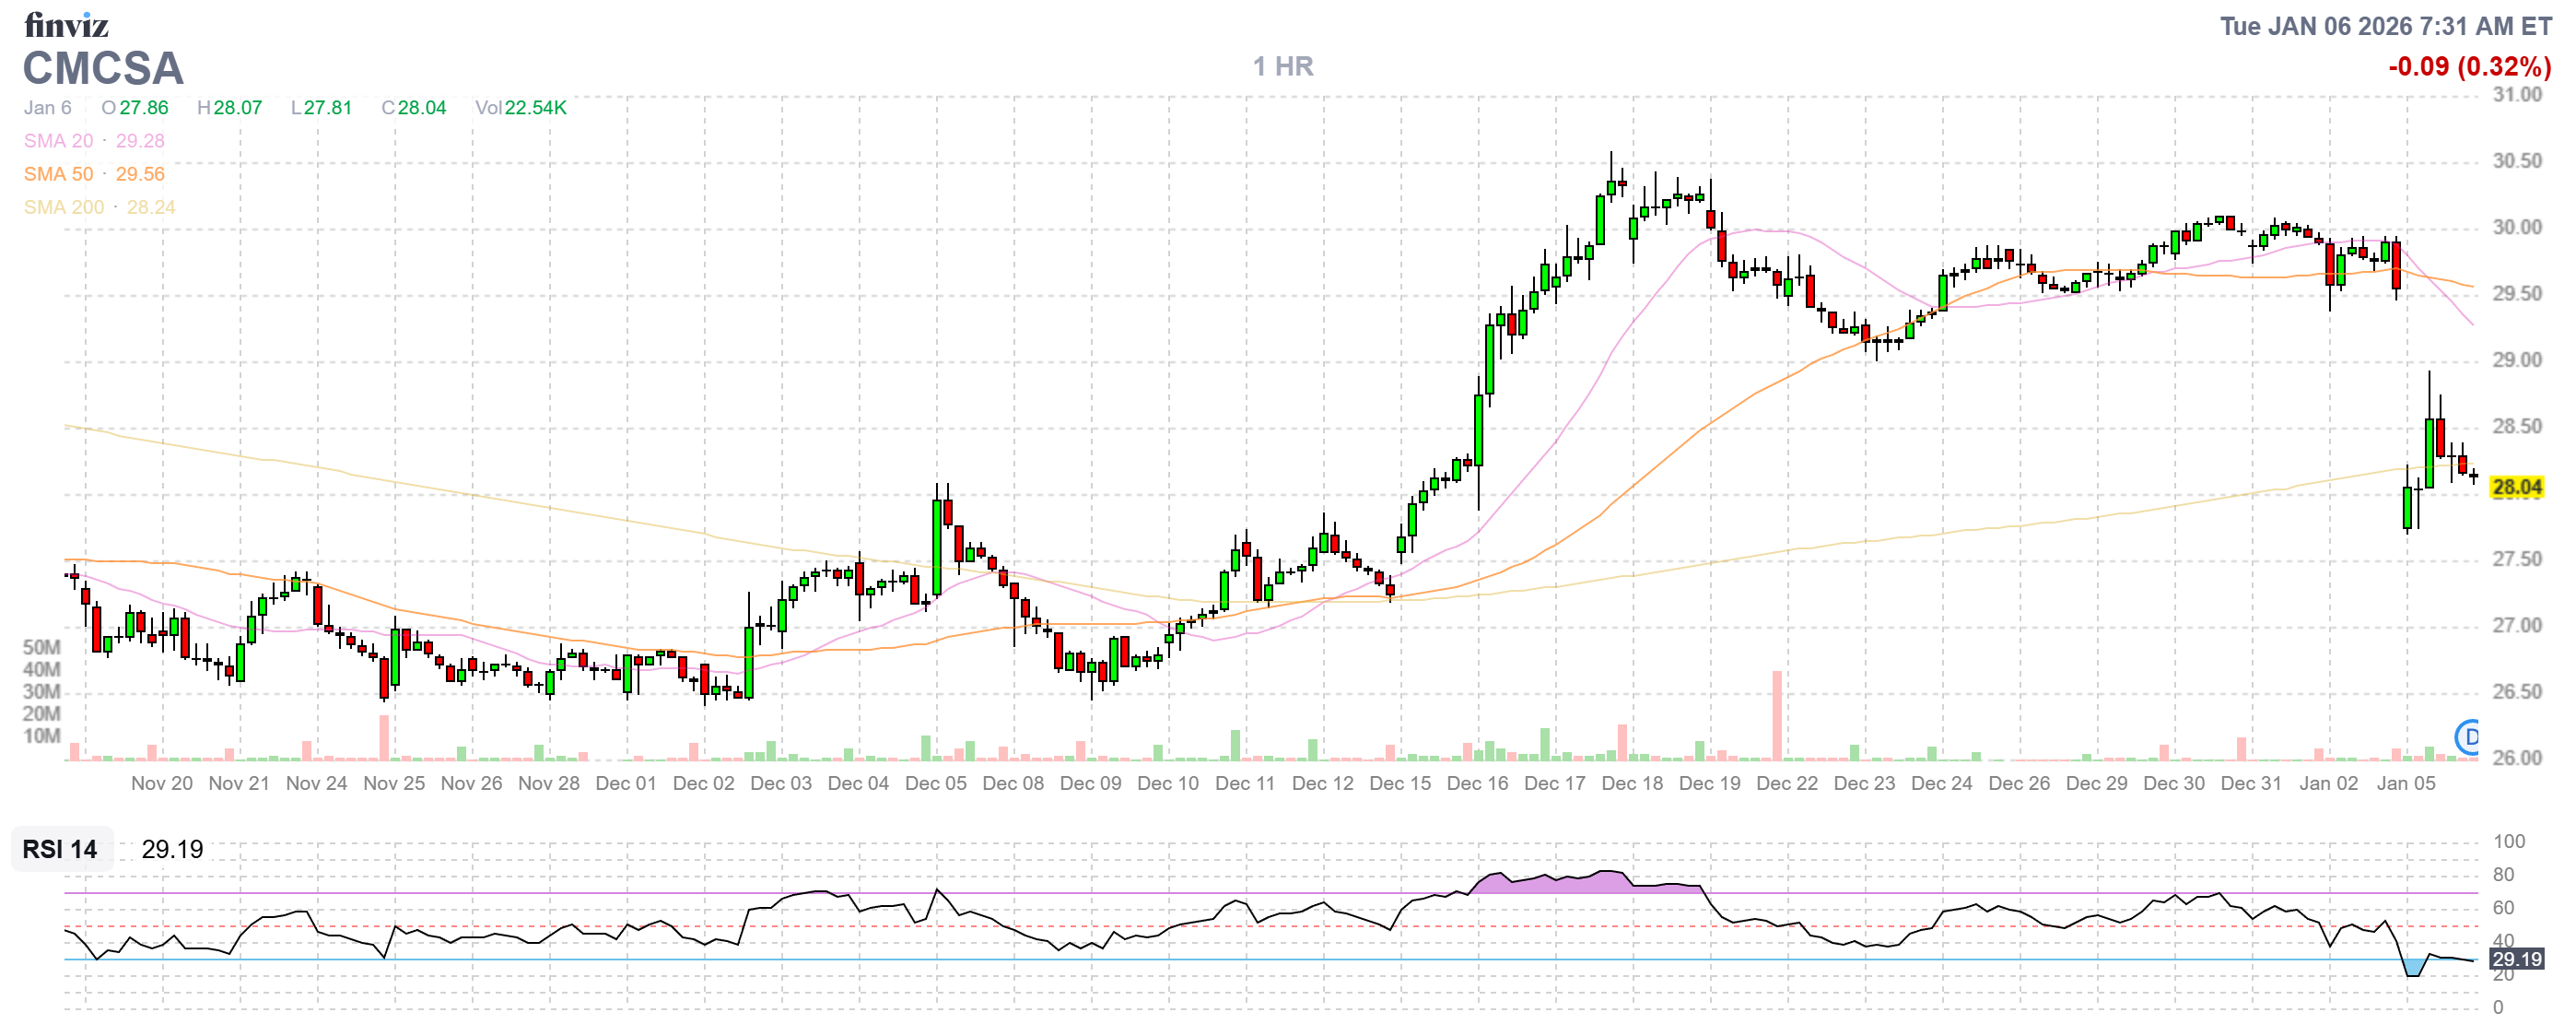
- CMCSA – Oh hey, we’re doing better than we thought as this is the old contract that got zero’d out on us as the company split off a division. CMSCA is back at $28 this morning so our Jan calls are 0.50 at least but we also now have 40 shares of VSNT. It looks like we can get out of our shares for $2.10 ($2,100) so let’s do that if they are trading today and, if not, we’ll see both sets of the split options.
-
- ET – This one is interesting as they are at $16.42 (0.58 from goal with a year to go) but the net of the spread is just $2,455 out of a potential $4,000 – so there’s $1,545 (62.9%) left to gain in 12 months – still good for a new trade!
- HELE – Also near our 2027 goal at net $3,150 on the $7,500 spread so this one has $4,350 (138%) upside potential – GREAT for a new trade!
- PATH – Over our goal at net $2,625 on the $5,000 spread so this one has $2,375 (88.7%) left to gain – also GREAT for a new trade. No wonder we’re making so much money in this portfolio!
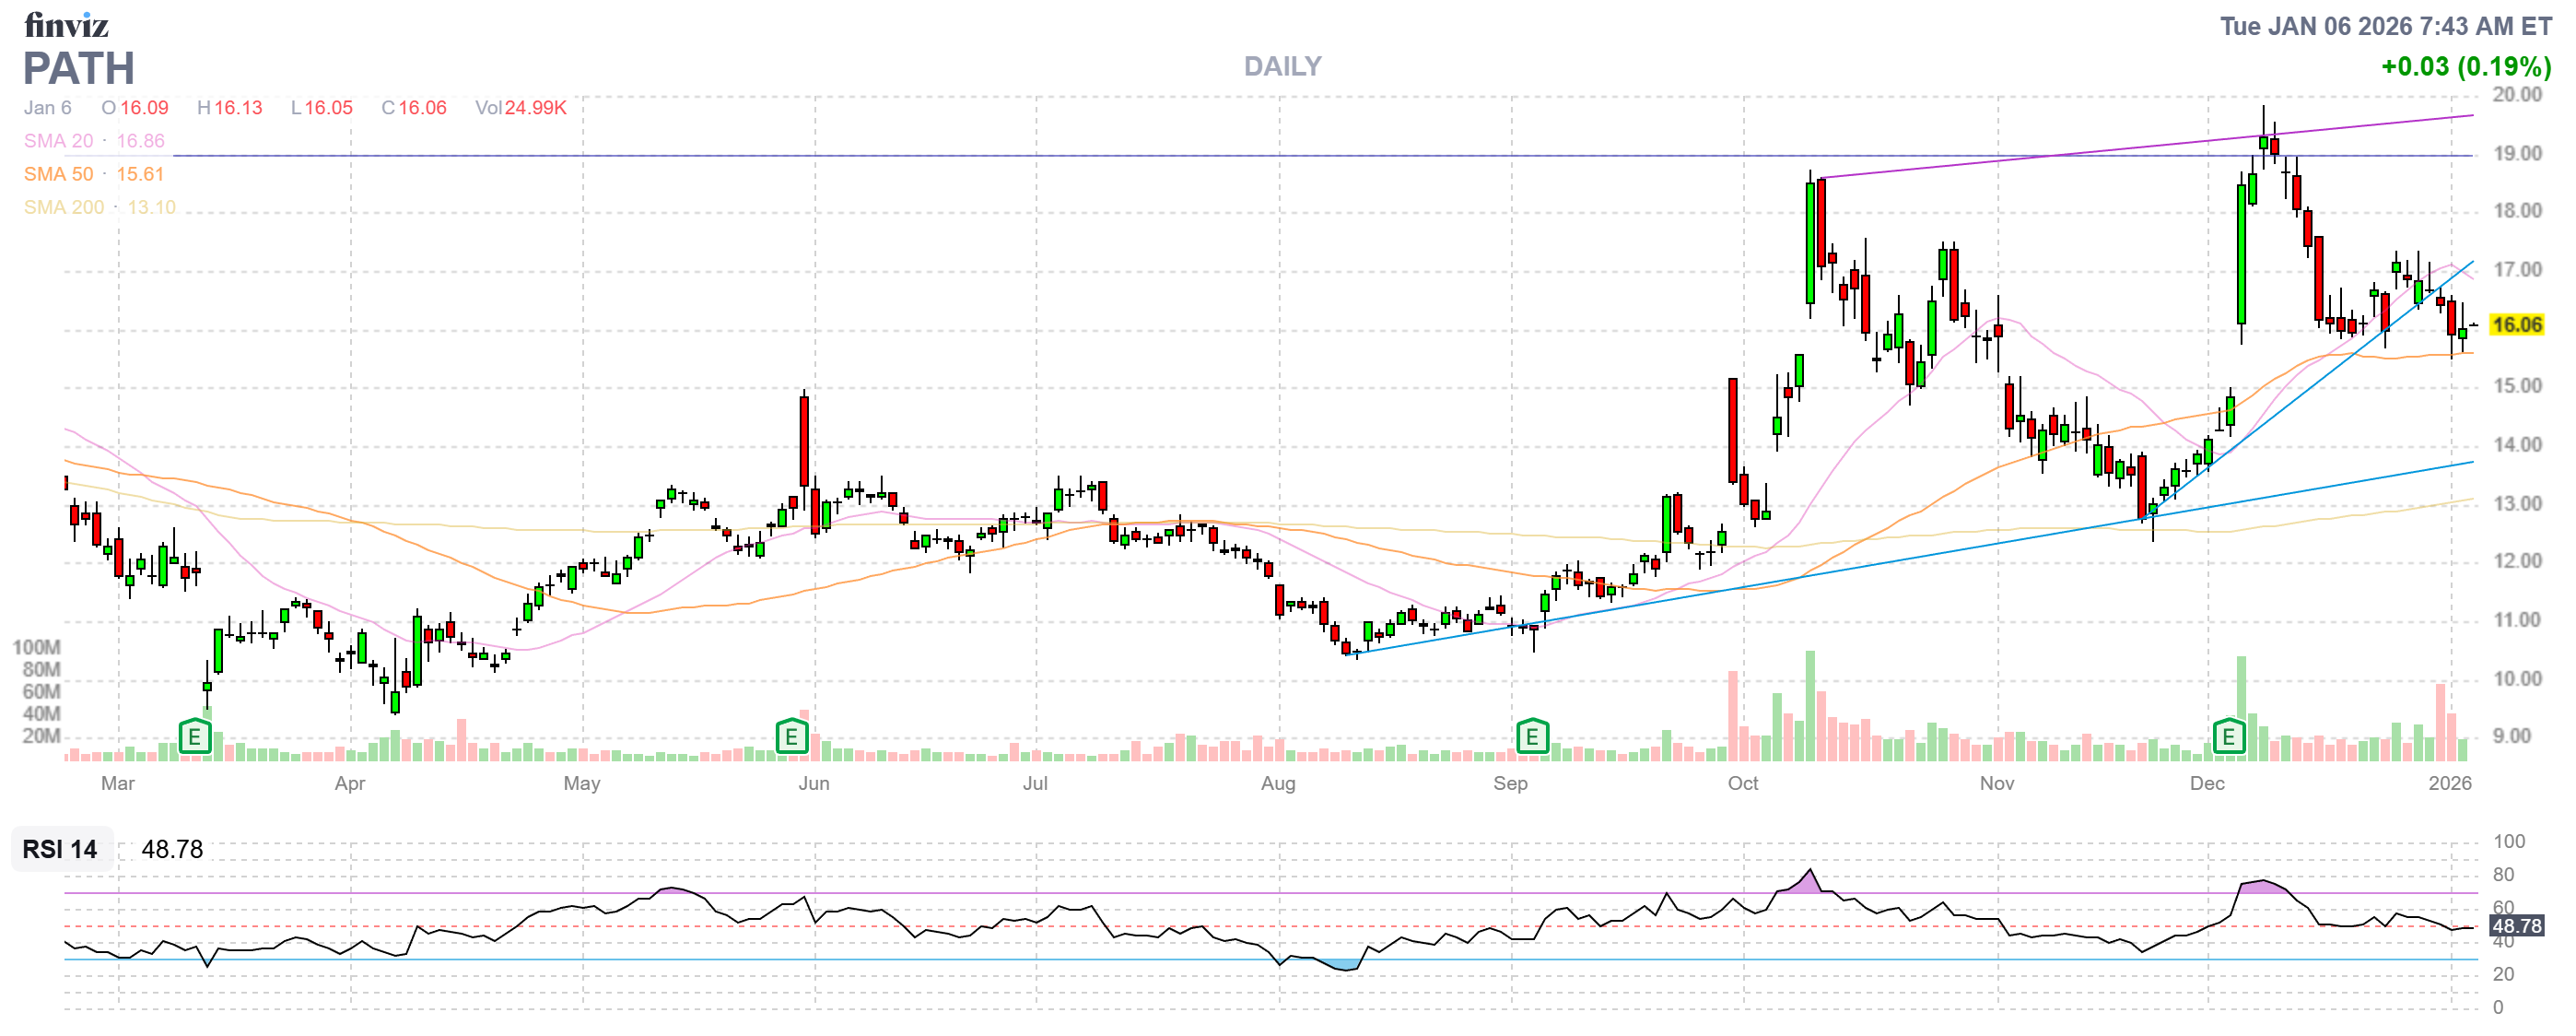
When we took the PATH trade on June 11th, it was at $13 and the target was $15 on a very simple $10/15 bull call spread (no margin, limited risk) which we bought for net $2.10 ($2,100). Despite being $1 over our goal, we’ve only gained $525 (25%) so far and now all PATH has to do is NOT fall below $15 for us to collect another $2,375 (88.7%). THAT is why it’s GREAT for a new trade – the risk has been reduced and the reward is quite high!
-
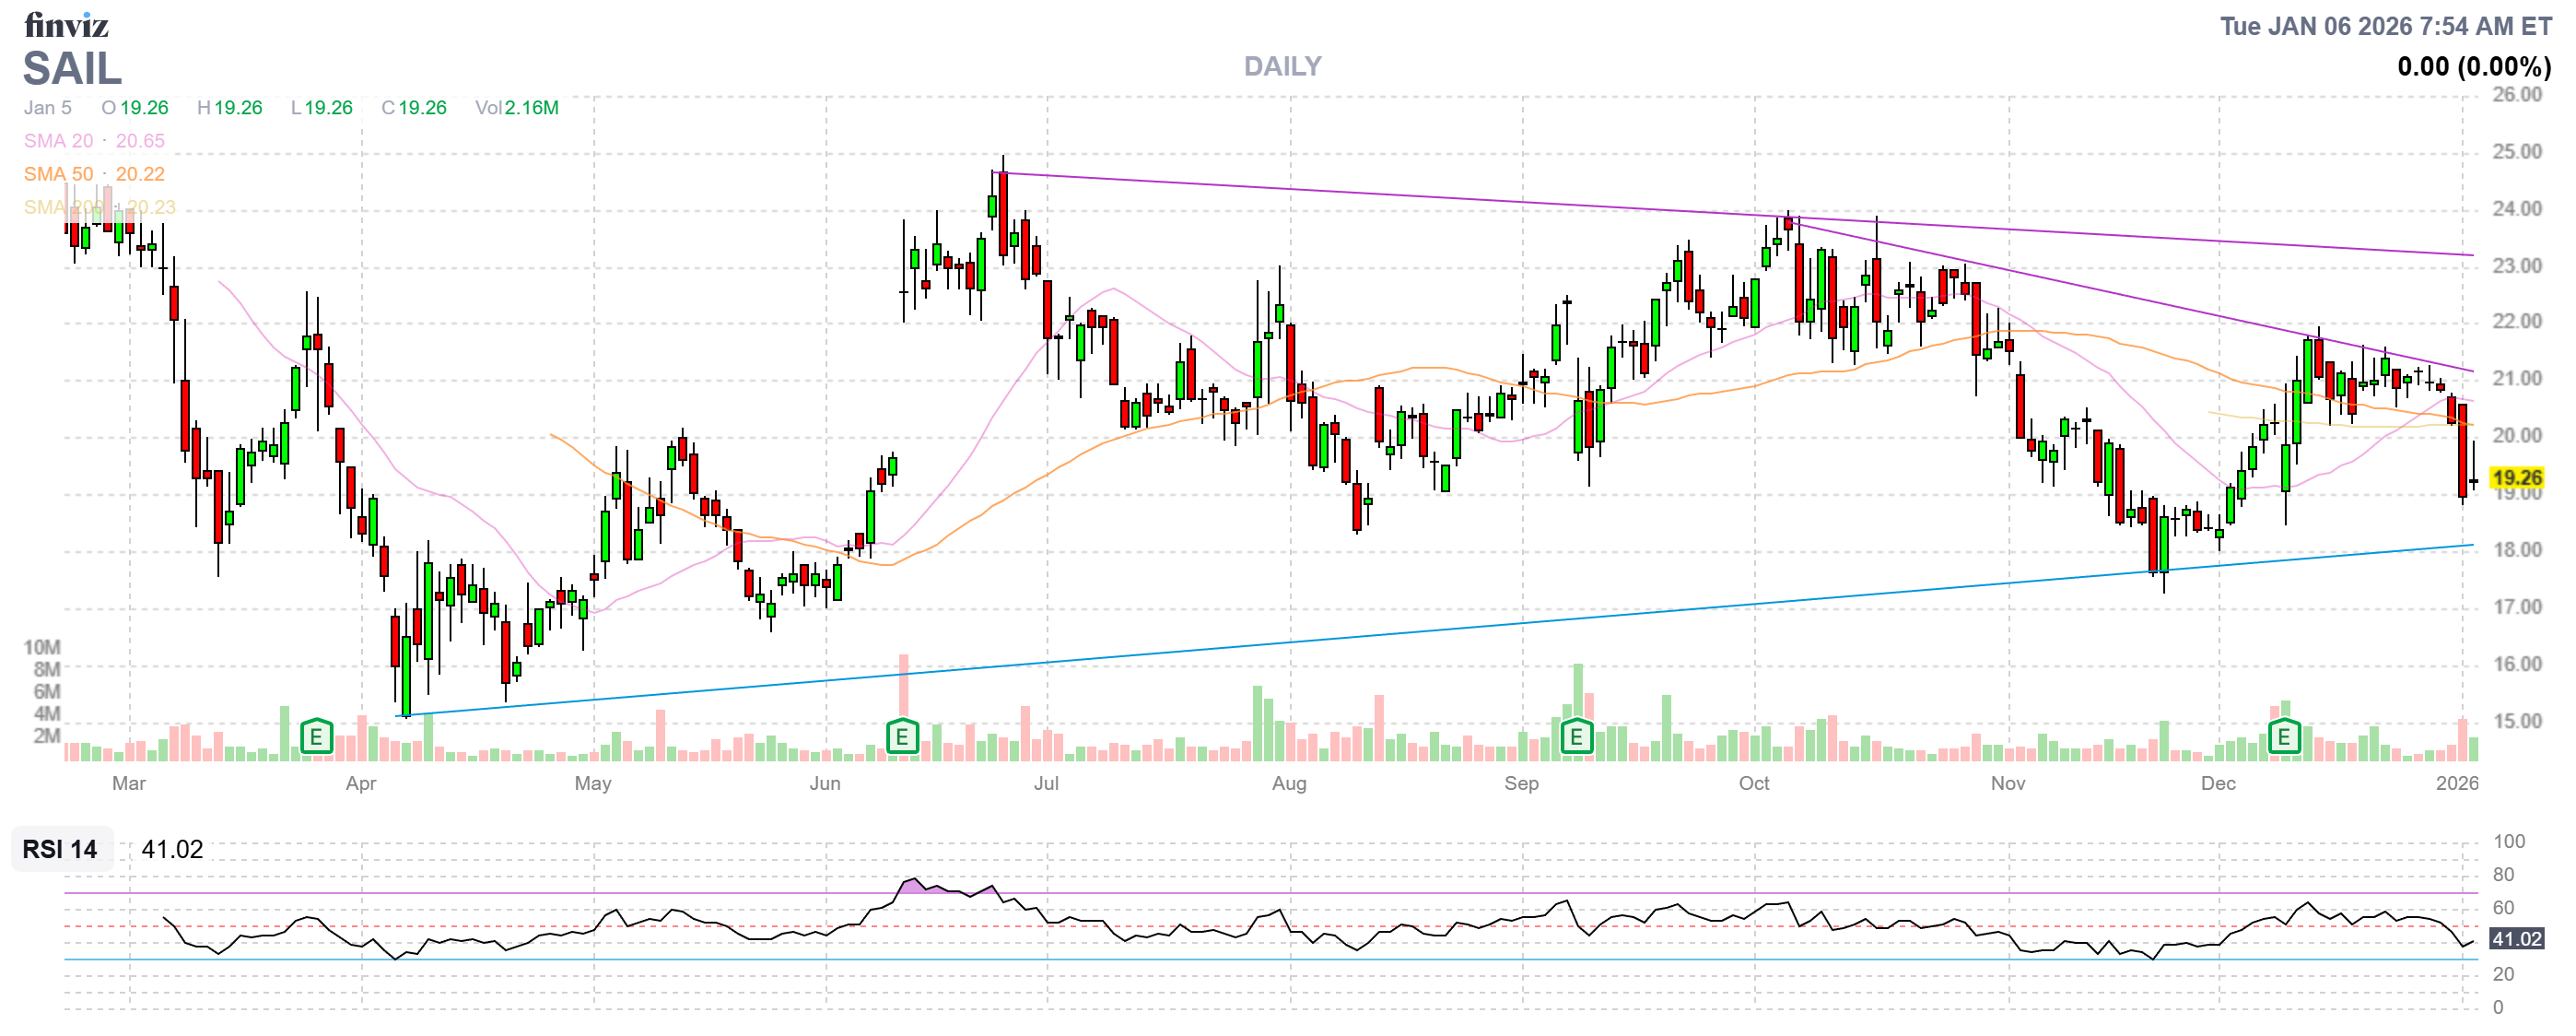
- SAIL – Took a huge hit last week but we paid $2.60 and it’s $2.26 in the money so not only will we give it a chance to bounce but let’s buy back 5 (half) short $22.50 calls for $388 and see if that helps. We can only make $388 by March ($130/month) – so it’s not that risky.
-
- ULCC – Came down a lot (was $6) on uninspiring revenue projections but I want to give them until next earnings (early Feb) as I think the overall outlook for 2026 should be improving. It’s a $2,500+ spread if we can get back to $5 and currently net $2,175 with $325 (14.9%) upside potential in 4 months – not terrible.
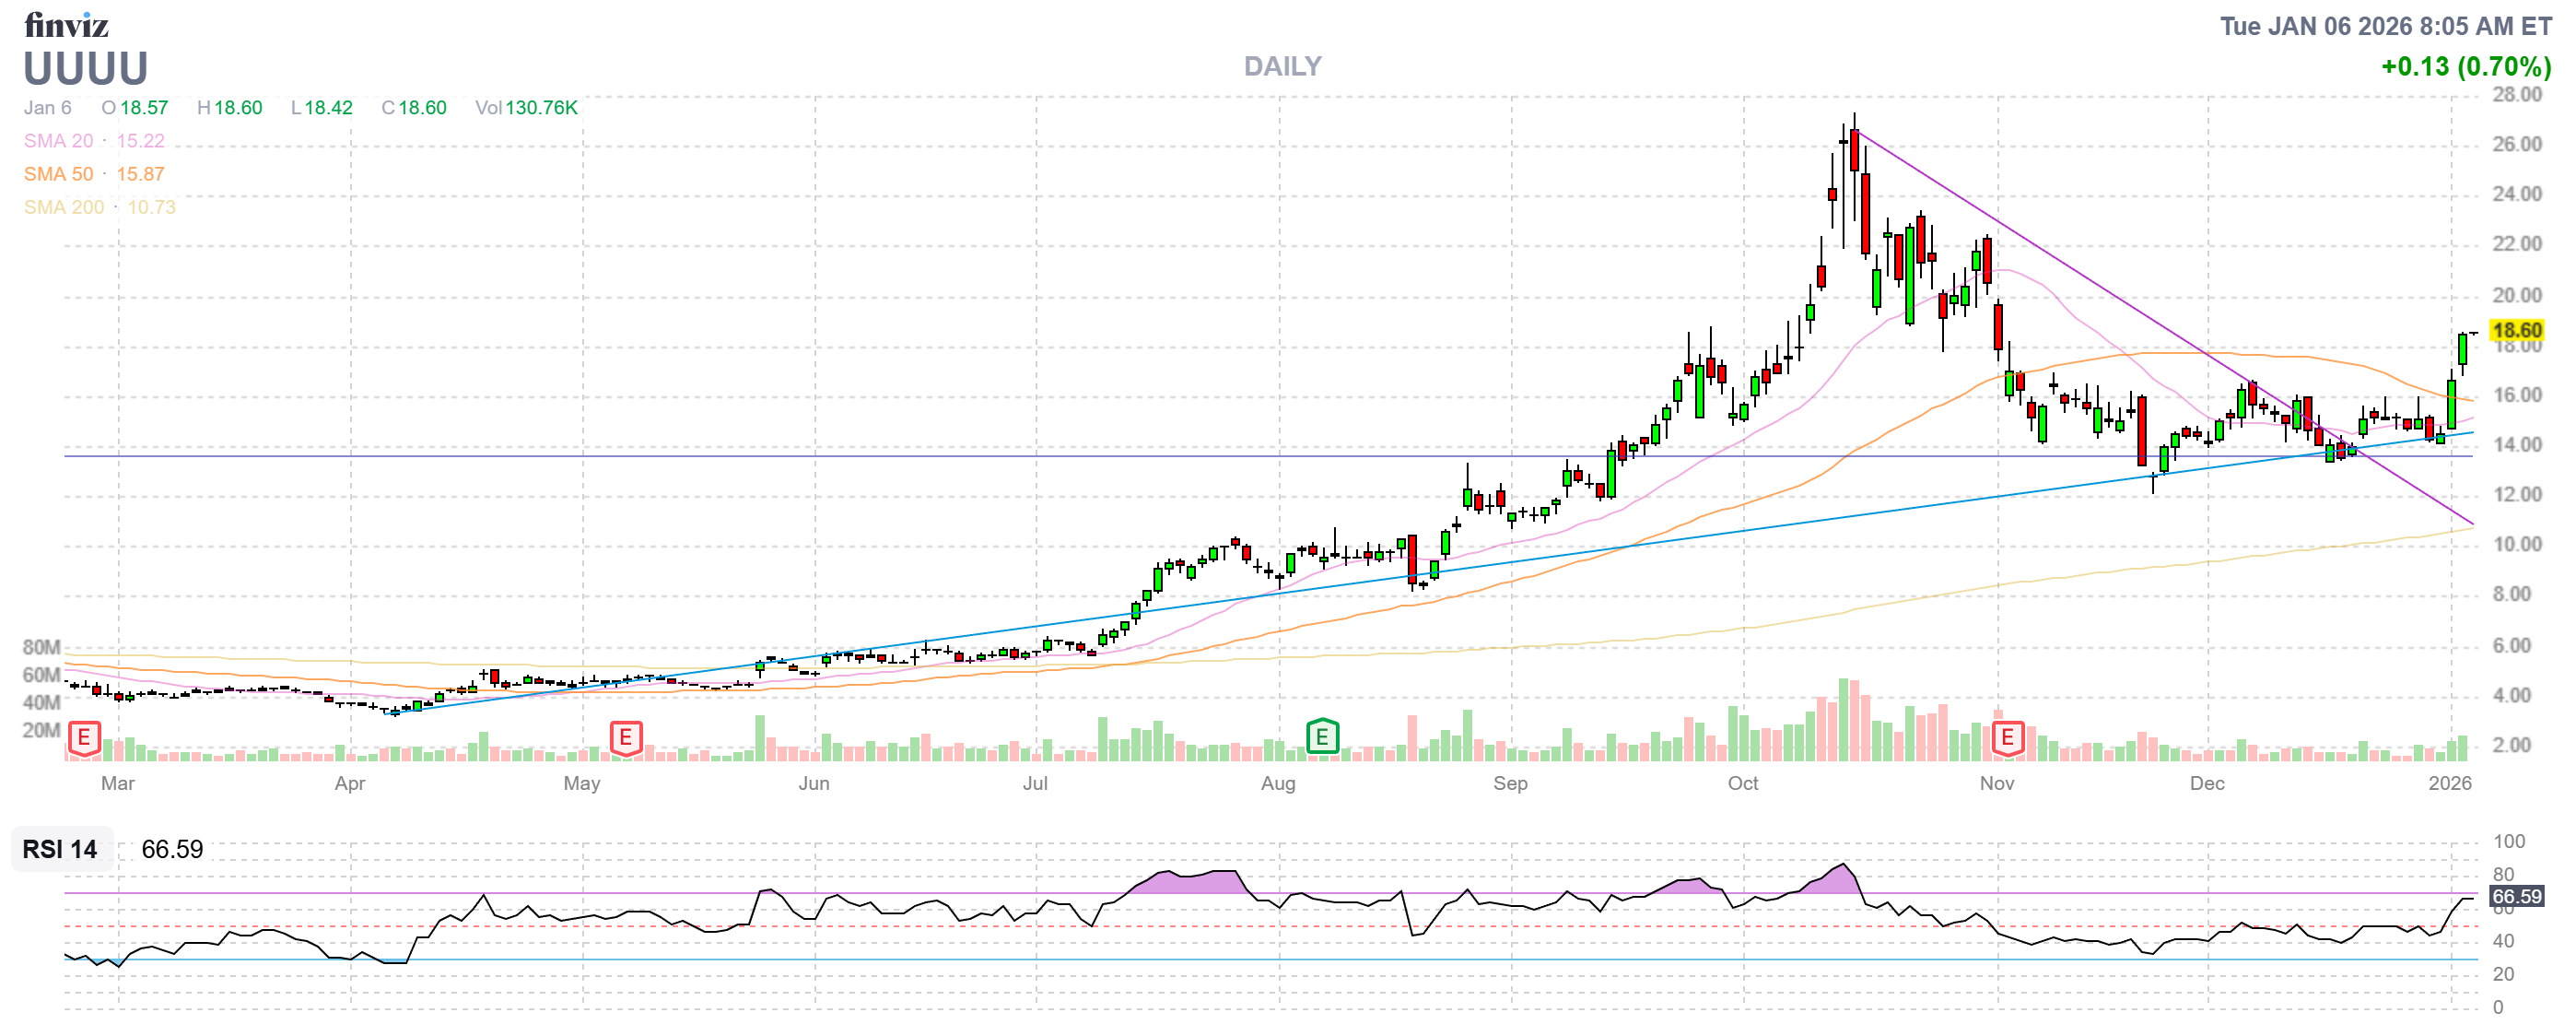
- UUUU – Almost double our target at net $7,100 on the $10,000 spread so we just have to wait to collect $2,900 (40.8%) of upside potential. This is way less than our 62.28% average which makes it NOT good for a new trade but it’s so “safe” that there’s no sense cashing it in if we don’t have something better to do with the money, right?
-
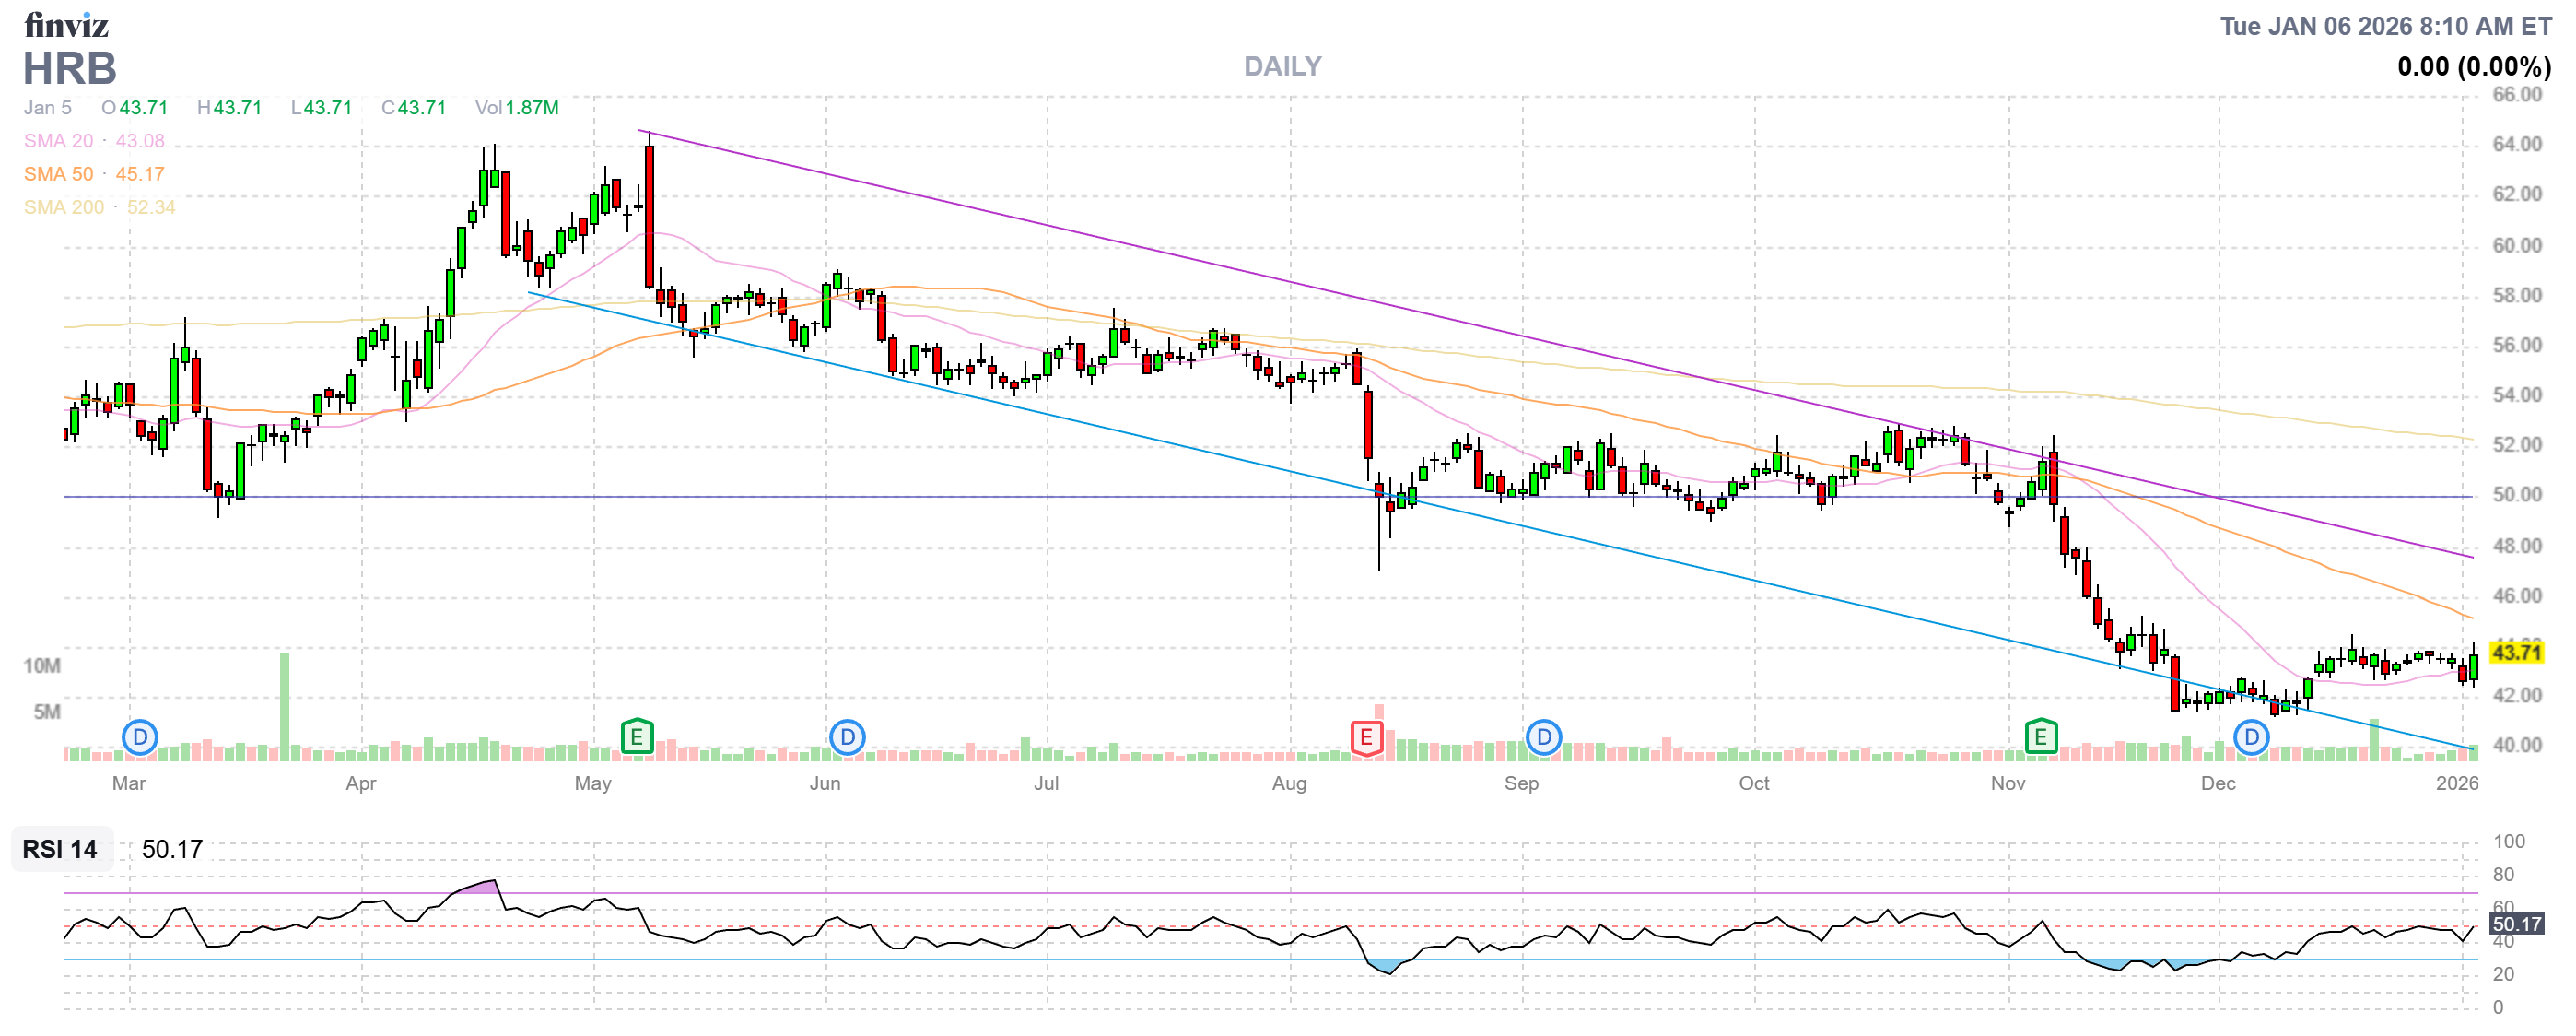
- HRB – I’m kind of dumbfounded that the new tax filing rules aren’t boosting them more. As we get into tax season, I expect the story to catch on. It’s currently net $3,725 on the $5,000 spread with $1,275 (34%) upside potential but either the short May calls go worthless or we roll them so it’s got more potential than it looks like and the May sale means we can collect another $1,200 (32.2%) and then there will be a November sale – so no reason to get out of this – even though it’s off track at the moment.
-
- VFC – Over our goal at net $3,362 on the $4,000 spread so we have $638 (18.9%) upside potential but that’s by May – so it’s a keeper!
- ARCC – This is an income spread so we just patiently wait for March and we’ll either roll or sell more short calls. It’s a $5,000 spread at net $950 so we have $4,050 (426%) upside potential AND we have 7 more quarters to sell 0.80 ($400) which is another $2,800 (294%) while we wait. Since the amount we expect to collect more than covers the cost of the spread – this is essentially a free trade and, therefore, GREAT for a new one!
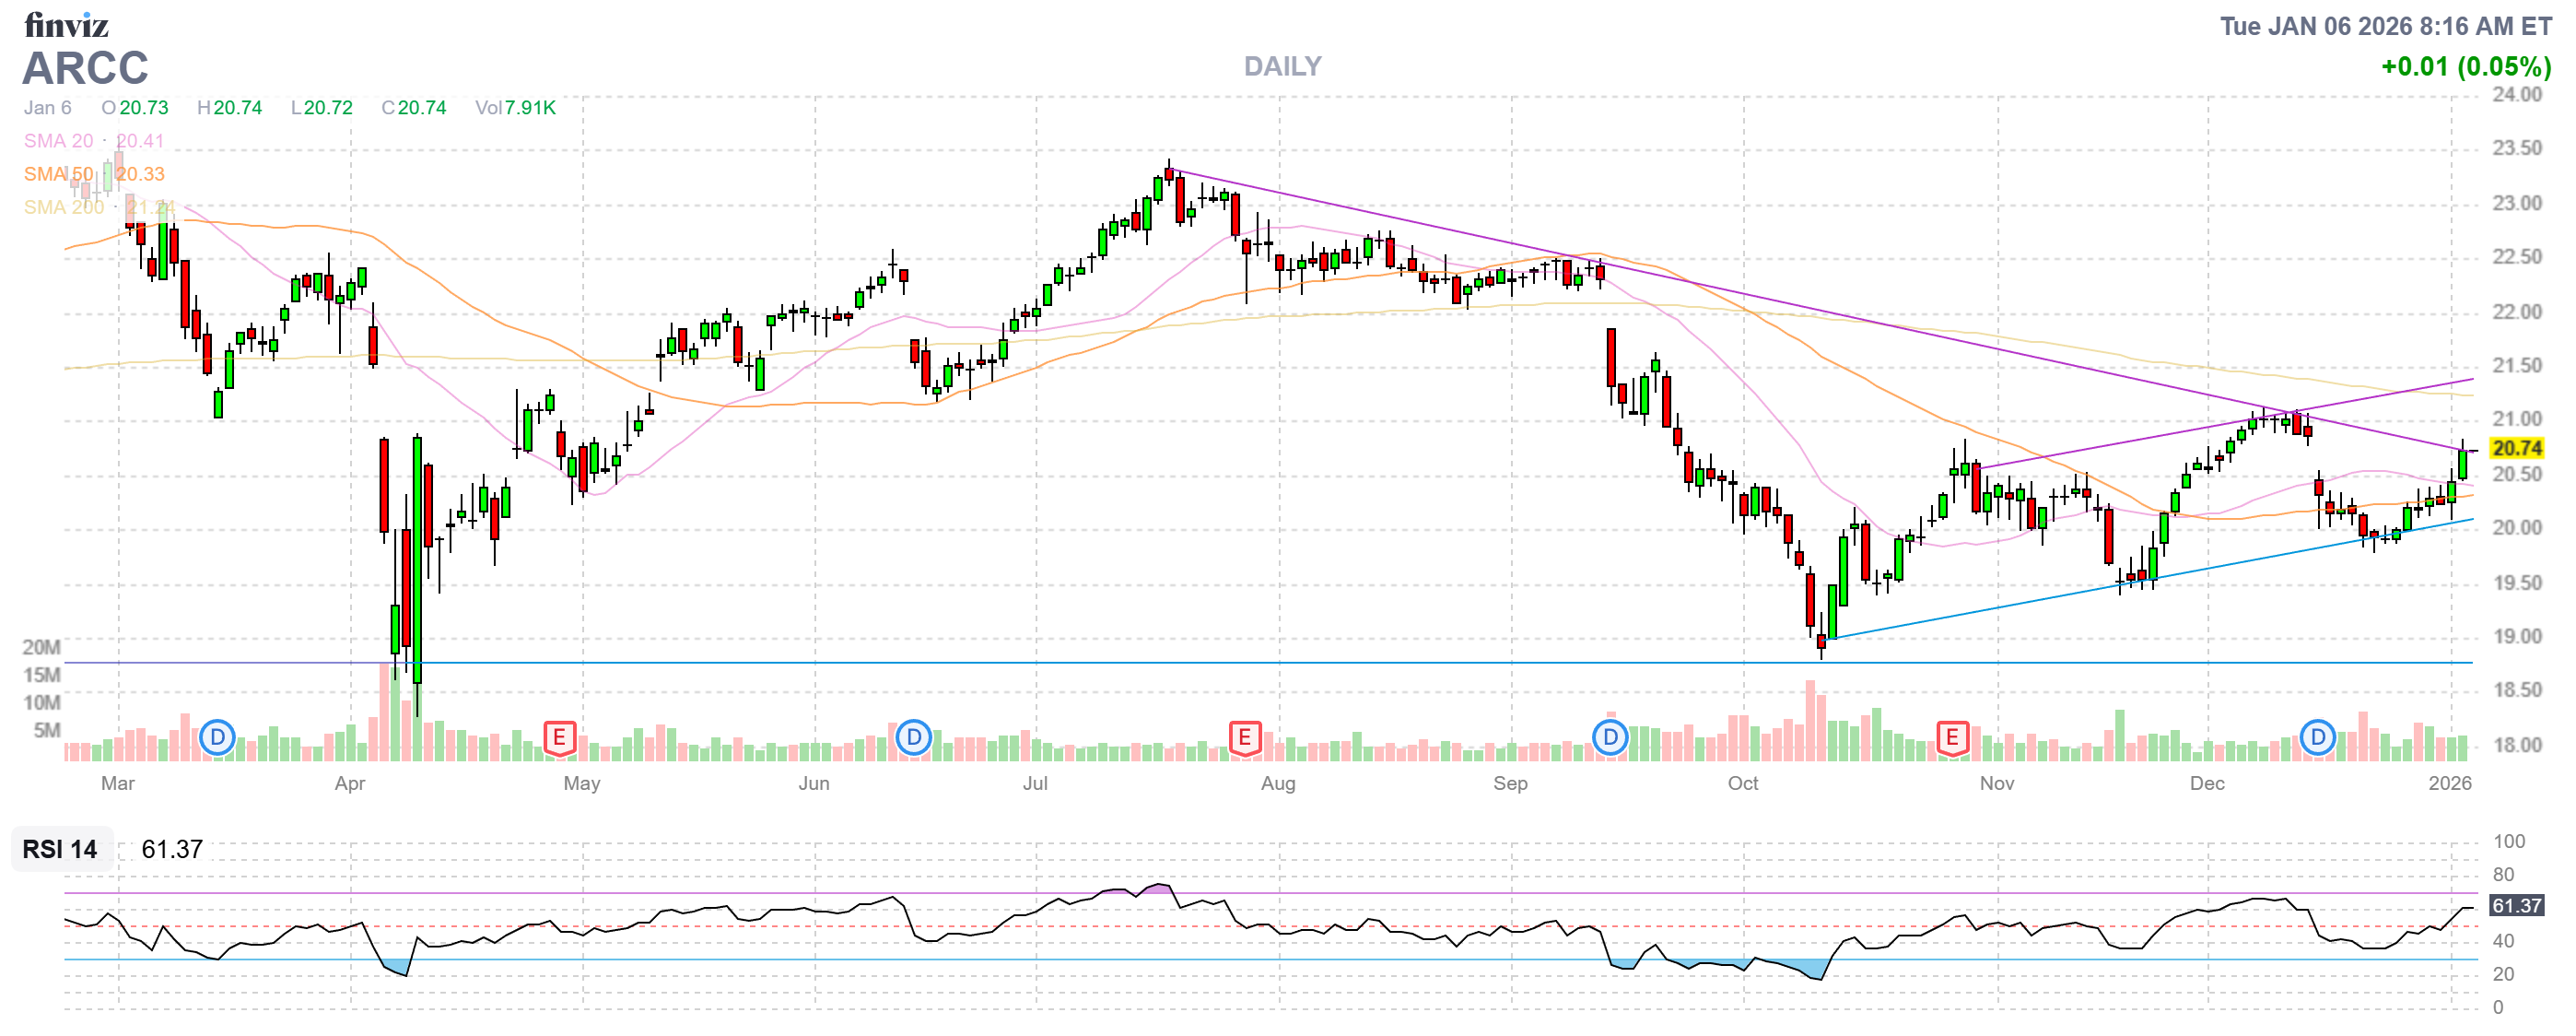
Remember: The only reason the short calls can be burning us ($200 loss at the moment) is if our 2028 bull call spread is going deeper in the money. We WANT to be burned to the upside – just hopefully not too much but $200 (2.9%) out of $6,850 of upside potential is OK at the moment, right?
-
- B – Net $3,319 on the $6,400 spread that’s already in the money has $3,081 (92.8%) upside potential. We were burned and we rolled our short-term calls to more 2028 $40s so now we just wait and see, really but 92.8% is worth waiting for…
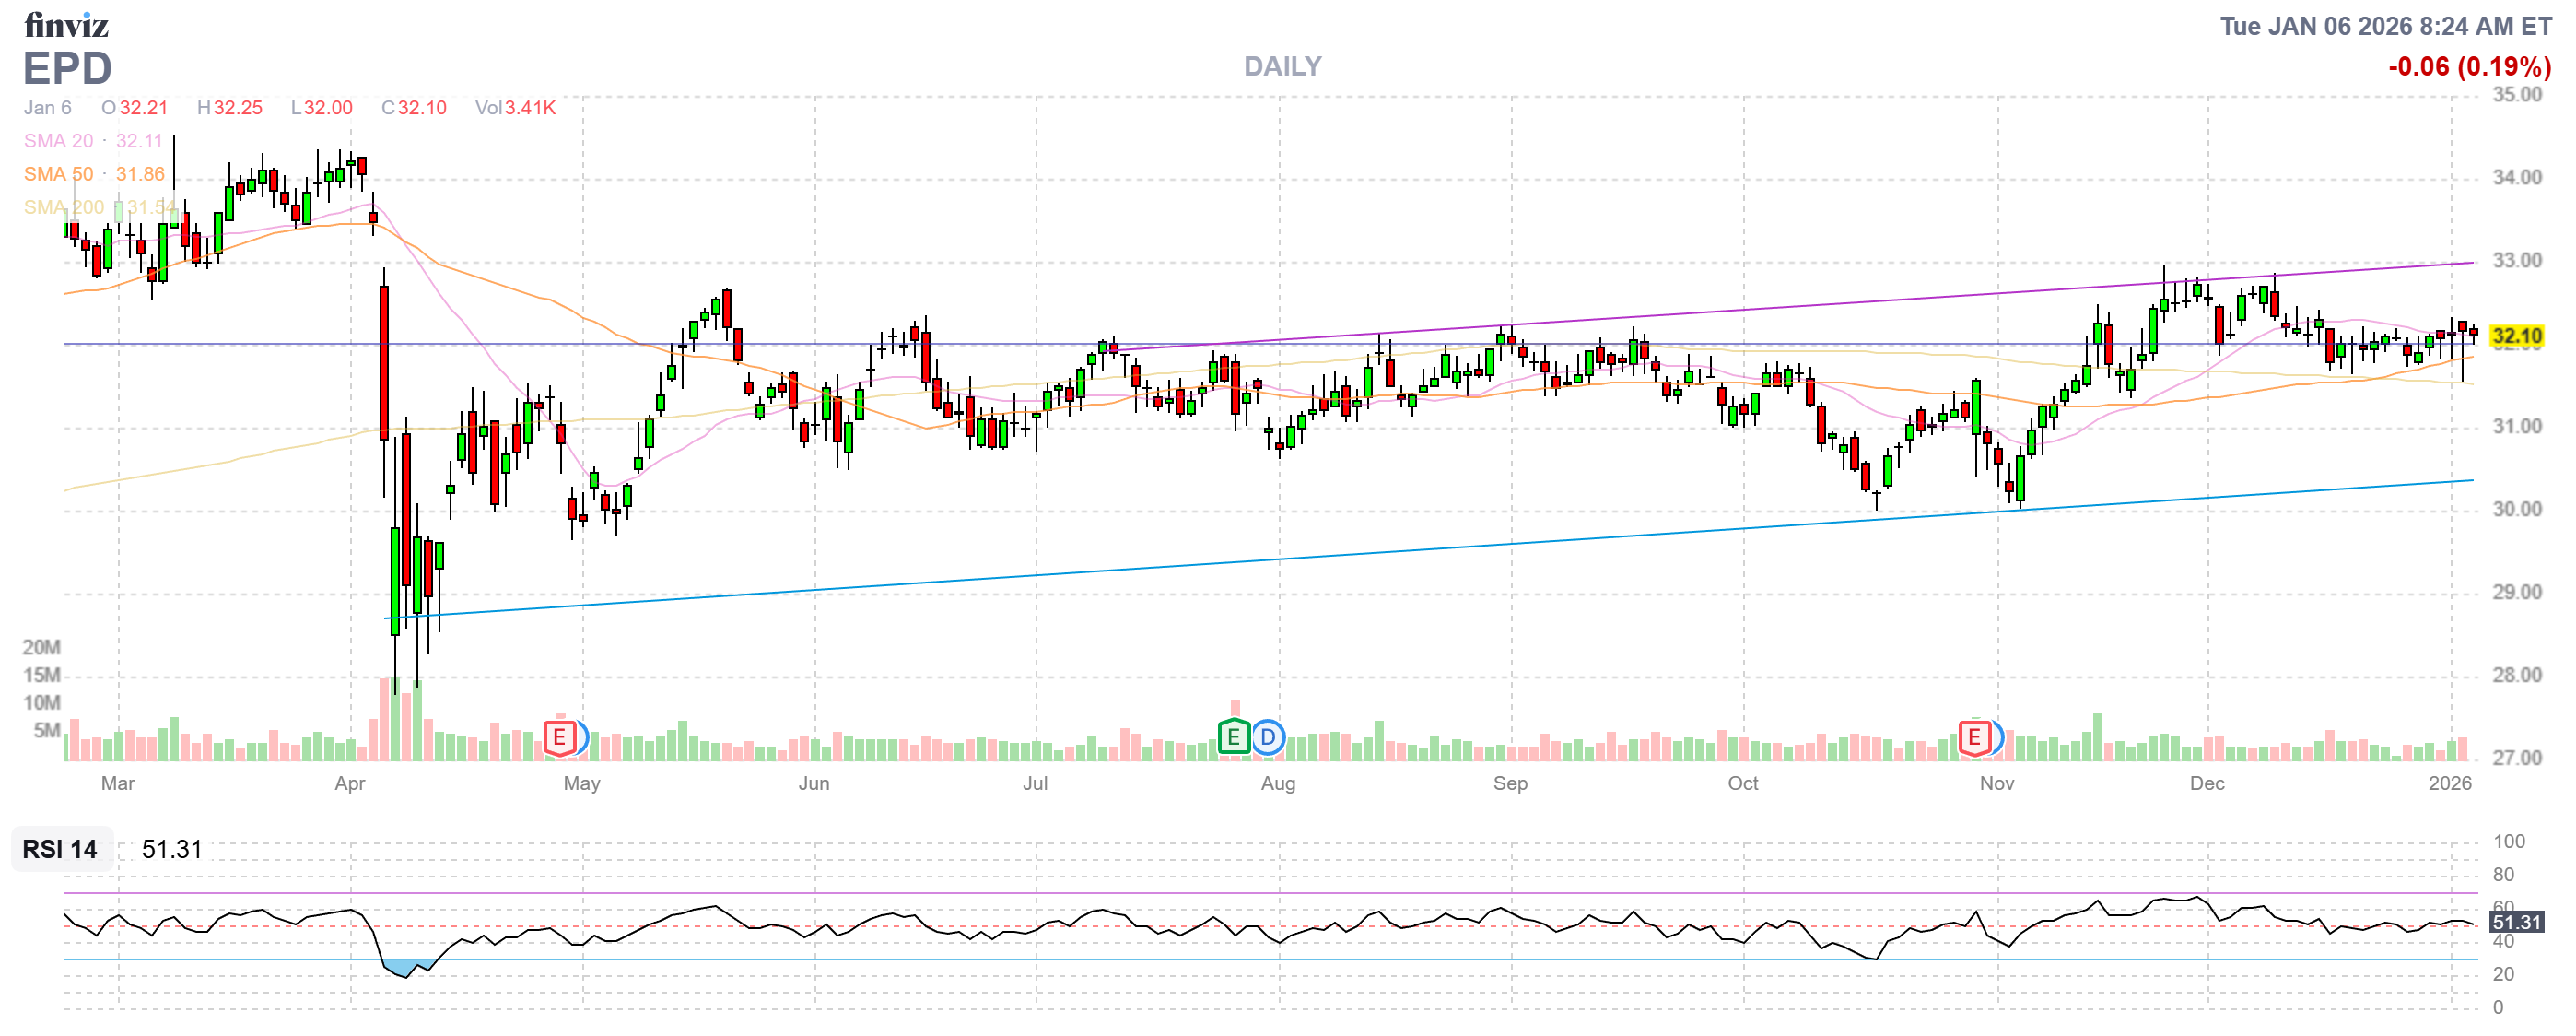
- EPD – We’re right on the cusp with the Jan $32 short calls so we should wait for the premium to burn off. It’s an $8,000 spread that’s on track at net $3,629 with a whopping $4,371 (120%) upside potential PLUS the short-term call sales along the way. Great for a new trade!
-
- F – A new one! Net $1,975 on the 1,850 spread doesn’t have much upside potential ($125) BUT the short $11.85 calls are 2027 and the 2028 $15s are $1.75 so we can roll into a $5,000 spread for $750. There’s no reason to do it now – this was a very conservative spread for the purpose of producing that income and we have 7 more quarters to sell $300 ($2,100), which is 106% of upside potential and the spread money is just a bonus.
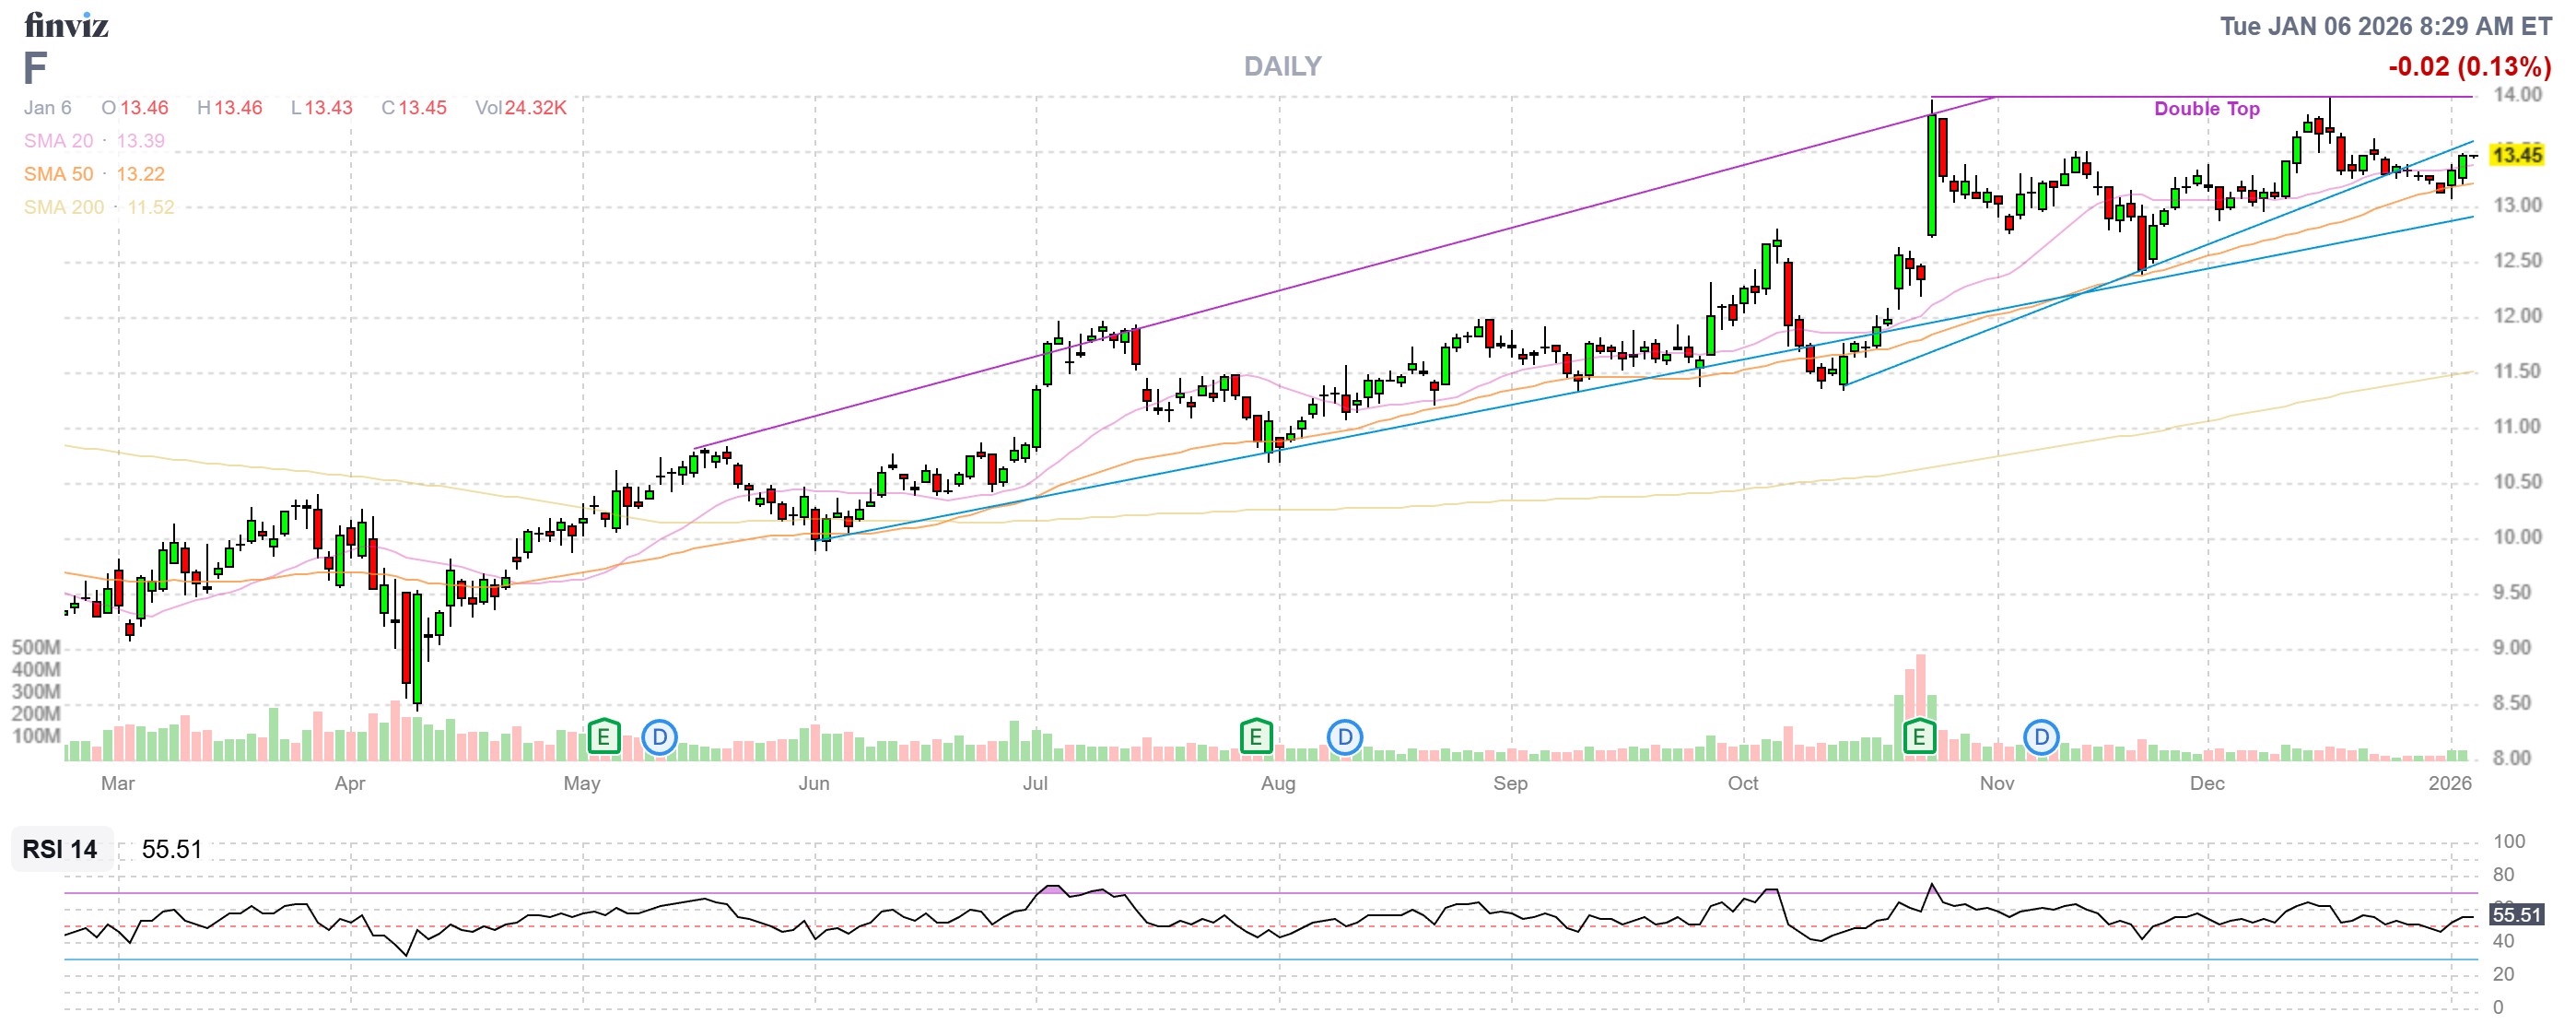
Look back over these trades. They don’t seem like much but a lot of small, safe moves like these in a small, no-margin portfolio can generate the kind of returns that will have you playing with the big boys in a decade! THAT is the lesson of the $700/Month Portfolio!
-
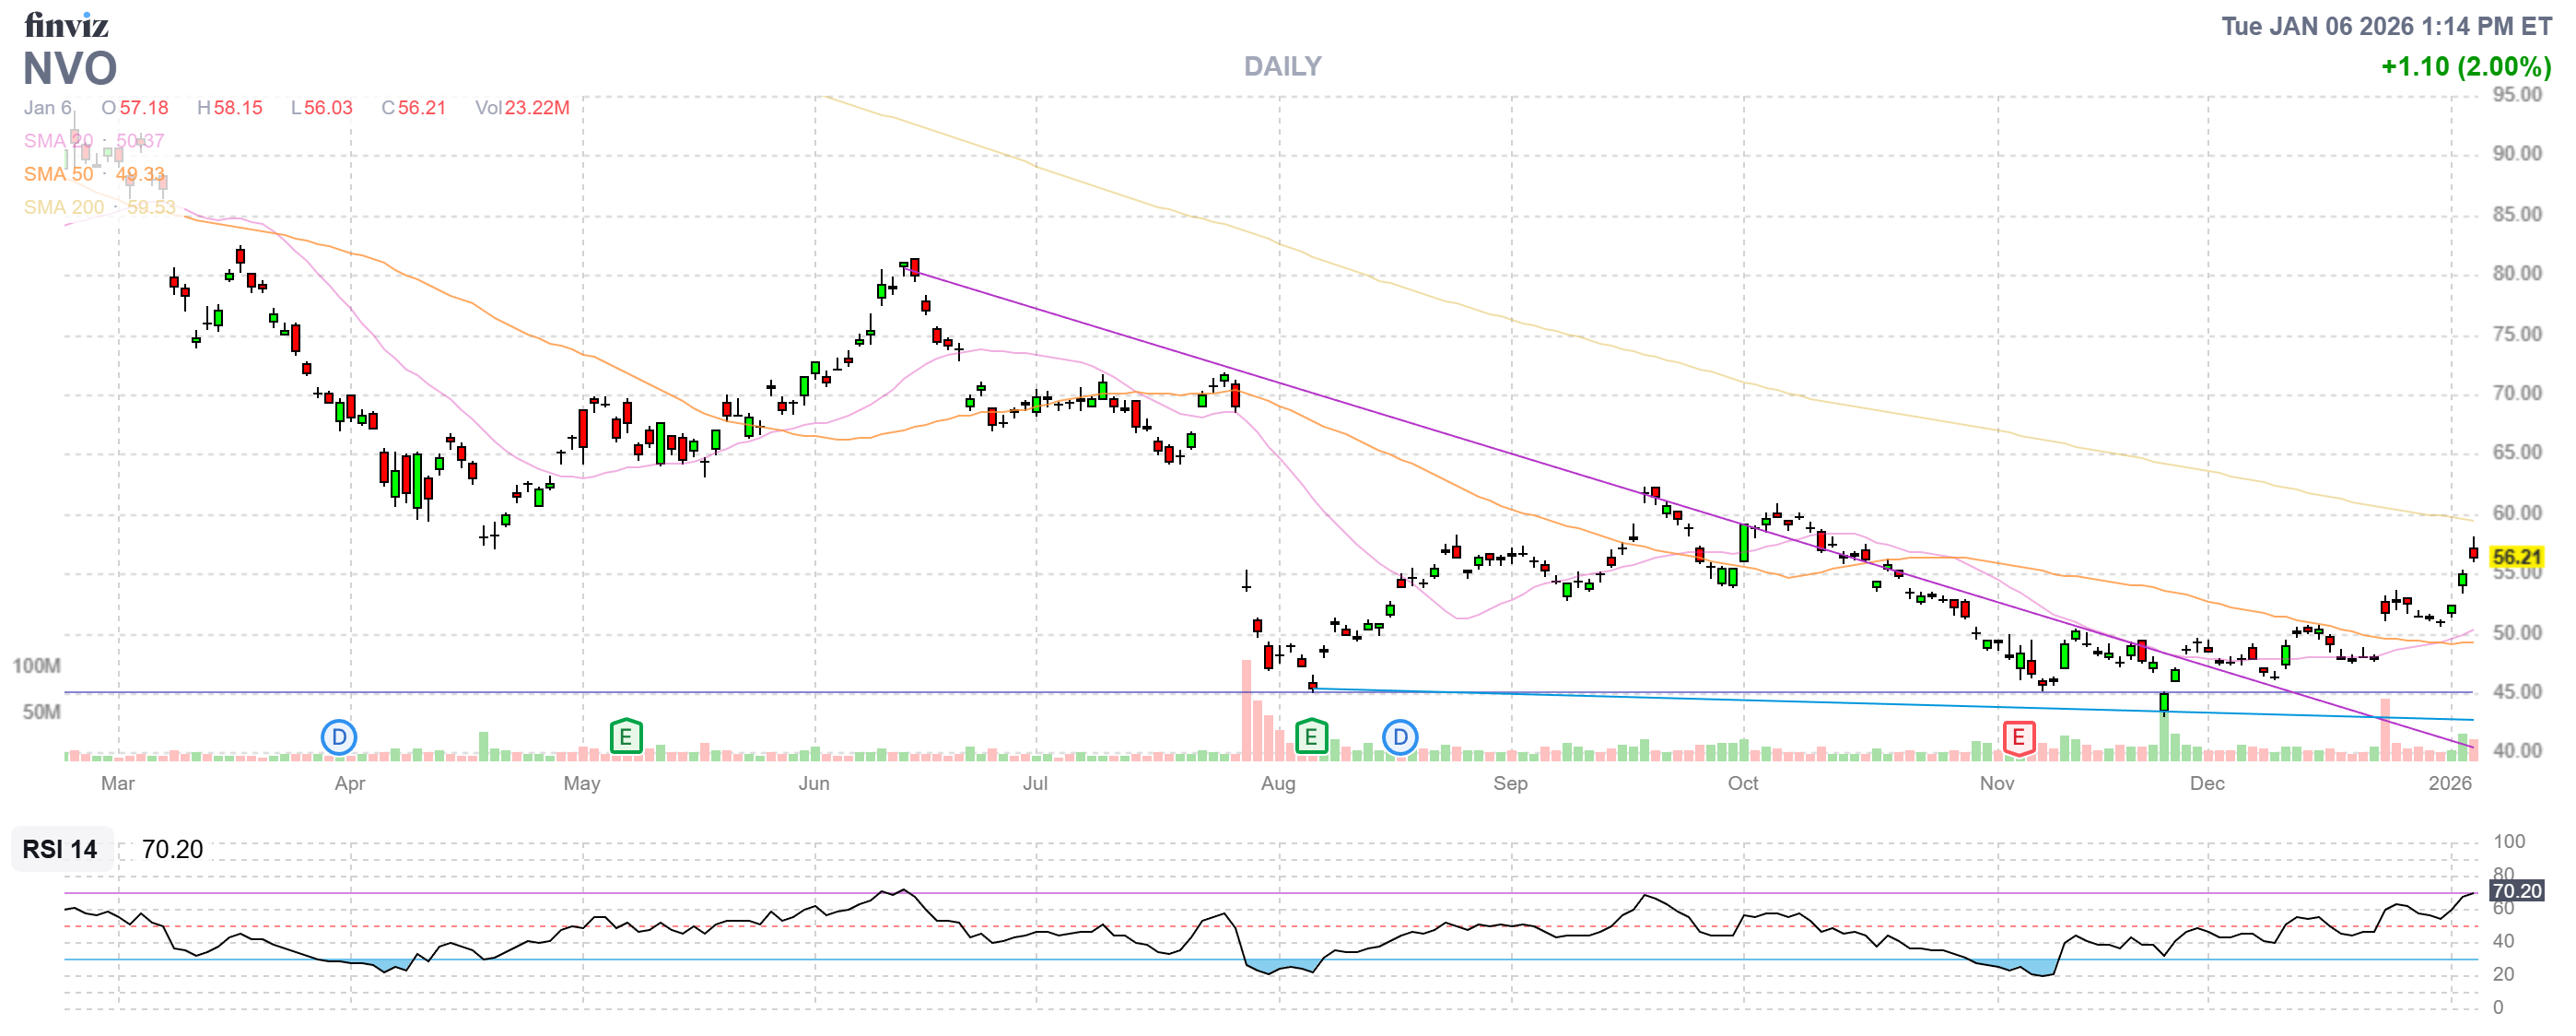
- NVO – Another new one! And another one blowing over our short-term target but that’s fine as we have a $2,500 April spread and 2 short Jan $52 calls that are down $555 at $5.08 but that plus $52 is $57.08 – about $1 higher than we actually are. As we can see, the April $60s are $3.60 so it will cost us about $1.48 ($296) to roll there and that would net us ($2,500-$296=) $2,204 from our $790 entry in 5 months (up 178%) – that’s acceptable, right?
- Still, since it’s such a good money-maker, why not spend $5.30 ($2,650) to roll our April $55s to the 2027 $55s at $11? We can add 5 more ($5,500) and sell 4 2027 $70 calls at $6 ($2,400) so we’ve spent net $5,750 to have 10 2027 $55s and 4 short 2027 $70s and, at the moment, 5 short what will be April $60s. When those expire, the June $60s are $5.10 so we could pull back another $2,550 or more from just one sale with two more periods to go. That’s a good plan! At the moment, it’s now a $15,000 spread that we have now spent ($790+$5,750=) $6,540 on so now we have $8,460 (129%) upside potential PLUS $5,000 (76.4%) income potential. Nice upgrade from hoping for $2,204!
-
- PR – Could not be more perfectly on track. We’ll roll closer to expiration.
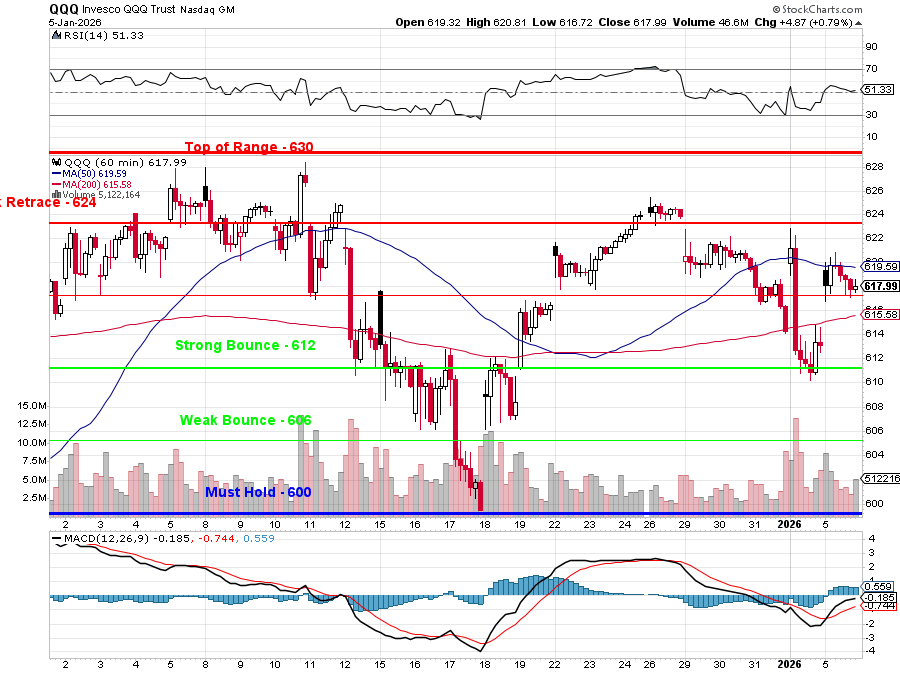
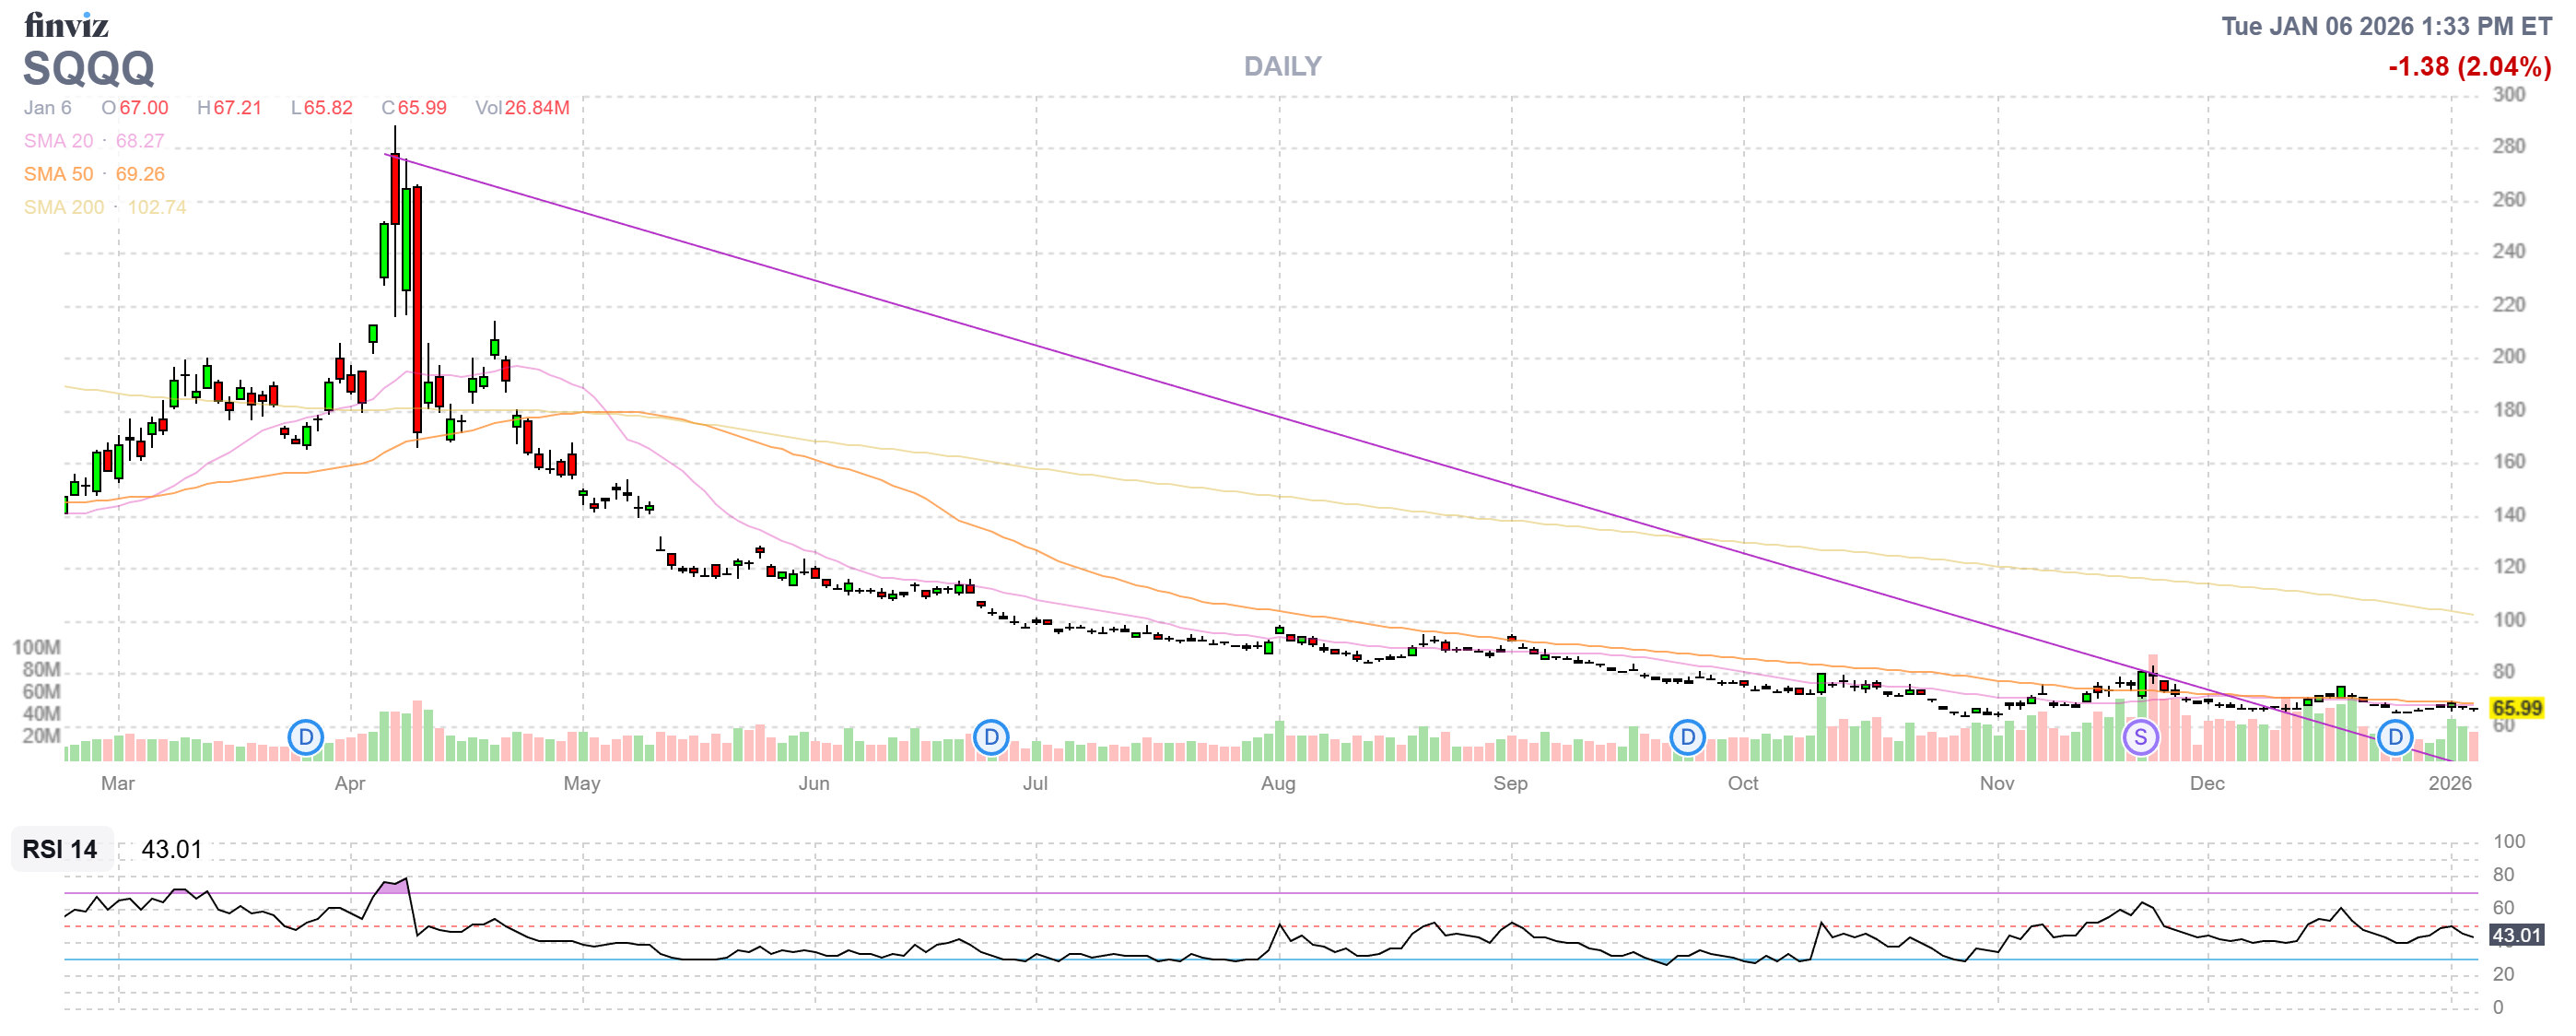
- SQQQ – Our new protection – I feel much better having it. $66.04 x 1.6 (a 20% drop on the 3x inverse ETF) is $105.66 is our realistic target and that’s $35.66 above our 7 $70 calls so $24,962 and the current net is $5,970 so we have $18,992 of downside protection plus some more short call sales while we wait.
- We don’t have any short puts and almost every long we own is completely covered (we don’t take risks like the LTP) so I think $19,000 is good coverage on $60,000 worth of positions. Hopefully we won’t have to test it!
-
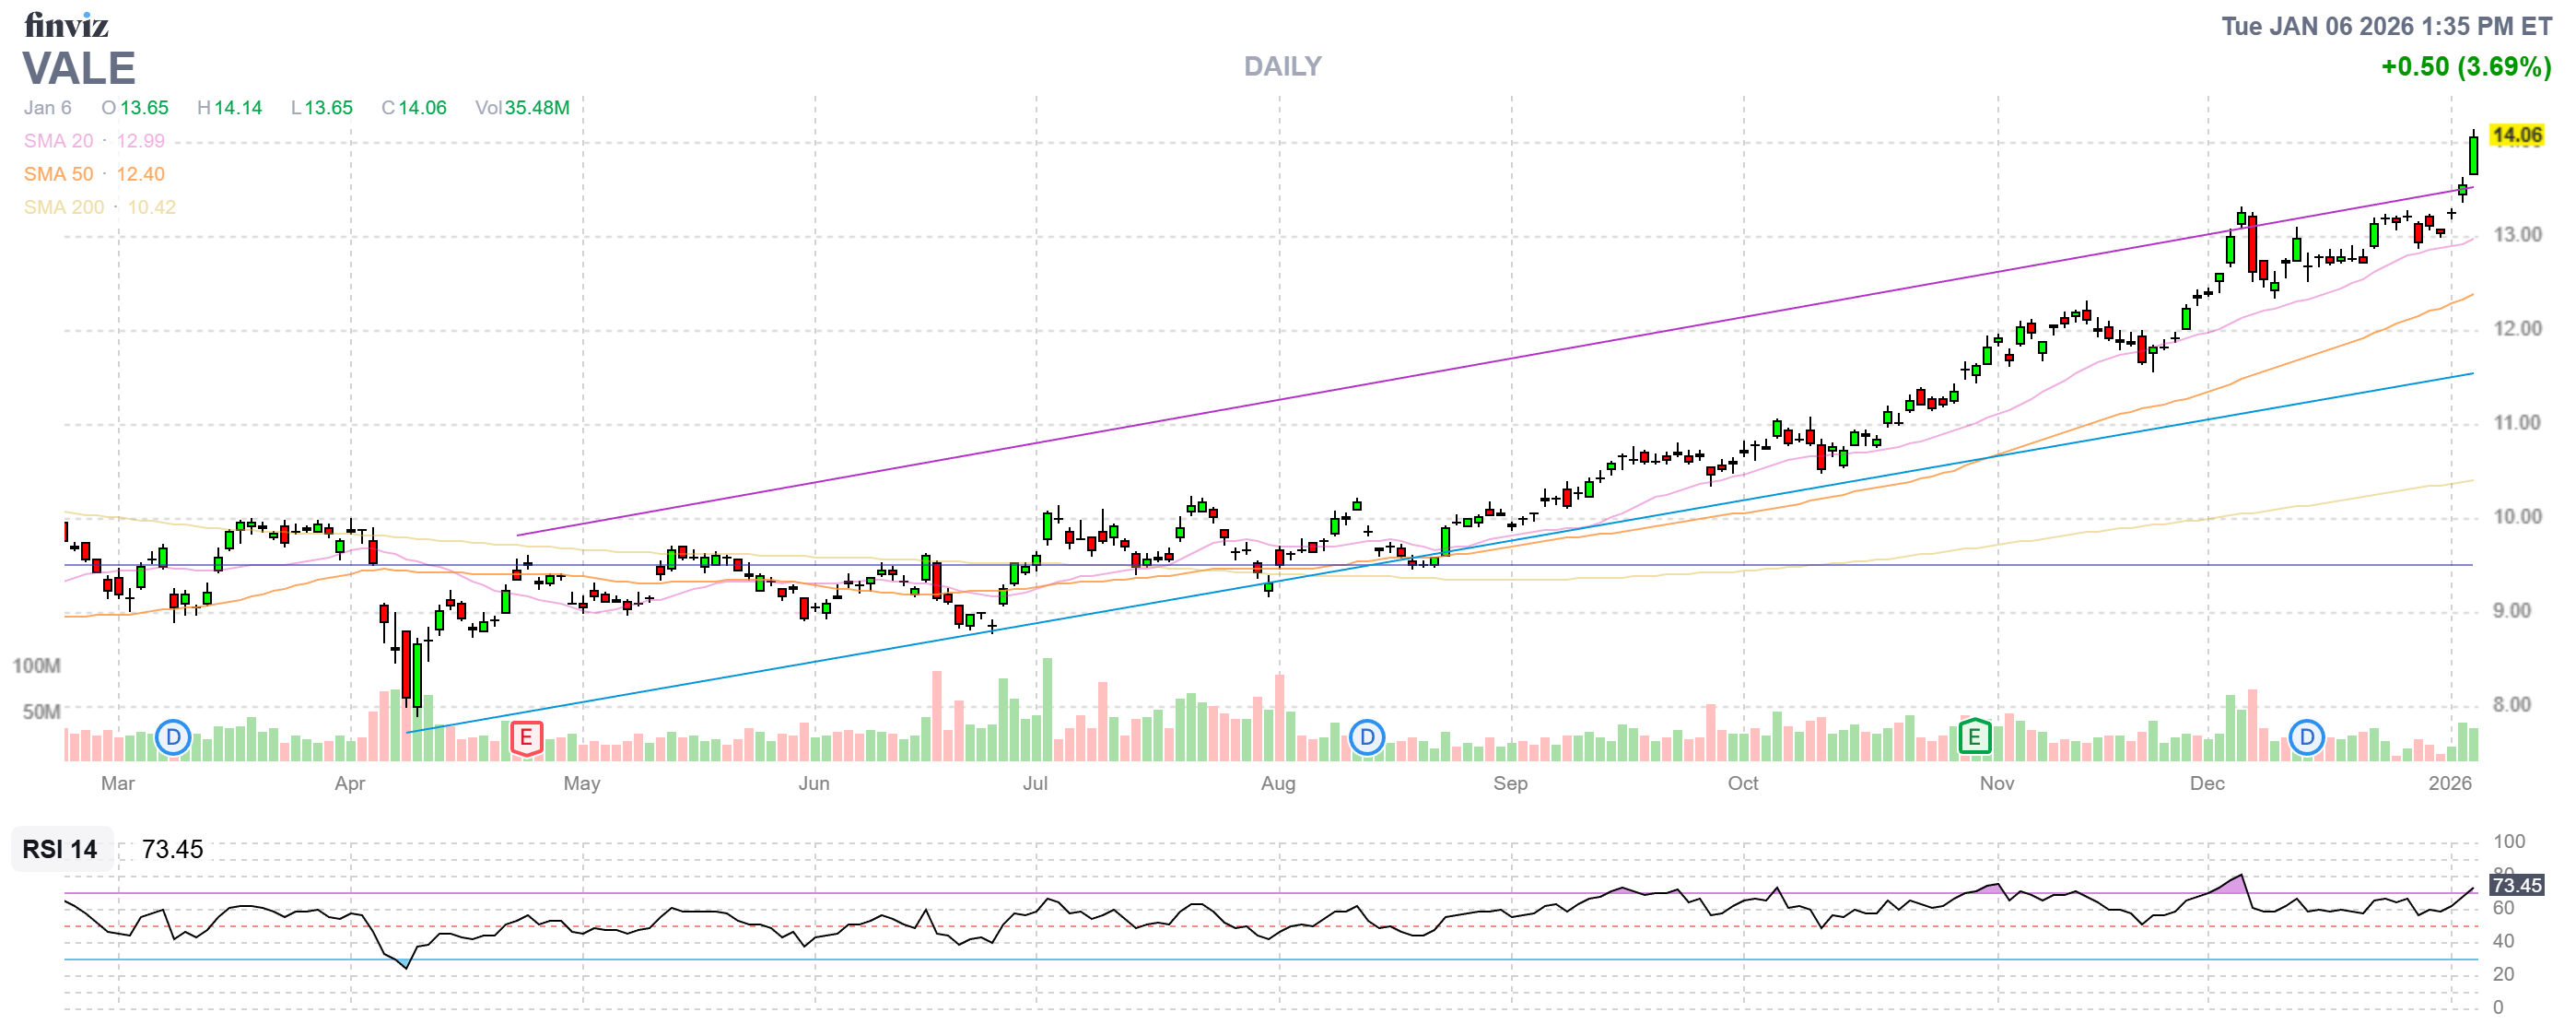
- VALE – Saved by earnings! We held on to those “dead” Jan $12 calls and now they are $2.09 ($4,180) in the money. If we had margin, we could get fancy but let’s just cash those out and the short 2027 $12 calls at $2,755 and we may as well cash out the rest for net $5,900 as the option chains aren’t that great on VALE – we’ll find something better to trade with our net net $7,315!
Overall, we took $4,617 off the table, putting us over 1/3 CASH!!! and we have $63,000 (70%) of upside potential which would be just fine for another year but, of course, we’ll still find new opportunities along the way. In fact, last month we had only $35,476 (42.8%) of upside potential – so we’ve already made huge improvements in the past 30 days.
♦️Based on the adjustments detailed in your current draft, here is the summary table for the $700/Month Portfolio as of January 6, 2026.
Portfolio Review & Adjustments Summary
| Position | Action Taken | Net Cost / (Income) | Upside Potential ($) | Upside Potential (%) | Status/Notes |
| CMCSA | Cash Out VSNT | ($2,100) | TBD | TBD | Selling 40 VSNT shares; Jan calls at 0.50. |
| ET | None | $0 | $1,545 | 62.9% | $16.42 price; 12 months to go. Good for new trade. |
| HELE | None | $0 | $4,350 | 138% | Near 2027 goal. Great for new trade. |
| PATH | None | $0 | $2,375 | 88.7% | Target is $15; currently over goal. Great for new trade. |
| SAIL | Buy Back Calls | $388 | TBD | TBD | Buying back 5 short $22.50 calls to allow for bounce. |
| ULCC | None | $0 | $325 | 14.9% | Waiting for Feb earnings; 4 months left. |
| UUUU | None | $0 | $2,900 | 40.8% | Double target; holding as a “safe” play. |
| HRB | None | $0 | $1,275 | 34% | Off track but keeping for May/Nov call sales. |
| VFC | None | $0 | $638 | 18.9% | Over goal; keeping until May. |
| ARCC | None | $0 | $6,850 | 720% | Income spread; essentially a free trade. Great for new trade. |
| B | None | $0 | $3,081 | 92.8% | Rolled to 2028 $40s; waiting for premium burn. |
| EPD | None | $0 | $4,371 | 120% | On track at Jan $32. Great for new trade. |
| F | None | $0 | $2,225 | 112% | Income spread; 7 quarters of call sales left. |
| NVO | Roll & Add | $5,750 | $8,460 | 129% | Rolled to 10 2027 $55s; added 4 short 2027 $70s. |
| PR | None | $0 | TBD | TBD | Perfectly on track. |
| SQQQ | Holding Hedge | $0 | $18,992 | 318% | 20% Nasdaq drop target; provides $19k protection. |
| VALE | Cash Out | ($8,655) | N/A | N/A | Cashing out for net $8,655 total liquidity. |
| TOTALS | Net Change | $4,617 | ~$63,000+ | — | Est. Cash on Hand: ~$33,347 |
Updated Key Observations
-
-
Liquidity Injection: Cashing out VALE and VSNT has significantly bolstered your cash position to over $33,000.
-
Established Protection: The SQQQ hedge (established last month) remains in place, providing roughly $19,000 of downside protection for the portfolio.
-
High-Conviction Entries: For new members, HELE, PATH, ARCC, and EPD continue to be the primary recommendations today.
-
Strategy Notes:
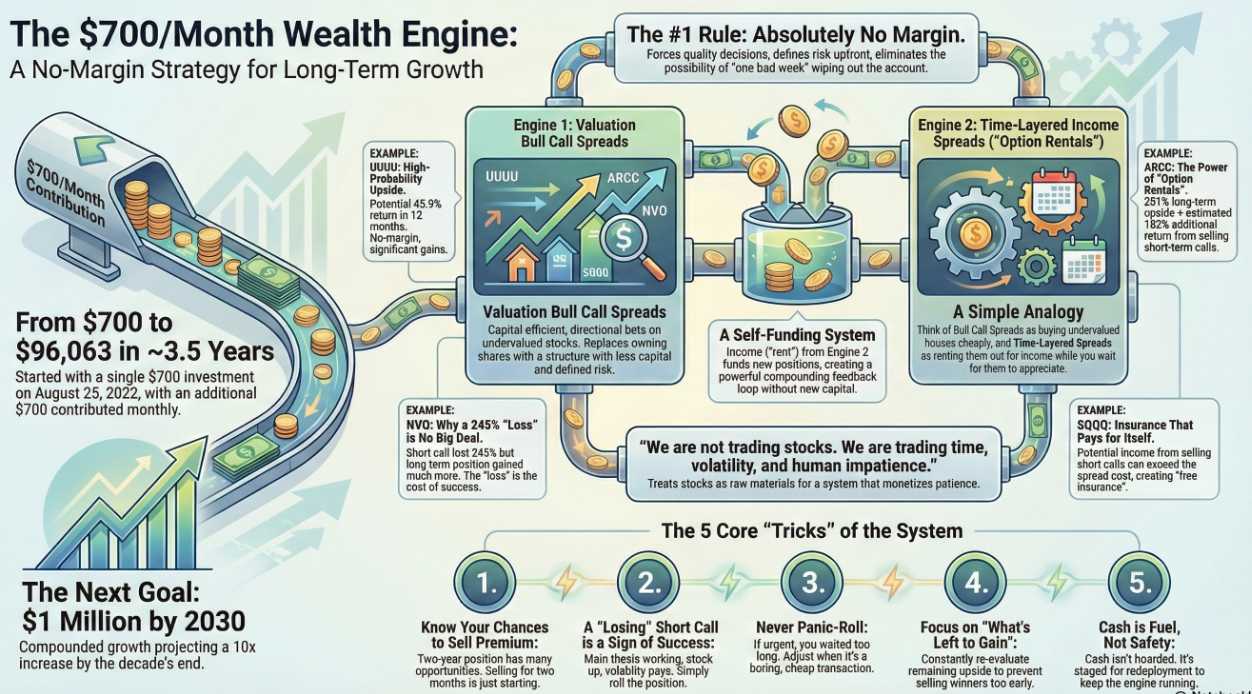
The portfolio manages investment risk by utilizing two primary “engines”: Valuation Bull Call Spreads (vertical spreads) and Time-Layered Income Spreads (calendar-style “option rentals”). These strategies are designed to turn time and volatility into compounding leverage while strictly avoiding the risks associated with margin.
1. Valuation Bull Call Vertical Spreads
The portfolio uses bull call spreads when a stock is identified as undervalued. This vertical structure manages risk through several mechanisms:
- Defined Risk: Unlike owning stock directly, the downside is strictly capped at the initial entry cost.
- Capital Efficiency: These spreads require significantly less capital than buying 100 shares of stock, providing “better geometry” for the same bullish thesis.
- Subsidized Basis: By selling a short call against the long call, the portfolio immediately reduces the net cost (basis) of the position, which provides a larger cushion against a drop in the stock price compared to an IRA with just stock.
2. Time-Layered Income Spreads (Calendar-Style Spreads)
Also referred to as “Option Rentals,” these structures manage risk by decoupling short-term price movement from long-term value.
- Time Arbitrage: The portfolio buys long-dated calls (LEAPS) as “inventory” and repeatedly sells short-dated calls (30–120 days) as “rent checks”. This allows the portfolio to harvest time decay (theta) regardless of whether the market is flat or slightly down.
- Intentional Asymmetry: Risk is managed by viewing short-term losses on short calls as “no big deal”. If a short call loses 200%, it typically means the long call (the “building”) has gained significantly more in intrinsic value, resulting in an overall net gain for the position.
- Feedback Loops: Income generated from these rentals is used as “fuel” to refill cash and stage for redeployment into better positions, rather than just being hoarded for safety.
3. Core Risk Management Tactics
Beyond the specific spread structures, the portfolio employs several “tricks” to mitigate risk:
- No Margin Usage: The portfolio is constrained to use no margin, which eliminates the risk of margin calls, forced liquidations, or “one bad week” blowing up the account.
- Strategic Rolling: When a short call is challenged by a rising stock price, the portfolio “rolls” the position forward to a later date or a higher strike price. This converts volatility into cash and extends the “lifespan” of the trade.
- Downside Hedges: The portfolio utilizes inverse ETFs like SQQQ to provide downside protection. For example, a drop in the Nasdaq can drive the SQQQ long calls into the money, providing thousands of dollars in protection while the short calls against them generate “free insurance” through premium sales.
- Patience over Speculation: By focusing on “what is left to gain” rather than daily P/L fluctuations, the portfolio avoids selling winners too early and focuses on monetizing patience.
The overall portfolio return rate of 234.7% is driven by a combination of high-performing individual securities and two distinct “engines” of option strategies that prioritize time arbitrage over market timing.
1. High-Performing Securities (The Growth Drivers)
Several specific positions have achieved massive gains on their long-dated call options, providing the bulk of the portfolio’s appreciation:
- Energy Fuels (UUUU): This is a primary driver, with the long call position showing a 645.1% gain. Even with the short call being underwater, the spread remains “miles in the money” with significant remaining upside.
- SoFi Technologies (SOFI): The long call has realized a 321.5% gain, contributing over $13,000 in market value.
- Barnes Group (B): This position moved up so aggressively that short calls had to be rolled to 2028, yet it still maintains a 96% upside potential if the stock holds above $40.
- UiPath (PATH): Shows a 49.5% gain on the long calls, with the portfolio manager noting it still possesses nearly 100% upside potential for new trades.
2. Primary Option Strategies (The “Engines”)
The portfolio does not just “own” these stocks; it utilizes specific structures to monetize them:
Engine 1: Valuation Bull Call Spreads These are thesis-driven spreads used when a stock is identified as undervalued.
- Mechanism: By purchasing long-dated LEAPS and selling short calls to subsidize the cost, the portfolio creates “better geometry” than owning the stock outright.
- Risk Management: This strategy provides defined risk where the downside is capped at the initial entry cost while maintaining large predefined upside.
Engine 2: Time-Layered Income Spreads (“Option Rentals”) This strategy, used for stocks like VFC, ARCC, and EPD, focuses on persistent cash flow rather than short-term price movement.
- Mechanism: The portfolio treats long-dated calls as “inventory” and repeatedly sells short-dated calls (30–120 days) as “rent checks”.
- Feedback Loops: Income generated from these rentals is recycled to fund new positions, creating a self-funding “time arbitrage machine”.
- Asymmetry: If a short call loses value (e.g., NVO short calls losing 245%), it is considered “no big deal” because the underlying long call has typically appreciated significantly more in value.
3. Systemic Factors Driving Returns
- Capital Recycling: Instead of letting capital sit idle, the portfolio constantly sells premium and rolls positions forward to convert volatility into cash.
- No Margin Usage: By strictly avoiding margin, the portfolio eliminates the risk of forced liquidations or margin calls during “one bad week,” allowing it to wait for long-term theses to play out.
- Downside Hedging: SQQQ (a 3x Inverse ETF) is used as a “free insurance” hedge. The short calls sold against the SQQQ long positions generate income that covers the cost of the protection, ensuring the portfolio is protected if the Nasdaq drops significantly.
We’re just over $900,000 away from our Million Dollar Goal!
Don’t keep watching us do it from the sidelines – Join PhilStockWorld today and benefit from our experience.
The $700 Monthly Road to One Million
Podcast/Video: https://share.transistor.fm/s/48e9d8b0


 – Oil Hits $115 (again)")

