
 “Like a million miles away from me
You couldn’t see how I adored you
So close, so close
And yet so far” – Frankie Valli
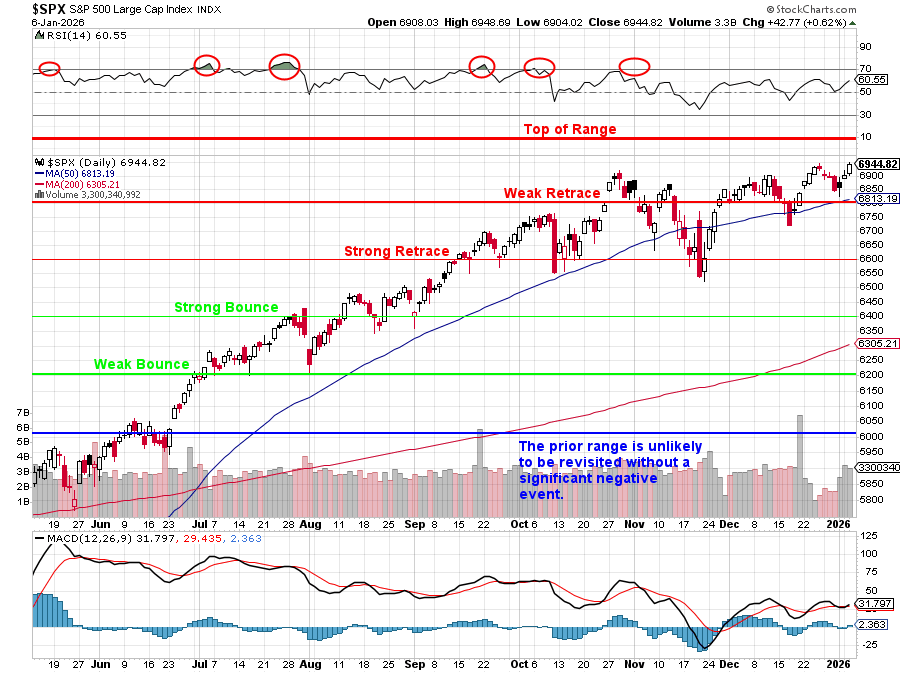
What a start to the year!
2025 closed with the S&P 500 at 6,845 and, in the first 3 sessions of 2026, we’ve jumped 99 points (1.4%) to 6,944 as of yesterday’s close and you would THINK 7,000 will cause traders to step back and reflect on the situation – especially as we long ago predicted it would be the top of the range – but overshoots are common things and we haven’t exhausted the RSI (60.55) just yet.
HOWEVER, we may be exhausting common sense as the S&P 500 stocks earned just about $270 per share over the last four quarters, and, with the S&P 500 index at 6,944, that’s indicating roughly 25 times trailing earnings and forward earnings only indicate about $270-305 for full‑year 2026, which still leaves you paying 23 times “hoped‑for” profits in an environment where long‑term averages are closer to 16–18.
And that’s including the Magnificent 7. Strip out the Big Tech darlings and you’re left with the S&P 493, where earnings growth is only running mid‑single digits and forward P/Es are still hovering around 20x – rich by any historical standard for companies growing 5–9% a year. Analysts expect the Mag 7 to contribute close to half of the index’s earnings growth again in 2025, while the other 493 names grind along at about 8% EPS growth while still trading at sky-high premium multiples.
The real distortion is in the 7 names everyone actually owns. They’ve grown so fast they now make up about 35% of the entire S&P 500’s market cap. On a blended basis, they “only” contribute roughly one‑quarter to one‑third of total index earnings, which means you are paying very non‑index‑like prices for their slice of the pie.
Magnificent 7 Valuation Snapshot
| Stock | Approx. Fwd P/E 2026 | Notes |
|---|---|---|
| Apple (AAPL) | ~27–28x | Slow top‑line growth, still priced as a bond‑plus‑AI‑option. |
| Microsoft (MSFT) | ~30x | Cloud + Copilot leader; premium multiple for relatively predictable growth. |
| Alphabet (GOOGL) | ~23–24x | Ads and cloud; “cheapest” of the group on P/E despite strong AI positioning. |
| Amazon (AMZN) | ~35–40x | AWS + retail margin story; market paying far out for operating leverage. |
| Meta (META) | ~22–23x | High margins, buybacks; valuation now assumes steady ad + AI monetization. |
| NVIDIA (NVDA) | ~25–30x | AI picks‑and‑shovels king; numbers keep rising, but so does cyclicality risk. |
| Tesla (TSLA) | ~220-260x | Auto margins compressing; multiple still assumes FSD/robotaxi magic. |
So, when we talk about the S&P at 7,000, we’re really talking about a market that’s paying 30x for the AI royalty stream and 20x for everything else – which is fine, as long as those royalty streams never disappoint and the ‘everything else’ never has a recession.
That means there’s a LOT riding on the data going forward and this month, as we head into earnings, the data that will matter most is:
January data that can pop the bubble
| Data point | Why it matters at 30x/20x multiples |
|---|---|
| Jobs report & unemployment | Any uptick in joblessness or weak payrolls pressures the “soft landing” story. |
| CPI / PCE inflation | Sticky services or a re‑acceleration keeps the Fed “higher for longer,” bad for stretched P/Es. |
| Retail sales & consumer credit | Tests whether the bottom 90% can keep spending with rising delinquencies and drained savings. |
| ISM / PMI (manufacturing & services) | Shows if the “rolling recession” is contained or spilling into broader activity and earnings. |
| Yield curve & credit spreads | Steeper curve and wider spreads would flag tightening financial conditions under the surface. |
Key data the Mag 7 (and 7,000) are priced for
| Data point | Why it matters now |
|---|---|
| S&P 500 earnings (Q4 + guidance) | Confirms or kills the $290–300 forward EPS fantasy that justifies 22–24x forward P/E. |
| Revenue growth ex‑Mag 7 | Shows whether the “S&P 493” can actually grow, or if all the oxygen is still in seven names. |
| Margins (especially in tech) | Determines if AI demand is falling to the bottom line or being eaten by capex and wages. |
| Capex & AI spend | Tells you if Rubin/AI build‑outs are accelerating or slowing, which hits NVDA + memory directly. |
| Credit conditions & delinquencies | A real‑time check on the consumer and small‑biz balance sheet under 5%+ money. |
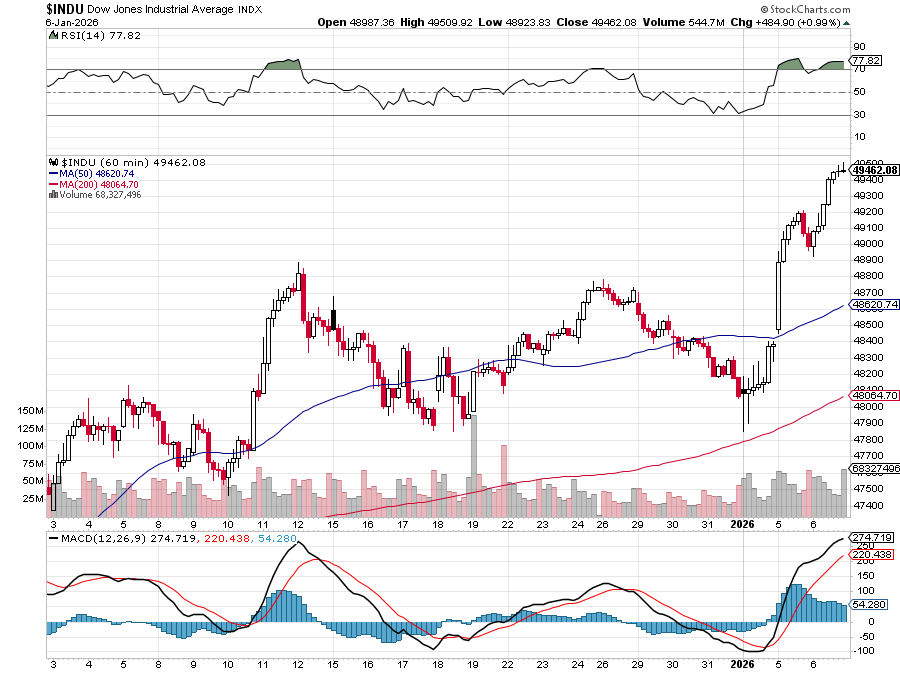
The 30 Dow components are roughly in the same ballpark as the S&P 500, running around 23x forward earnings and that, of course, assumes 10% growth in 2026 WHILE spending $500Bn in AI Infrastructure. It will be interesting to see how they are going to pull this off when the TOTAL earnings of the Dow 30 last year were “just” in the ballpark of $475Bn – which means we’re effectively asking this small club of mega‑caps to grow profits by double‑digits, fund a once‑in‑a‑generation capex boom, and somehow maintain record‑high margins — all at the same time.
Welcome to 2026 – we’ve got fun and games…


")

")