
Top of range!
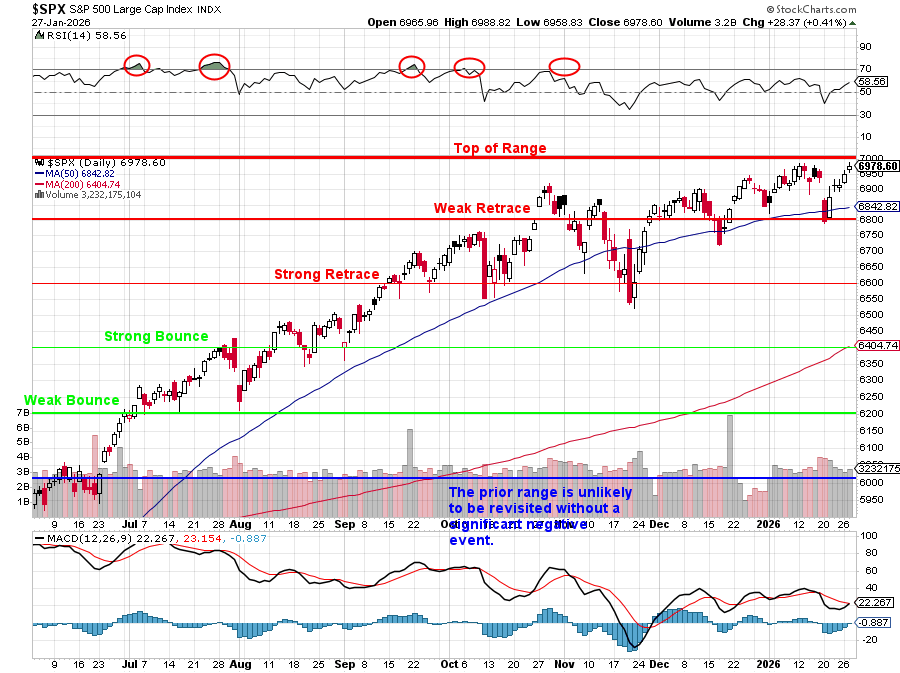
But is it? On paper, 7,000 looks like the place we “should” stall – it’s the next neat 5% Rule™ increment. We tagged our 6,800 line back in October and we’re right where last year’s range forecast said we’d be topping out – last year! That would make a nice, clean story if the world had stood still. But it didn’t.
Over the past year, three big things have shifted in ways that COULD support a higher range for the S&P – things we’ve discussed in the second half of 2025 (see our Top Trade Review for the 2nd half of 2025):
-
- Inflation and money supply: Even if you don’t believe the official 2‑3% story, you can see it in prices and in the Fed’s own balance sheet and how much HMO companies are FREAKING OUT about not getting a 4-5% Medicare adjustment. THAT is the real number! Every percent of cumulative Inflation and every extra Trillion of liquidity mechanically lifts the Dollar price of assets.
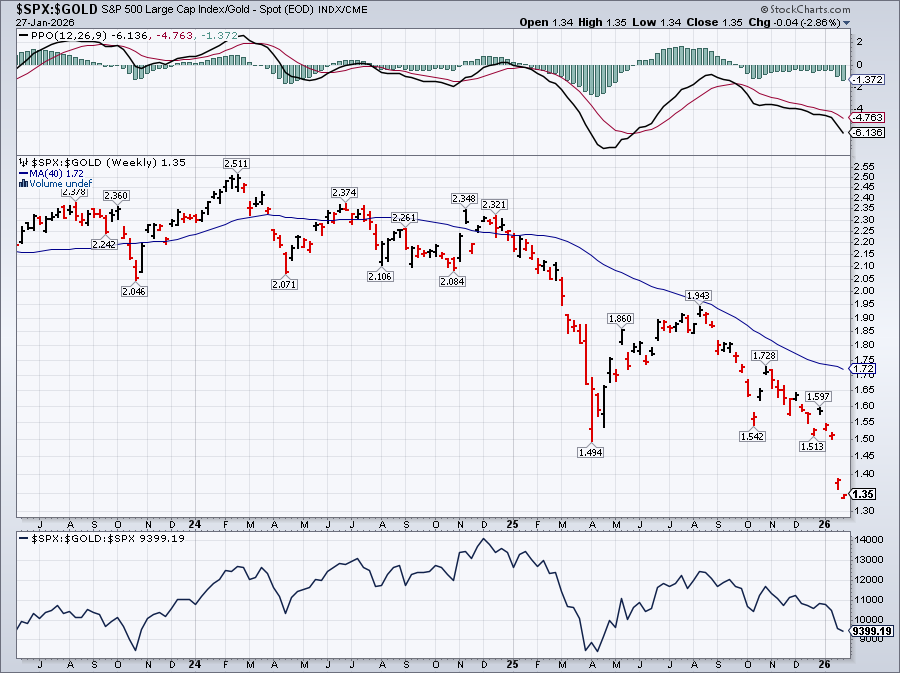
- You don’t need real growth to justify a higher index print – you just need the measuring stick to shrink. A 6,000 S&P in “strong Dollars” and a 7,000 S&P in “weak Dollars” can be the same economy dressed up in cheaper currency. Do you want to know how the market is REALLY doing (you don’t!) – Here’s the S&P 500 priced in Gold:
-
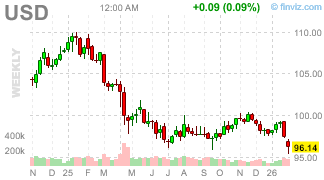
 Dollar devaluation and “nowhere else to go”: Between persistent deficits, shutdown theater, tariff roulette and the Japan bond scare, there are fewer truly “safe” places to park large pools of capital. When the Dollar, Treasuries and foreign sovereigns all start to look a bit wobbly at the same time, global money does the rational thing – it hides in big, deep, dollar‑denominated equity indices. NOT because they’re cheap, but because they’re liquid and the game is familiar. If you’re a sovereign fund or a big allocator, S&P at 7,000 can feel safer than 10‑year JGBs at 2.3% with Washington threatening 100% tariffs on your trading partners.
- FOMO and index mechanics: The more the market is dominated by passive and pseudo‑passive flows, the more it behaves like a momentum machine. Money doesn’t ask “is this cheap?” – it asks “what’s the benchmark?” and buys whatever the benchmark already owns. That pushes more capital into the top of the S&P, which pushes prices higher, which keeps performance rankings intact – and the loop continues. Add in options‑driven gamma chasing and retail FOMO headlines about “S&P 7,000!” and you get a feedback system that can grind higher long after traditional valuation lines are crossed.
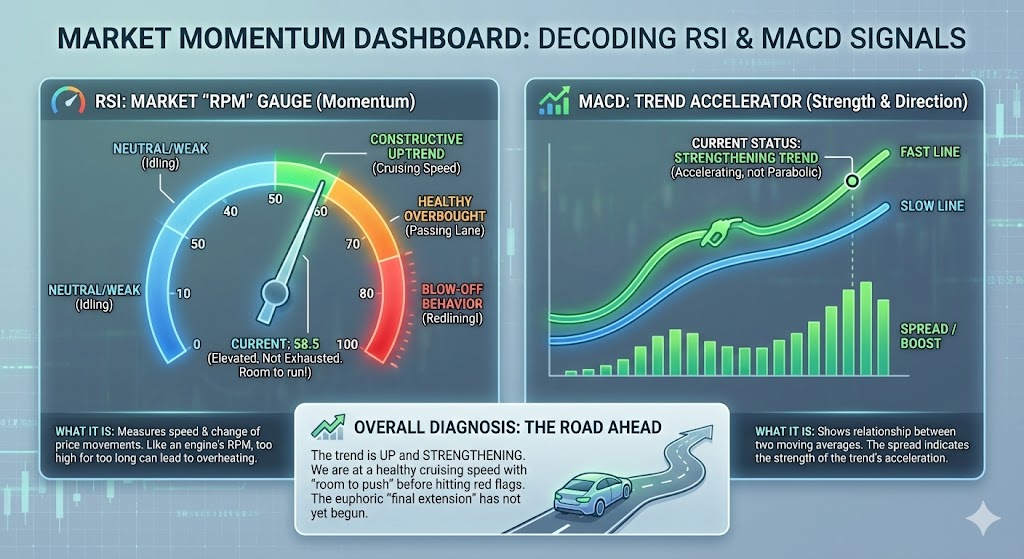
Against that backdrop, the question isn’t “why are we here?” but “what will it take to stop this?” That’s where RSI 58.56 and MACD 22.267 on the above chart come in….
-
- RSI 58.5 on a big index is elevated but not exhausted. Below 50 is neutral/weak, 50–60 is constructive uptrend, 60–70 is the “healthy overbought” band where you can run for a while and above 70 is where you usually start to see real blow‑off behavior. Sitting in the high 50s means there’s still room to push into that 60–70 zone before the market trips classic momentum red flags.
- MACD at 22(ish) tells the same story: the fast line is above the slow line, the histogram is positive but the spread is not yet at the kind of extreme that usually precedes a sharp mean‑reversion. In plain English: the trend is up and strengthening – not yet parabolic. MACD peaks tend to come after a final extension – that last euphoric leg – not at the beginning of it.
Put those pieces together and you get a slightly uncomfortable conclusion. From a technicals + flows + macro‑distortion perspective, 7,000 is less a hard ceiling and more like a signpost. In real terms, we may already be “over the top of the range” once you adjust for inflation and Dollar debasement – but in nominal index points, with RSI below 60 and MACD still in the “strong, not crazy” zone, there is room for another 5–10% nominal push driven by passive and FOMO – as long as the Fed doesn’t slam the brakes and nothing breaks visibly in credit or geopolitics.
 Good night and good luck with that!
So yes, “Top of range!” was the call – last year! The problem is that the range itself has been quietly inflated upward by policy, liquidity and fear. In that World 7,000 can be both: the place where you should be cautious on valuation (we just doubled our hedges) – and, mechanically, a level the market can overshoot before RSI and MACD finally scream “Enough is enough!”
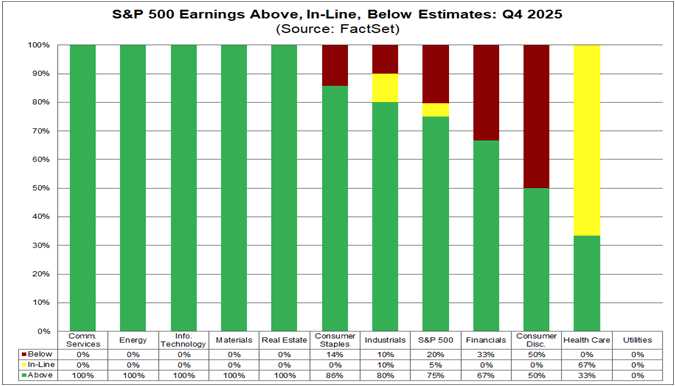
Earnings so far are good enough to justify where we are, but not cheap enough to give you a big margin of safety if anything goes wrong.
Roughly 13% of S&P 500 companies have reported Q4 so far (through last week) and about 75–80% are beating EPS estimates and 70% are beating on Revenue. That’s a bit above the long‑term average and consistent with a market that’s been “climbing a wall of worry.”
 Q4 2025 Earnings growth is running around 8.3% y/y, the 10th straight quarter of S&P Earnings expansion. Revenue growth is 7.5% y/y, so this is real top‑line PLUS some margin – not just cost‑cutting… Unfortunately, now we have to consider that Q1 has already had riots and protests, a winter storm shutdown, new tariffs, reduced Medicare transfers, restrictions on credit card interest AND a looming Government shutdown (again) – and it’s only January!
Tech (and AI‑adjacent names) are again doing the heavy lifting. Q4 Tech EPS estimates were revised up the most into the quarter. Financials and Energy have seen modest upward revisions and are contributing positively, though energy Revenues are soft on lower crude (though back to $63 this morning).
Consumer Discretionary remains a laggard with margin pressure and uneven spending show up in Retail and Travel‑related names. So the fundamental backdrop into 7,000 is: mid‑single to high‑single digit Earnings growth (broad but not explosive), with leadership still concentrated in the top 7 names as the other 493 struggle to turn a profit.
 Consensus has full‑year 2025 S&P Earnings up about 11–12% with revenues up 7%. That’s a healthy but not insane growth profile and GDP growth last year was only 2.4% – this year they are projecting 4.5%! About half of the total Earnings growth went to the Magnificent 7 – growing 20% y/y in Q4 vs about 5% for the other 493 stocks – yet they are ALL up spectacularly from Q4 2024 – aren’t they?
And let’s not forget that the Dollar has fallen fourteen (14!) points since Trump took office just over a year ago. If the indexes and the stocks were NOT up 14%, they wouldn’t be keeping up with the devalued currency. Trump didn’t raise your taxes, he simply took 14% of EVERYTHING YOU OWN AND YOUR FUTURE EARNINGS and devalued them by 14% – taxation by any other name…
 The declining Dollar has ALSO been boosting those Earnings as 60% of the S&P’s revenues come from overseas so 1 Euro earned in 2024 is now 1.14 Euros earned in 2026 and THAT is driving that 11% Earnings growth! PLUS (and this is the great – as in “making America” – part) 90% of wages are paid in Dollars so our Corporate Masters are getting a 14% discount on Employee Compensation – that’s a HUGE help to the bottom line!
It’s not a wonder then, that Consumer Confidence hit decade lows in January (84.5) – now MUCH lower than it was during Covid (Trump’s first term). You can stand at a podium and bullshit all you want and lie until you break the fact-checking machines but what you can’t do is change the fact that the same grocery list you used in 2024 is 15% more expensive in 2026 AND the items got smaller too!
The Standard & Poor’s Forward 12‑Month P/E (2027) is around 22–24x, depending on whose estimate you use. MacroMicro has it near 22.5x and YCharts shows 23.8x on a slightly different horizon. Street notes from Goldman and others peg the market at about 22x forward EPS, matching the 2021 peak multiple and approaching 2000’s 24x.
The S&P is priced for continued smooth Earnings growth and no big macro accident. Valuation has actually come down a bit from last year’s forward P/E near 28x because Earnings have risen faster than price for a stretch (thanks to a 14% drop in the Dollar that Earnings are measured in!) but we’re still clearly in the expensive historical band, NOT in the bargain bin!
So the early numbers confirm the “soft‑landing, still‑growing” story: 8% Earnings growth, 7% revenue, 75% beats but, at the same time, a 22–24x forward multiple means the S&P at 7,000 is already pricing in A LOT of that good news. There isn’t much cushion if later in the season we start to see guidance cuts from big cyclicals, weaker discretionary names or we start to see additional margin pressure from wages and tariffs.
In other words: Earnings, so far, say 7,000 is not crazy in nominal terms but the current multiple leaves Q1 as a “prove it” quarter. If the 8–10% Earnings growth run‑rate holds and guidance stays intact – the tape can certainly grind higher BUT if growth slips just a couple of points – the same elevated P/E that got us here quickly becomes the trap door…


")