
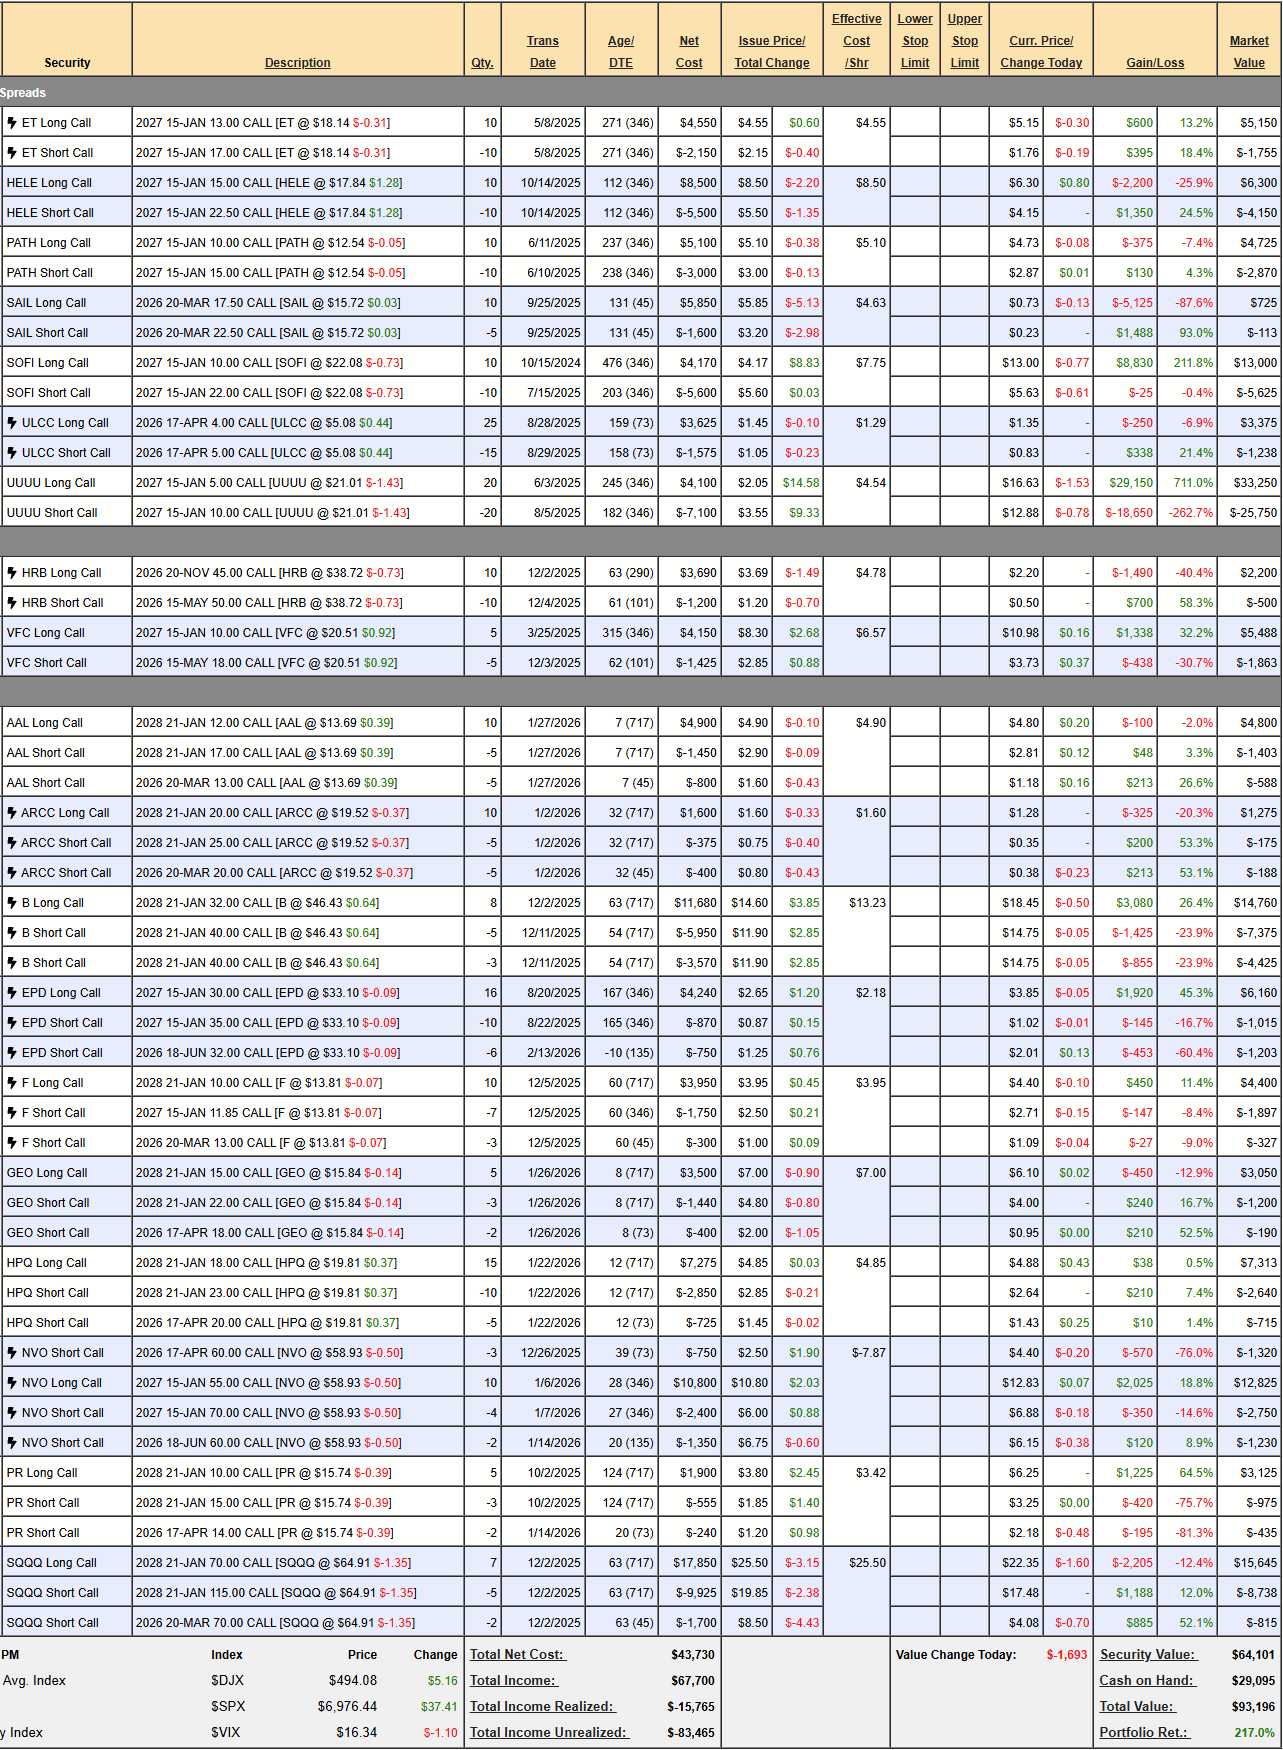
 $93,196 (up 217%)!
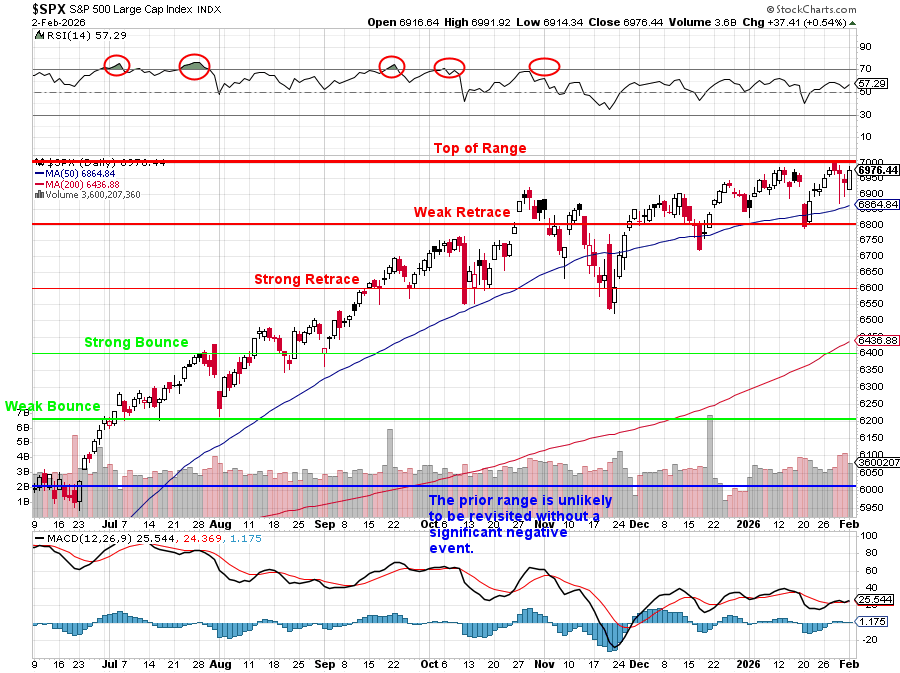
“Only” up $3,409 (3.7%) since our last review (Jan 6th) but the S&P was 6,944 then and now 6,976 so up 0.46% – I’d say we’re doing well! Also, we added a few trades and, because of the bid/ask spreads, you always seem to lose money when you first add an options spread – you have to get used to that aspect of trading. In any case, we’re still averaging an average annual gain of 62% so we only need 4.6 more years to get to our $1 MILLION goal.
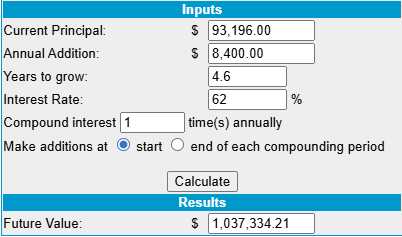
That means folks, you can still start now with $96,196 and pledge to add $700 each month for the next 55 months ($38,500) and, if we can keep up this pace – you will have $1,037,334.21 by September of 2030! NOT that we expect to keep doing this well – these have been a crazy first 3.5 years as we’ve turned $29,400 into $93,196 – our original plan was to make just 10% a year for 30 years to get to $1M…
If you are just joining us, we began on Aug 25th, 2022 with $700 and each month we added $700 ($29,400) so far and each month we find things to buy under NO MARGIN rules (for 401K/IRA players). This is, despite the huge gains, a fairly conservative portfolio and we are generally quick to take our profits and run – as we always seem to find new opportunities to make more. Last year, our 12 prior Portfolio Reviews were:
- How to Become a Millionaire by Investing $700 per Month – Part 41/360
- How to Become a Millionaire by Investing $700 per Month – Part 40/360
- How to Become a Millionaire by Investing $700 per Month – Part 39/360
- How to Become a Millionaire by Investing $700 per Month – Part 38/360
-
How to Become a Millionaire by Investing $700 per Month – Part 37/360 – Year 4 Begins!
-
How to Become a Millionaire by Investing $700 per Month – Part 36/360 – 3 Years In!
- How to Become a Millionaire by Investing $700 per Month – Part 35/360
- How to Become a Millionaire by Investing $700 per Month – Part 34/360
- How to Become a Millionaire (EVEN in This Market) by Investing $700 per Month – Part 33/360
- How to Become a Millionaire – EVEN in a CRASH!!! by Investing $700 per Month – Part 32/360
- How to Become a Millionaire by Investing $700 per Month – Part 31/360
- How to Become a Millionaire by Investing $700 per Month – Part 30/360
- How to Become a Millionaire by Investing $700 per Month – Part 29/360
Now you are all caught up! We have $64,101 in positions and $29,095 in CASH!!! but we also added an SQQQ hedge to protect our gains and now we’re waiting to see how our companies perform in their Q4 earnings reports before doing anything drastic.
As promised last month, we added 4 new spreads (AAL, ARCC, GEO and HPQ) and we’ll have to wait and see how earnings go for additional opportunities. Join us in the Live Member Chat Room for all of our trade ideas in our 4 Member Portfolios PLUS our Top Trade Alerts PLUS our Live Analysis AND our Educational Master Class Series.
-
- ET – We’re well over our target at net $3,395 on the $4,000 spread so there’s $605 (17.8%) left to gain, which is not really worth playing out. What we can do is roll our 2027 $13 calls at $5.15 ($5,150) to 10 2028 $15 calls at $3.50 ($3,500) and that puts $1,650 in our pockets NOW and leaves us with a $2,000 spread but the short 2027 $17s can be rolled to the 2028 $20s ($1.10) over time so really it’s a $5,000 spread and our new net is ($3,395 – $1650 =) $1,745 with $3,255 (186%) upside potential. Good for a new trade (it IS a new trade!)!
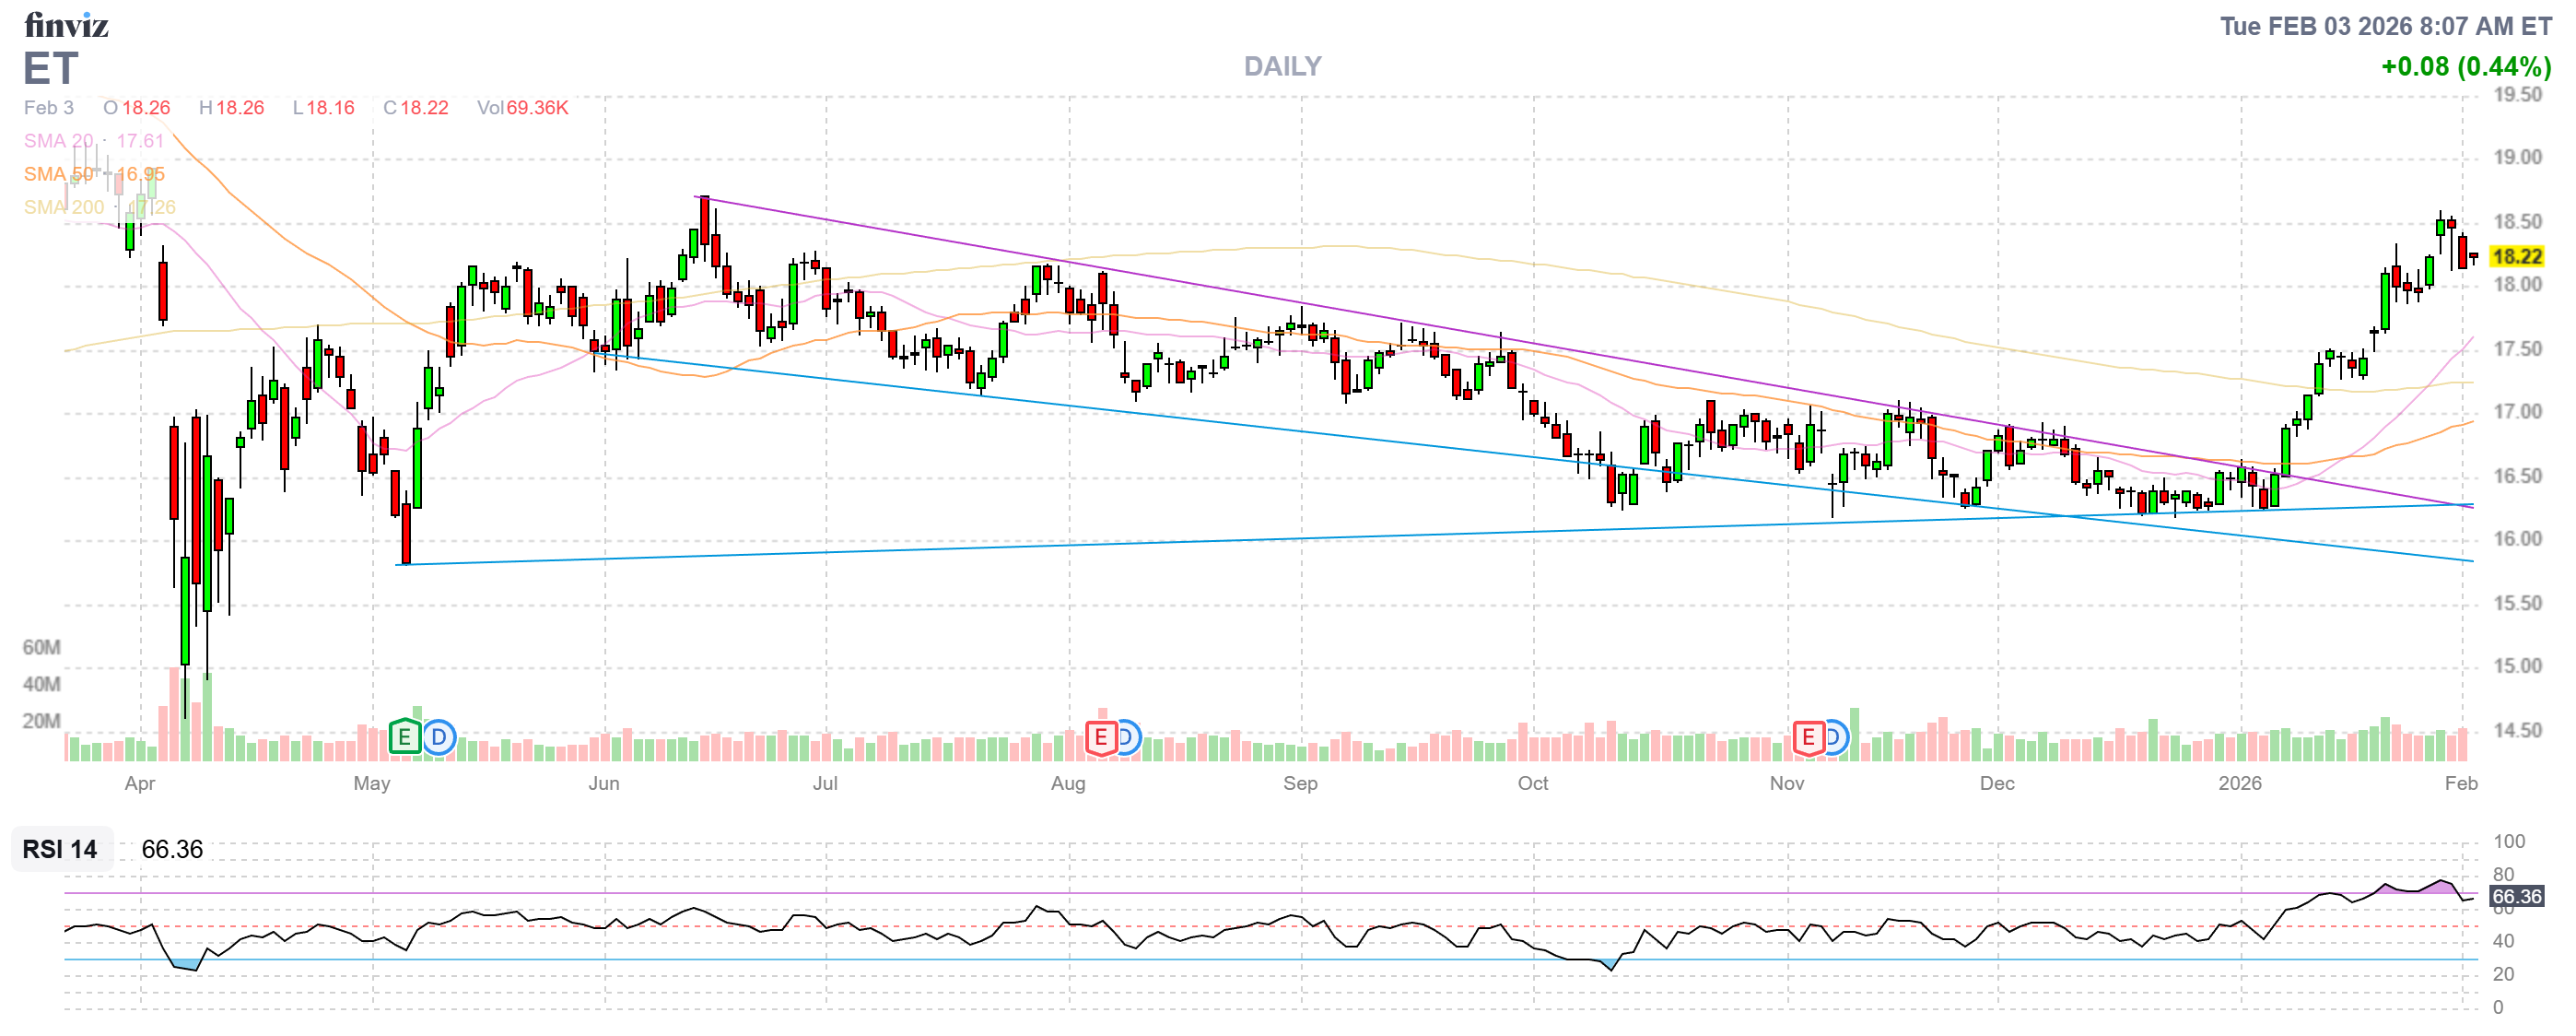
THAT is how we re-invigorate a trade. We initially put $2,400 into the trade in May and now we’ve taken $1,650 (68.7%) off the table and re-invested the profits into a longer-term spread as our payoff potential had dropped to 17.8%. Now we are back to a powerful spread without having to risk moving to a less-familiar stock. Not bad for a simple, no-margin spread – right?
-
- HELE – They had good earnings but nobody likes them. Not too much damage so we’ll give it some time. Net $2,150 on the $7,500 spread has $5,350 (248%) of upside potential.
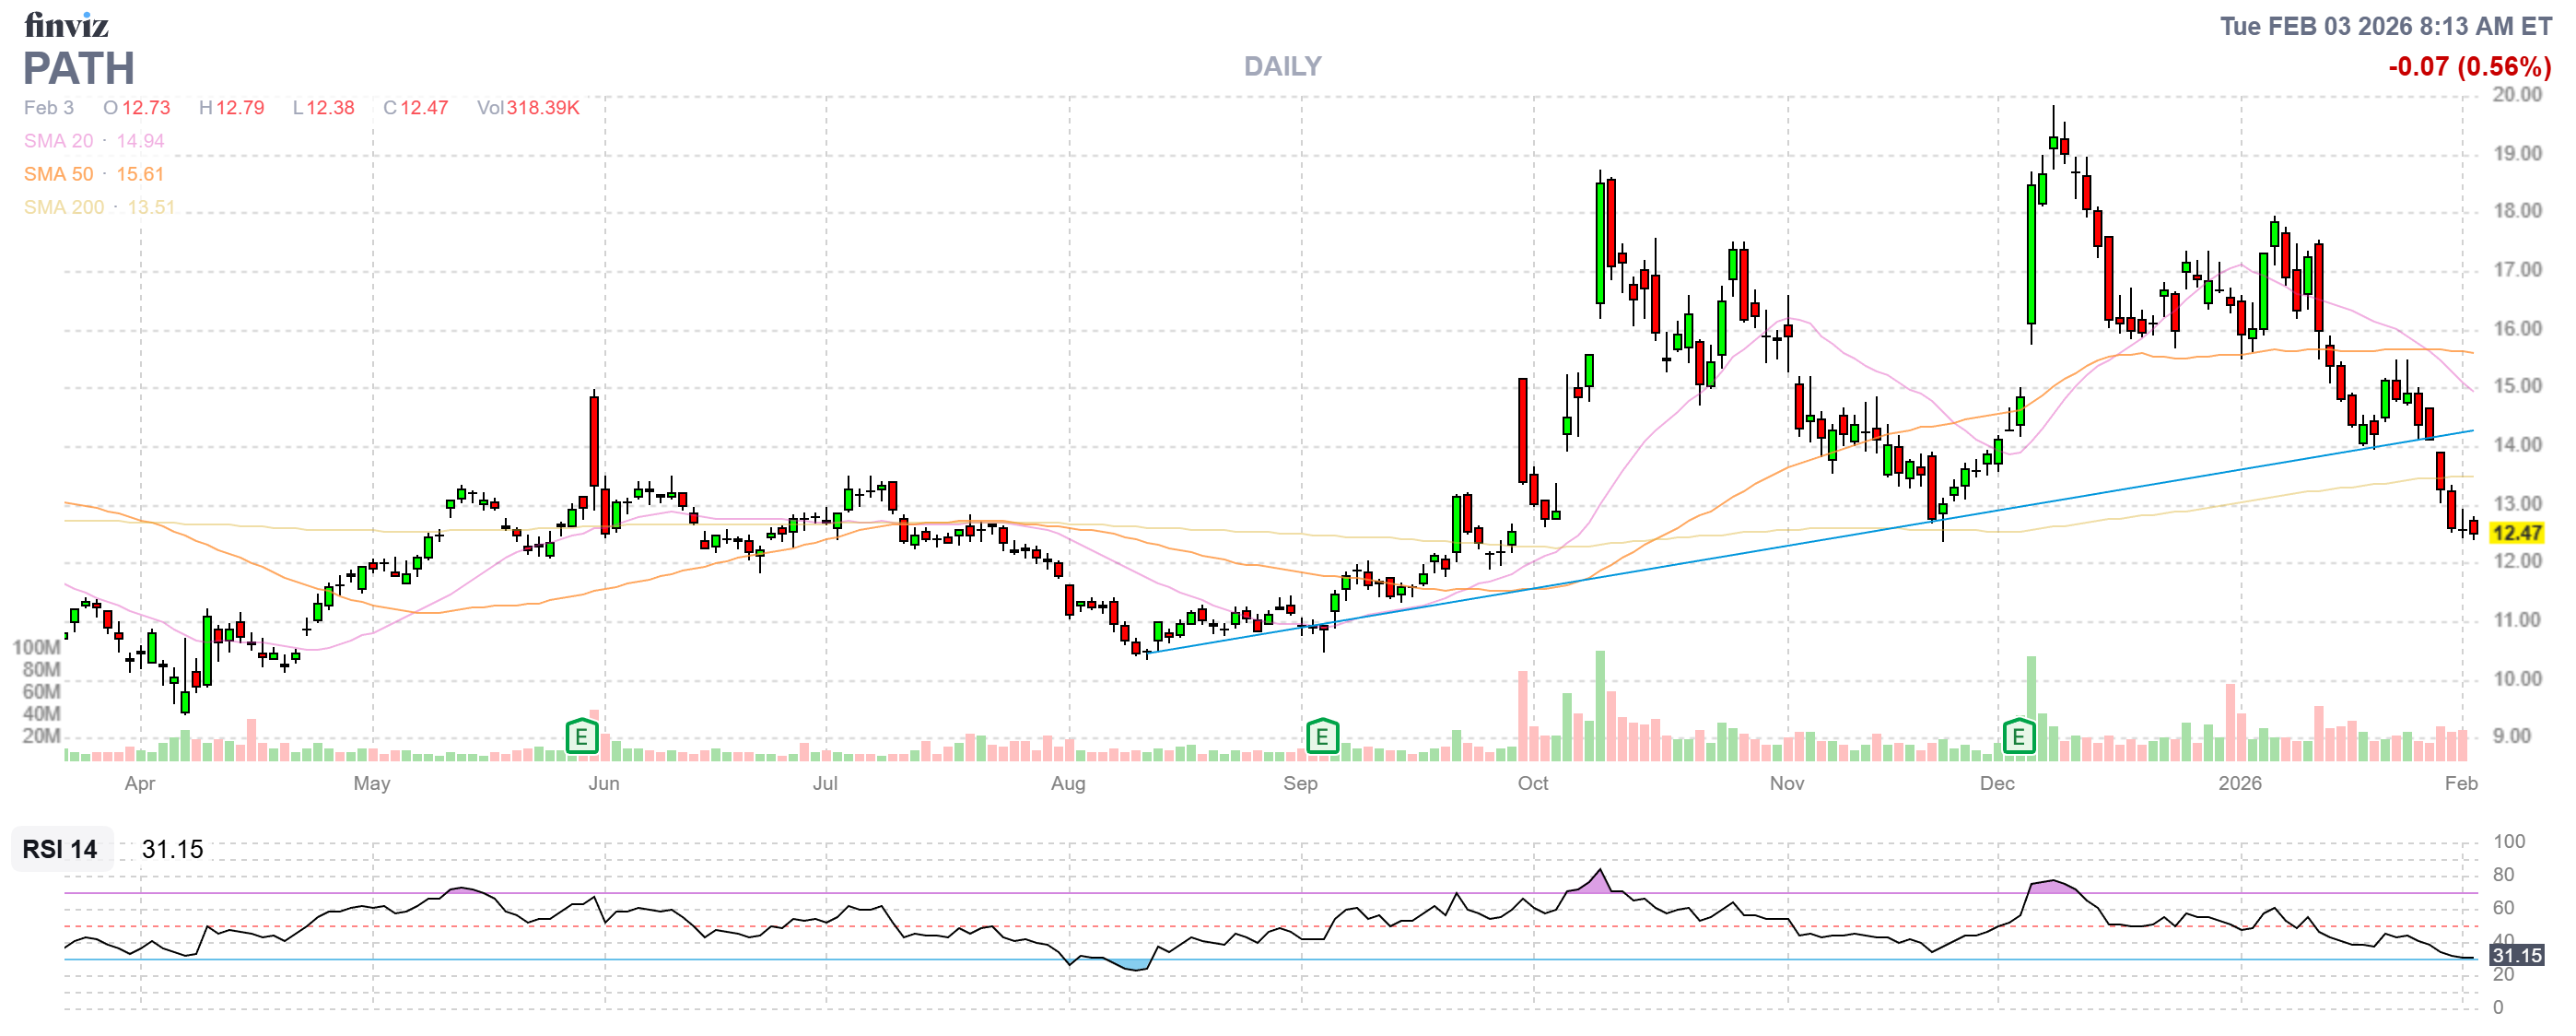
- PATH – Such crazy action on this one. We’ll ride it out. Net $1,855 on the $5,000 spread has $3,145 (169%) upside potential. Good for a new trade!
-
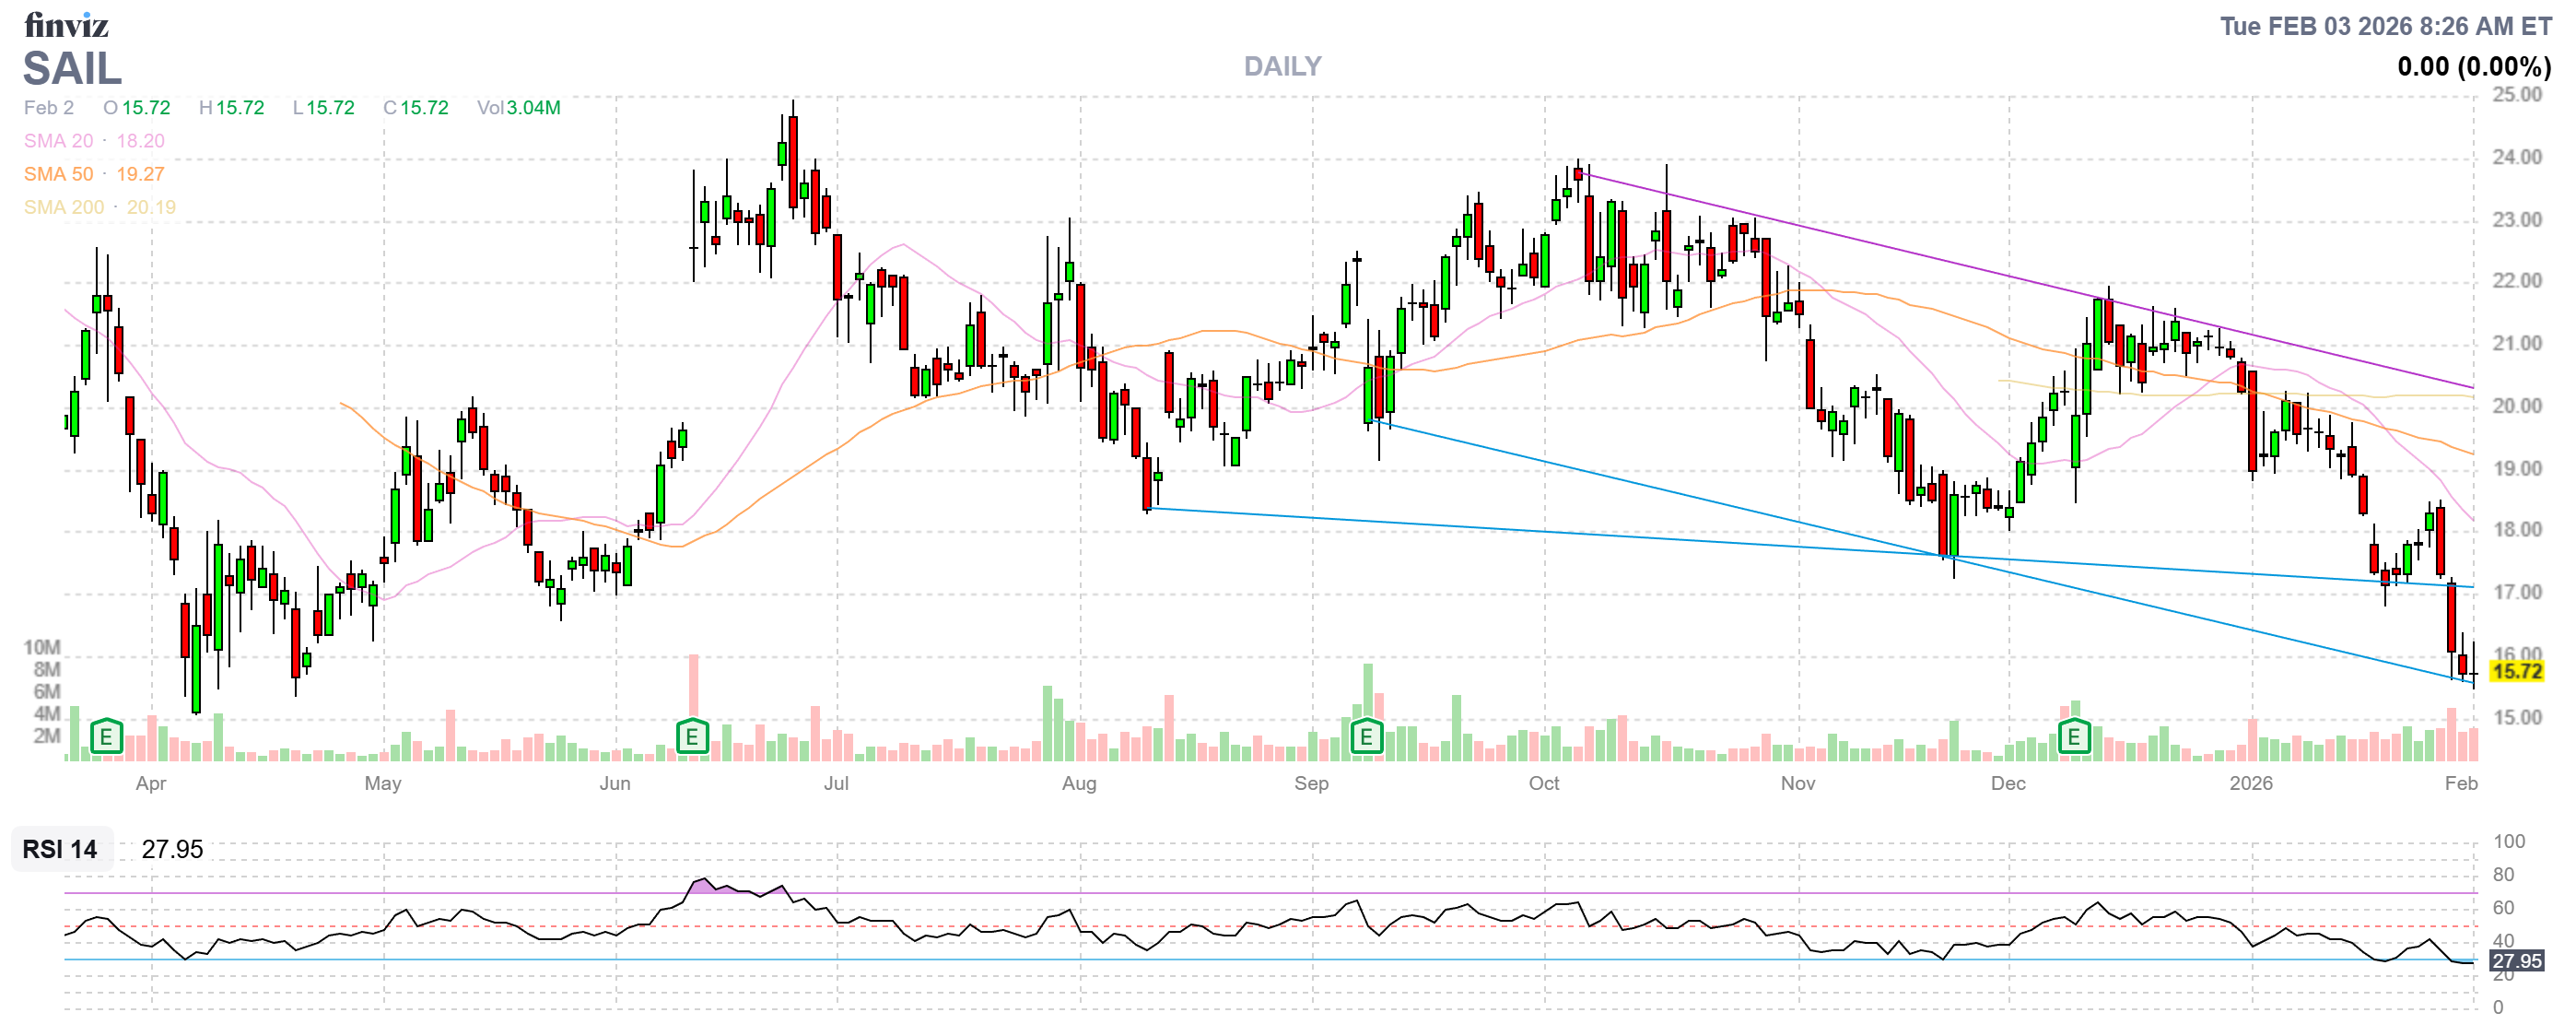
- SAIL – Disappointing so far but earnings were good – not bad! The March $17.50s are 0.73 ($730) and Sept $15s are $3.30 ($3,300) so let’s roll to those and sell 5 Sept $17.50s for $2.40 ($1,200) to help pay for it so that’s net $1,370 plus our initial net $4,250 is net net $5,620 on what will hopefully become a $5,000 spread but losing $620 is better than losing $3,637 – if all goes well.
-
- SOFI – Net $7,375 on the $12,000 spread has $4,625 (62.7%) left to gain but we don’t need to be in the 2027 $10s ($13,000) so let’s roll them to 15 2027 $20 calls at $9 ($13,500) and sell 5 short April $23 calls at $1.90 ($950) so net $450 in our pocket and we’re sitting on an $18,000 spread (because the 2028 $32s are $5.60 for the potential roll) at net net ($7,375 – $450 =) $6,925 with $11,075 (159%) of upside potential PLUS (7 x $950 =) $6,650 income potential selling short-term premium.
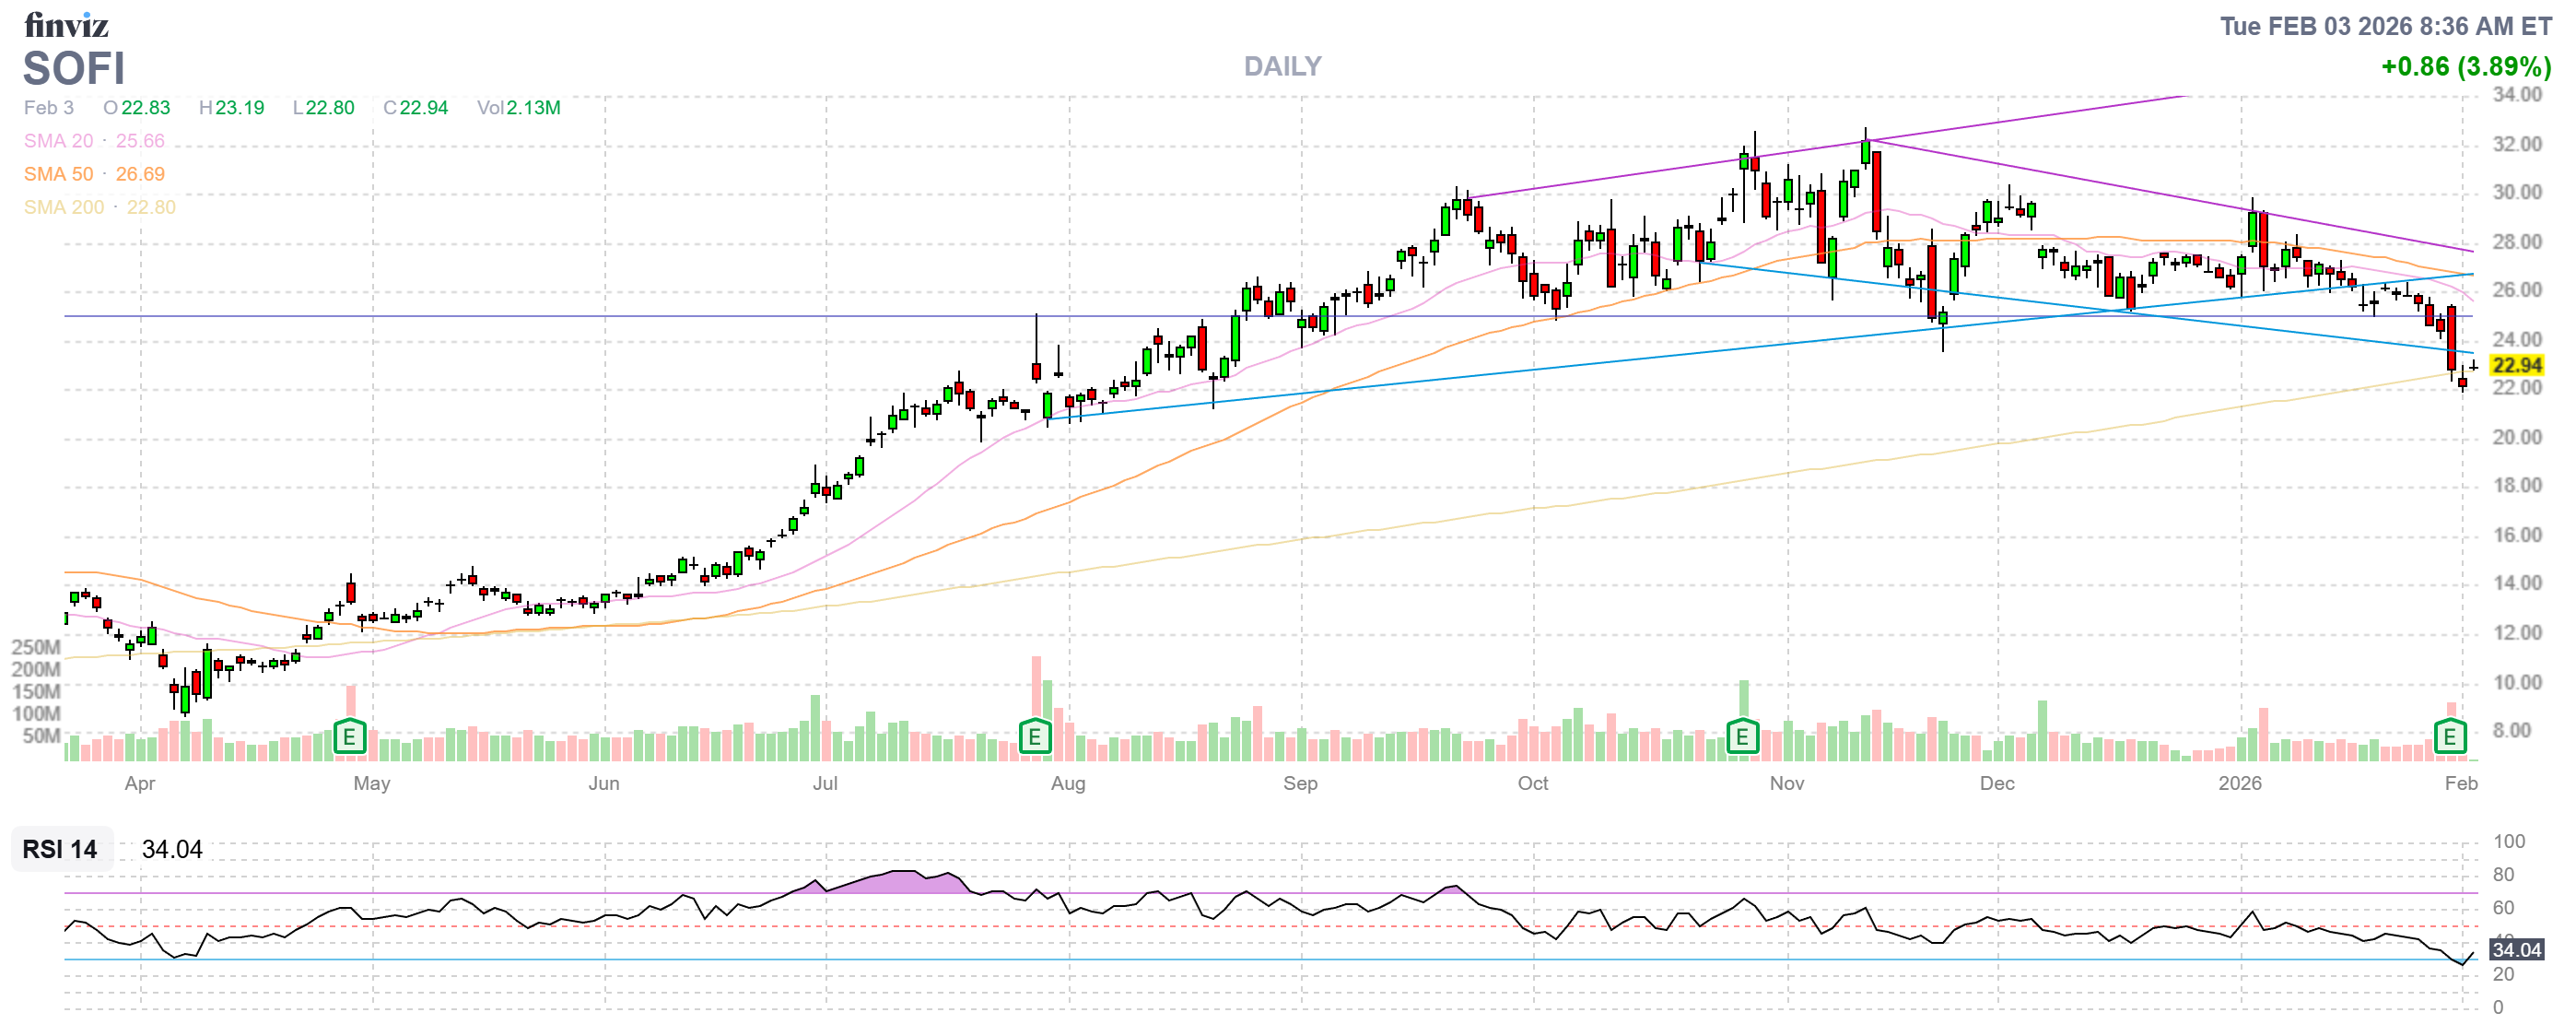
We took a spread with $4,625 (62.7%) upside potential and turned it into a spread with $17,725 (255%) worth of upside potential – FOR A $450 CREDIT! Those $10 calls were tying up money that was put to MUCH better use as the longer time and higher strike – LOWERS our downside exposure and adding 5 more long calls turned it into an income-producer. ALWAYS look for ways to improve your positions!
-
- ULCC – Net $2,137 on the $2,500 spread has just $363 (16.9%) left to gain by April (73 days) so it’s not a terrible return. We added AAL so we don’t need two airline trades so I think we’ll just let this one play out but it would be silly not to sell 10 more April $5 calls for 0.83 ($830) as that’s a lot more than we’d make at $5 anyway (it would have to be over $5.83 for this sale NOT to be beneficial AND it hedges our downside on earnings). Now the upside potential is $1,193 (55.8%) at the same $5!
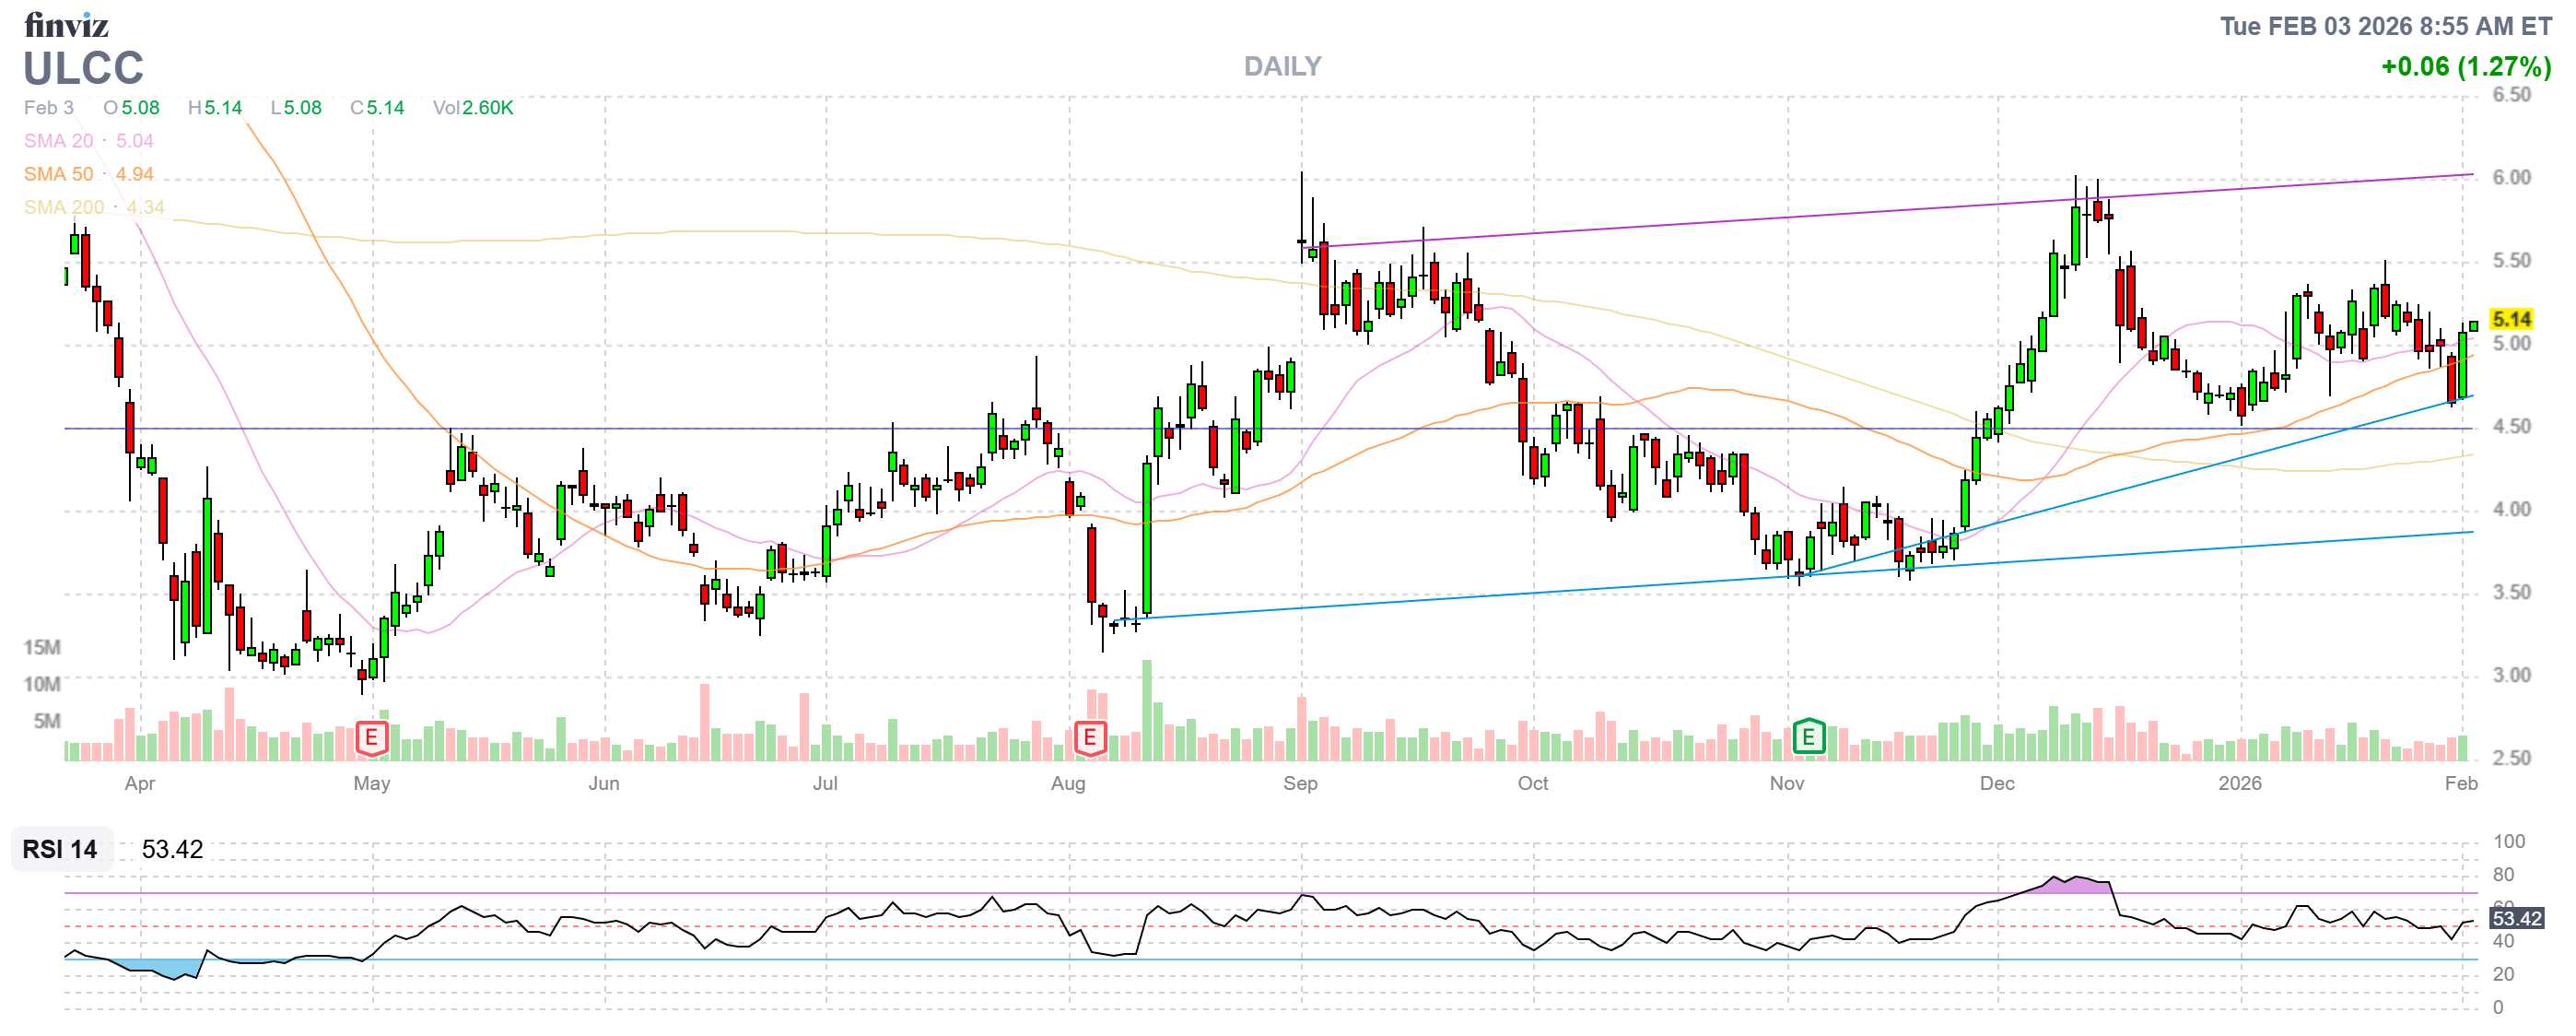
It doesn’t seem like much but $830 her, $1,500 there and, over the course of a year, you can have a huge impact on your portfolio by simply paying attention to these small adjustment opportunities along the way.
-
- UUUU – Over 100% over our target at net $7,500 but it’s a $10,000 spread so we still have $2,500 (33%) left to gain BUT we can do much better. Our 2027 $5 calls are $33,250 and we can roll them to 40 2028 $15 calls at $13 ($52,000) and sell 20 2028 $25 calls at $10.50 ($21,000) and that is $2,250 in our pocket AND we have a $40,000 spread at net net ($7,500 – $2,250 =) $5,250 with $34,750 (661%) upside potential and OF COURSE IT’S GOOD FOR A NEW TRADE!!!
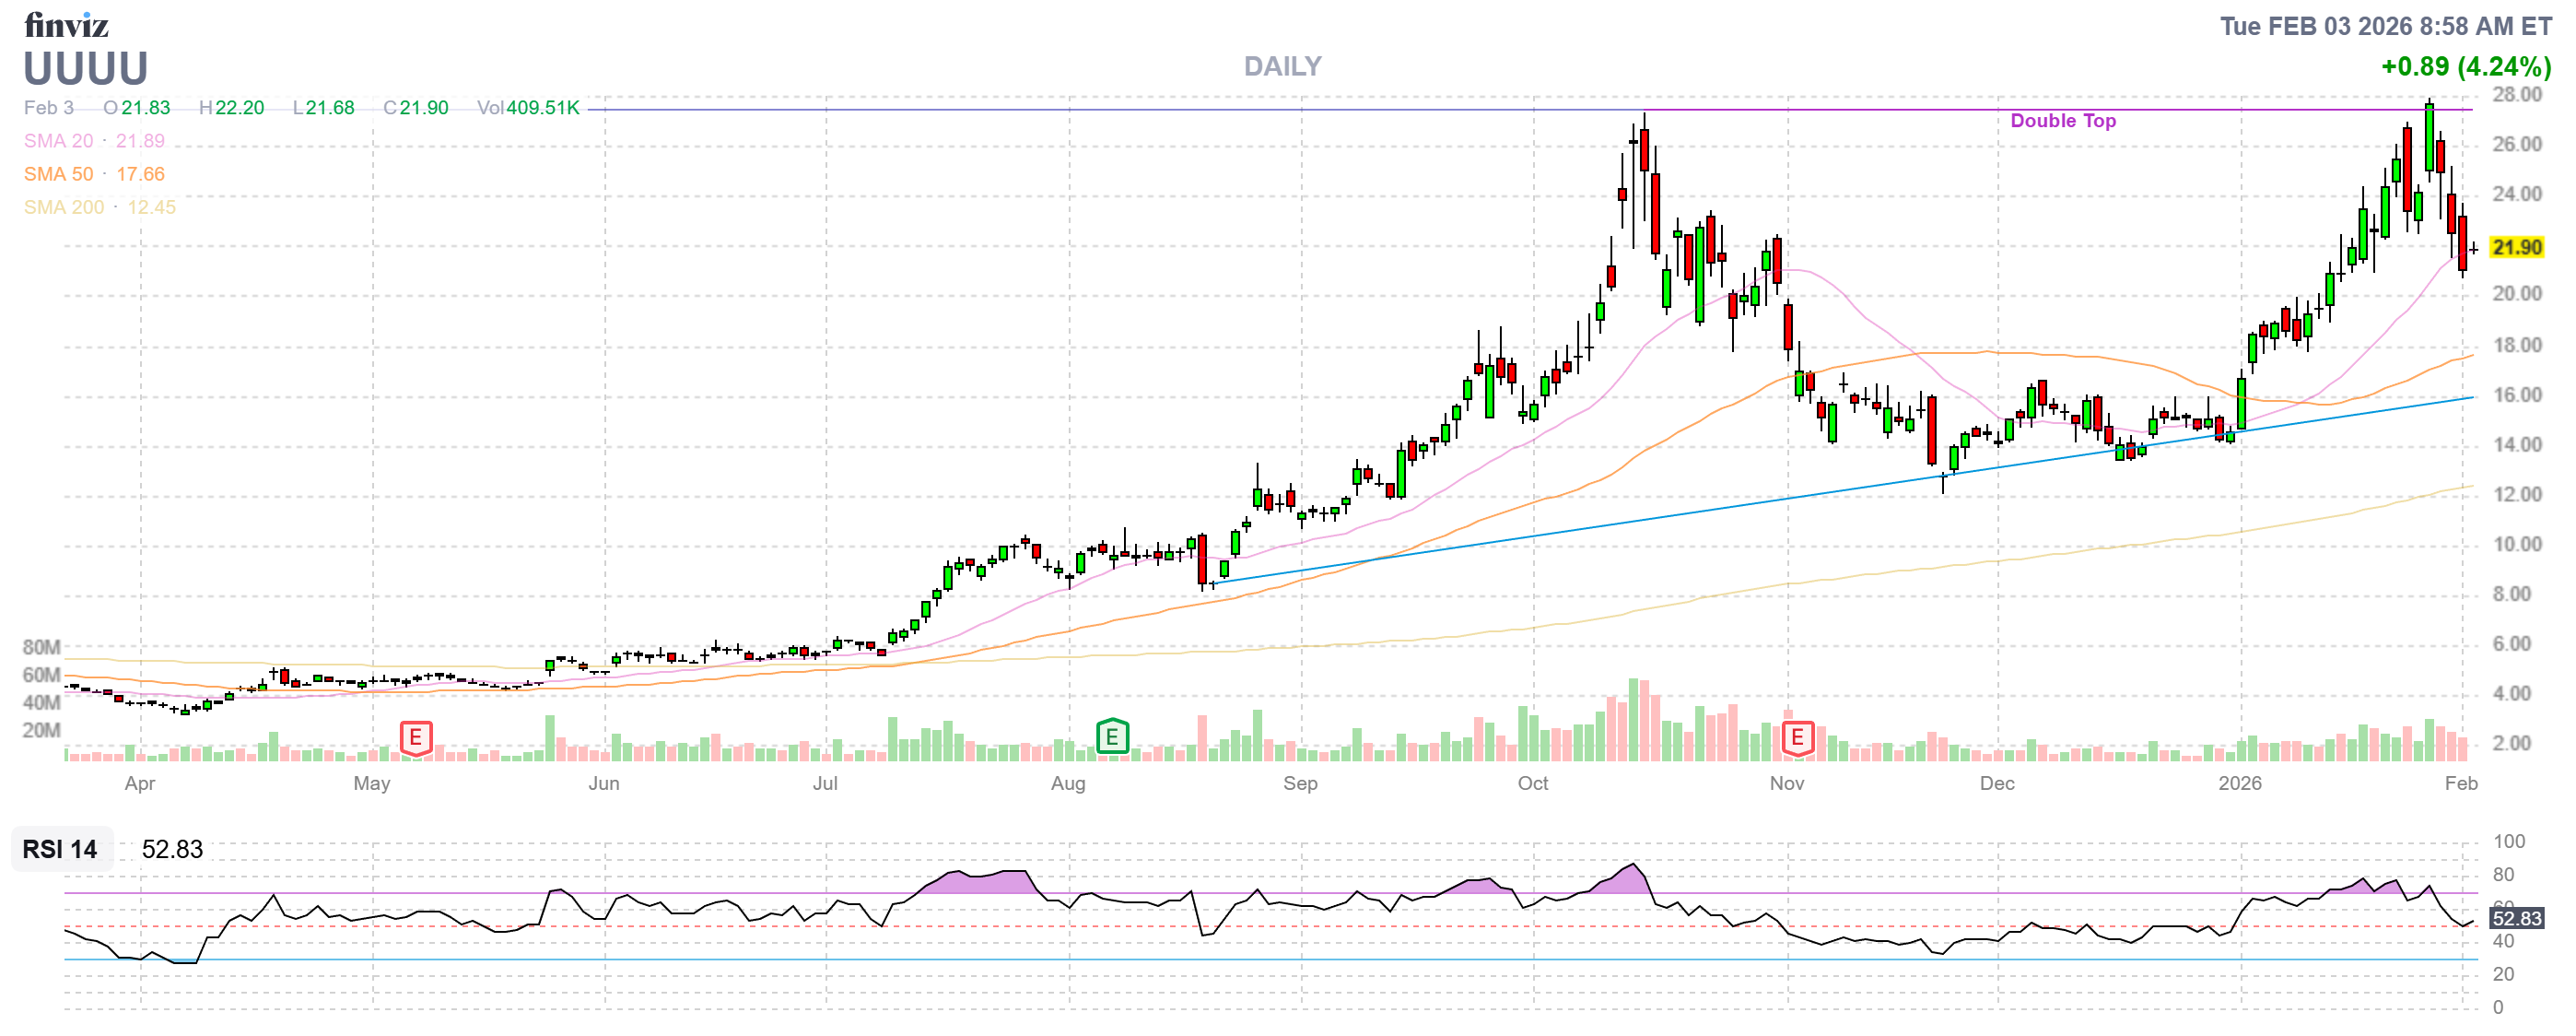
After earnings we will deal with the 20 short 2027 $10 calls but, for now, they are a hedge against a sell-off.
-
- HRB – Off track so far and earnings are today – so we’ll see.
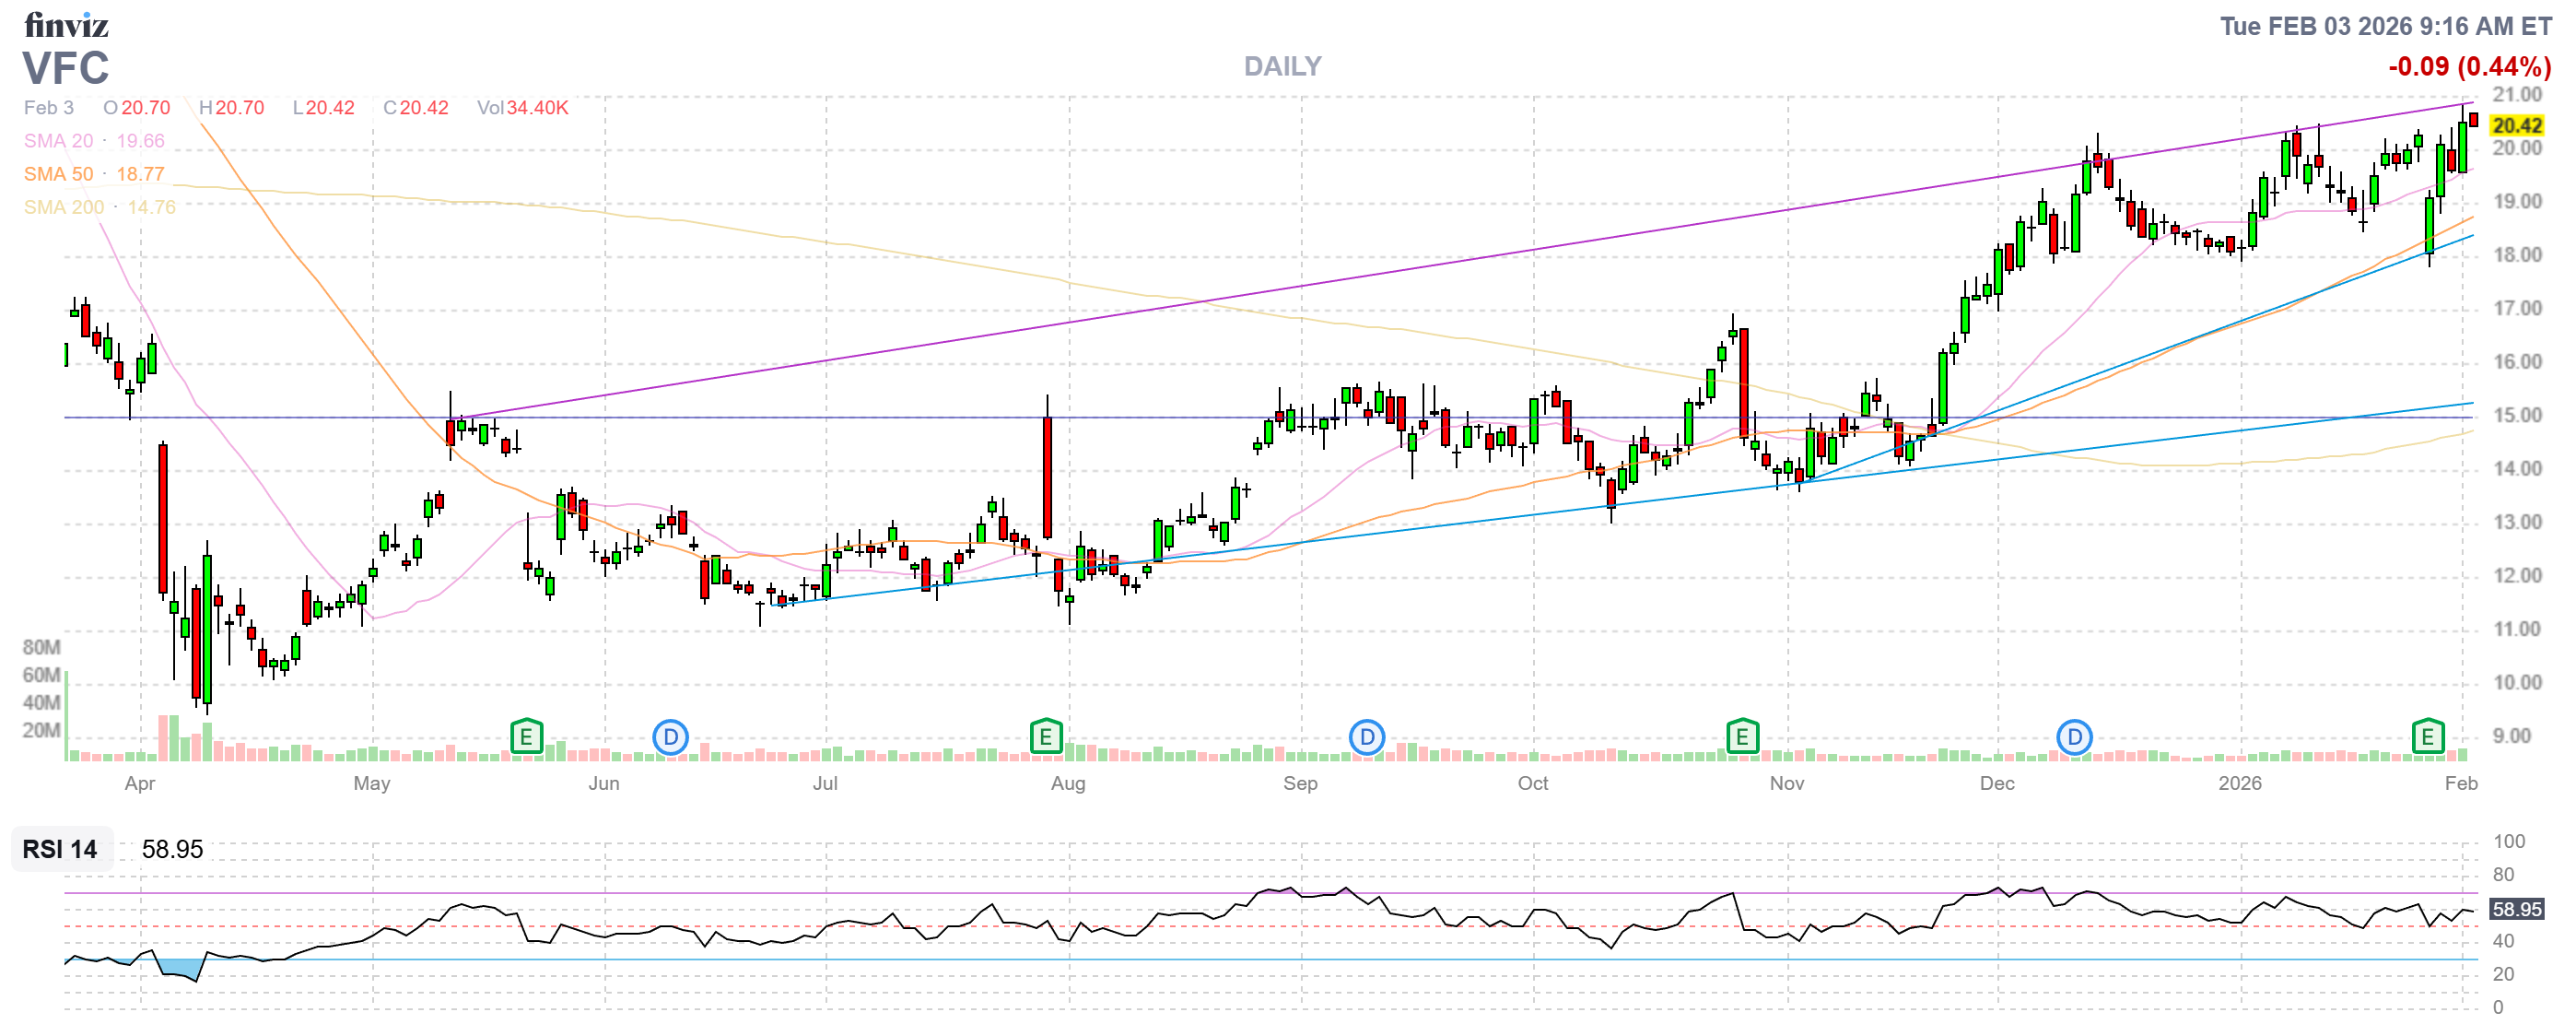
- VFC – In the money at net $3,625 on the $4,000 spread with just $375 (10.3%) left to gain so let’s cash out and move to 10 2028 $15 ($8.50)/25 ($4.75) bull call spreads at $3.75 ($3,750) so we’re spending net $125 to move from $375 (10.3%) upside potential to $6,250 (166%) upside potential and we’re $5,450 in the money – that’s $1,825 MORE than the net of the original spread! Great for a new trade, of course!
-
- AAL – One of our new ones at net $2,809 on the $5,000 spread with $2,191 (77.0%) upside potential PLUS income potential. Good for a new trade.
- ARCC – Another new one, also with income potential at net $912 on the $5,000 spread with $4,088 (448%) upside potential. Great for a new trade.
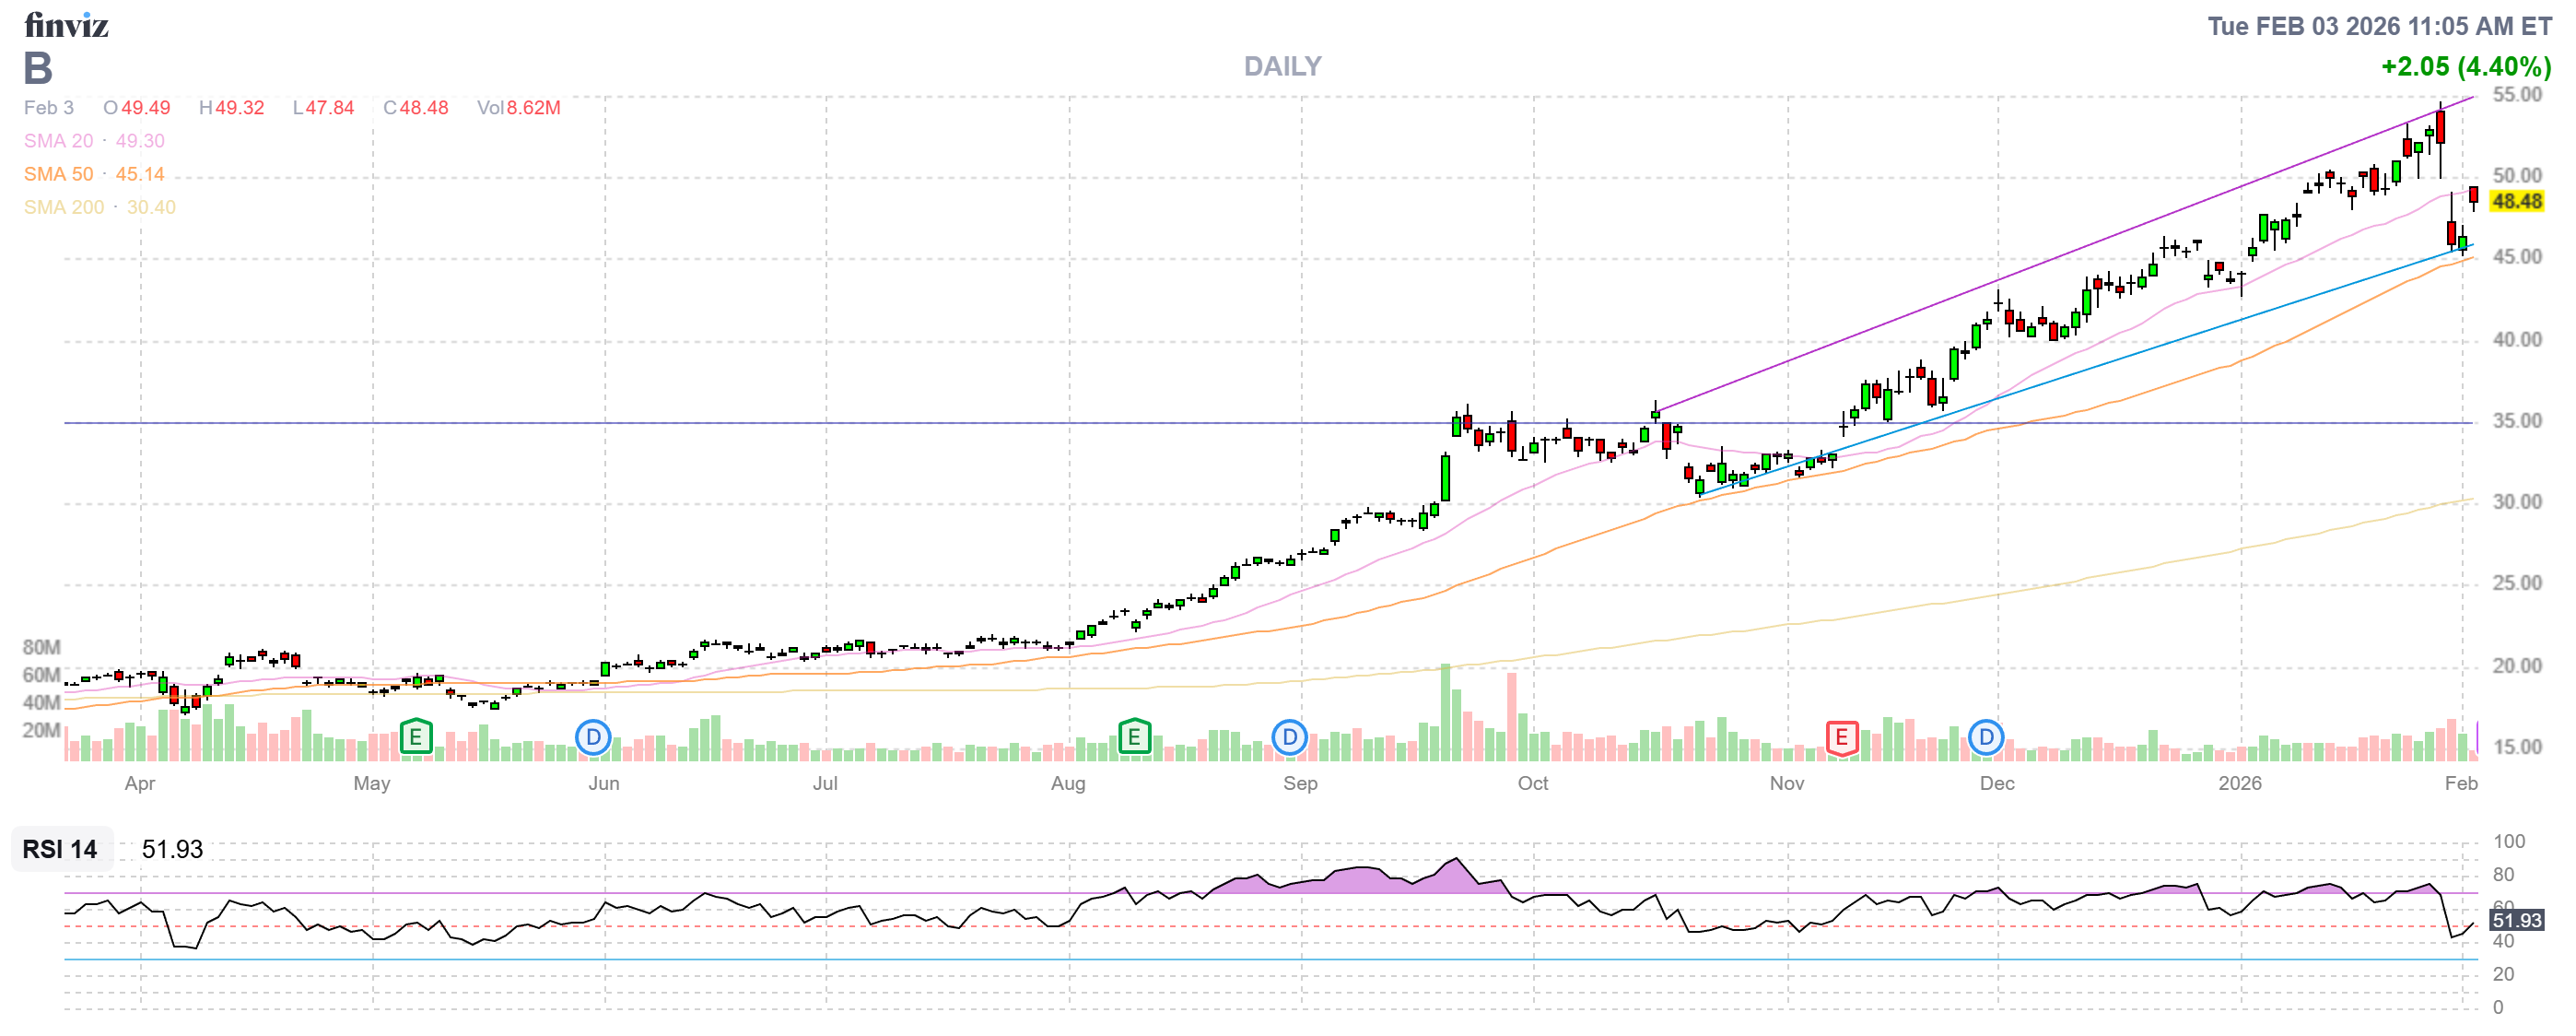
- B – Net $2,960 on the $6,400 spread with $3,440 (116%) upside potential. Not much to do until 2029s come out but, then again, 116% is pretty good money if we just leave it alone. Good for a new trade – even if boring.
-
- EPD – Net $3,942 on the $8,000 spread has $4,058 (102%) upside potential so that one is good for a new trade too – especially as it’s just one-year.
- F – Net $2,176 on the $5,000 spread (roll assumed) has $2,824 (129%) upside potential so also good for a new trade.
- GEO – Brand new at net $1,660 on the $3,500 spread with $1,840 (110%) upside potential and good for a new trade.
- HPQ – Another new one! Net $3,958 on the $7,500 spread with $3,542 (89.5%) upside potential but also 7 more chances to sell $725 ($5,075 – 128%) in short-term premium. Great for a new trade!
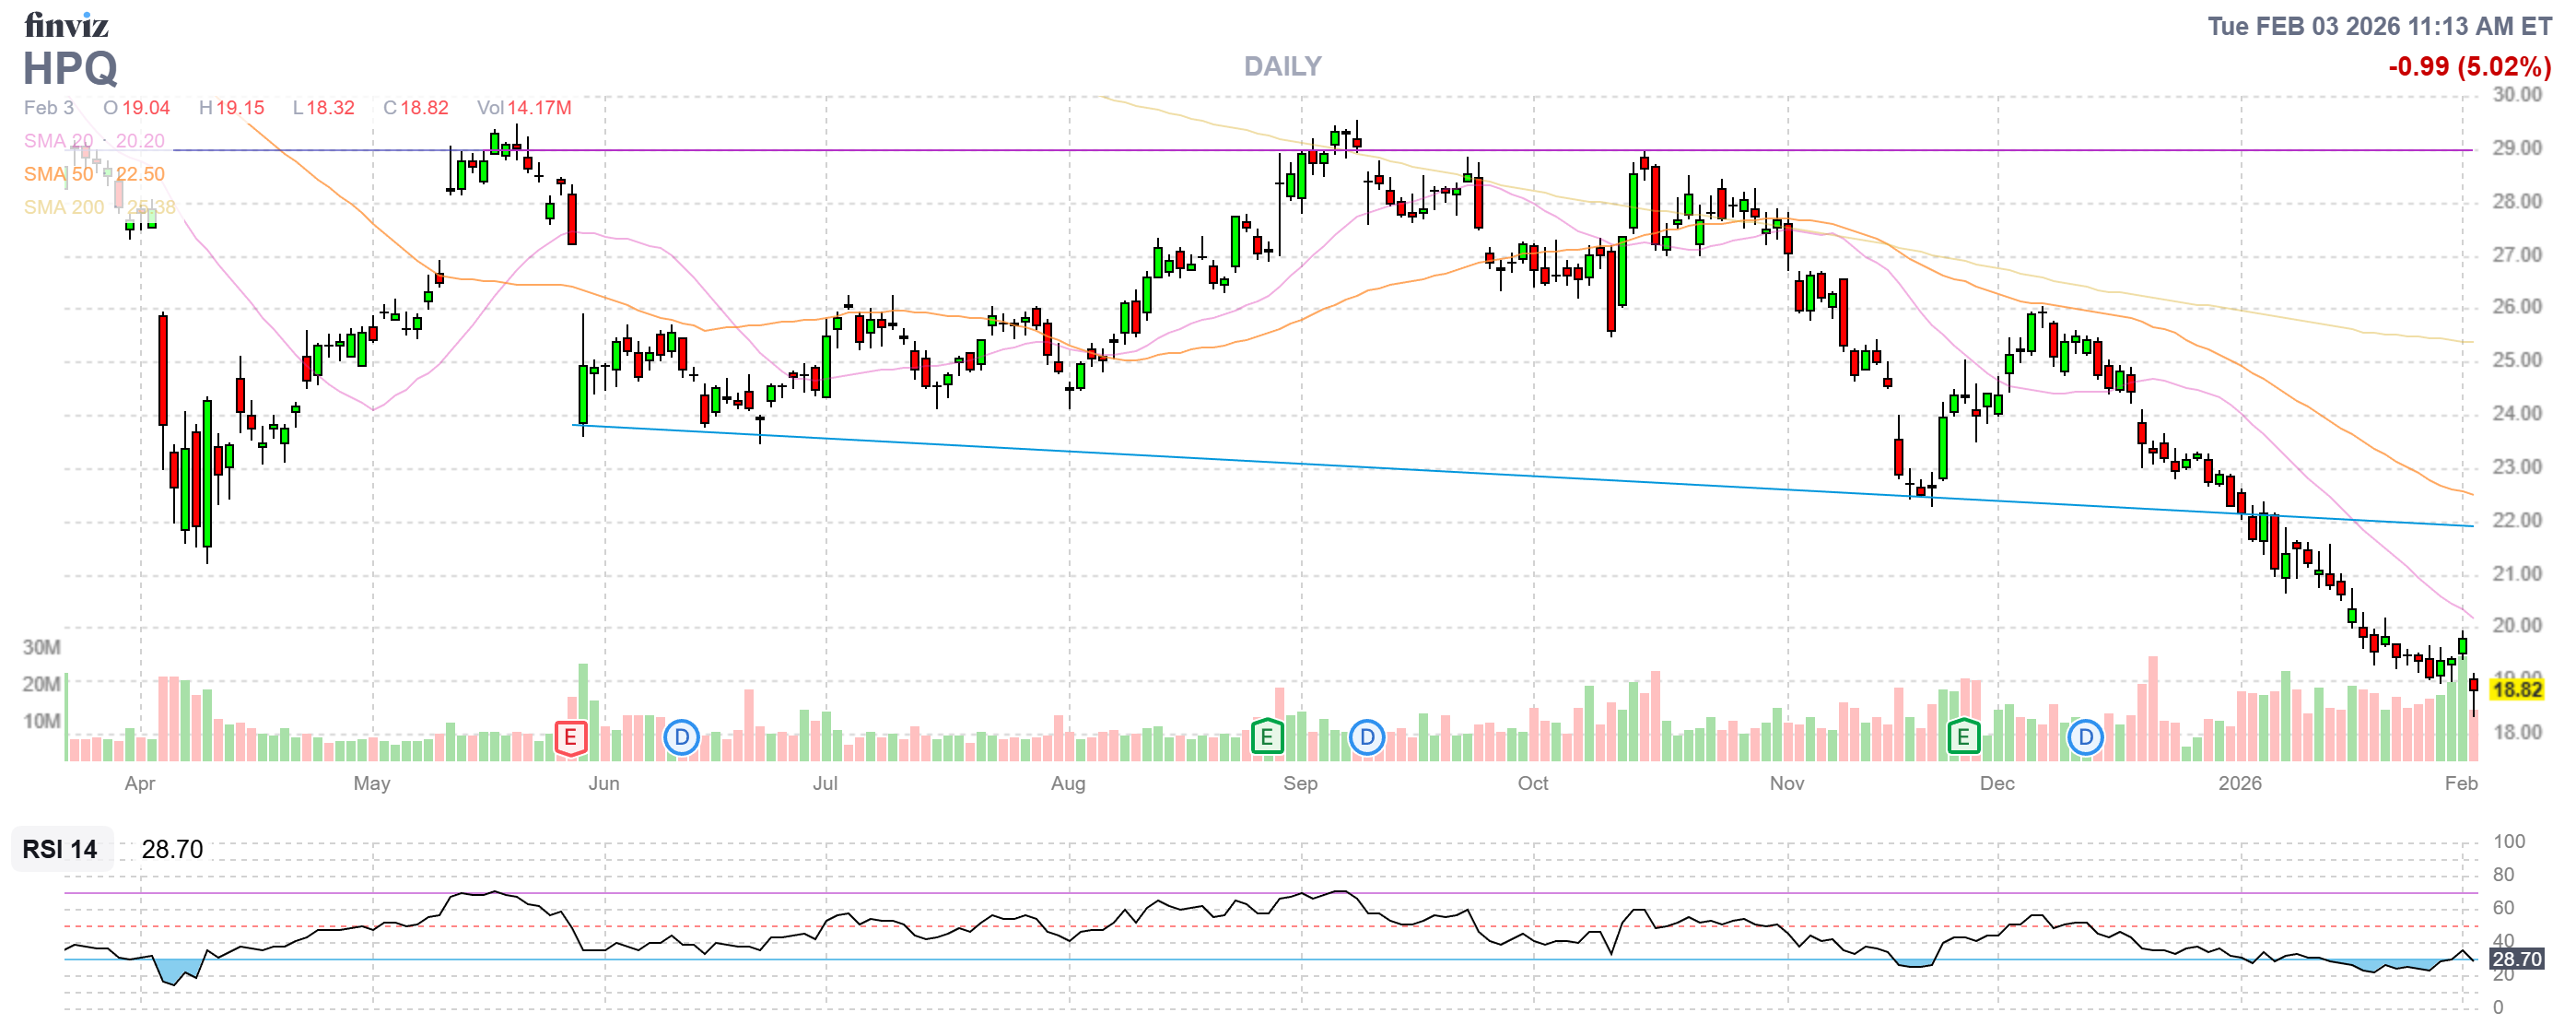
That’s right, this is our INCOME section so when we just tell you “XXX upside potential” we are UNDERSELLING the potential as the MASSIVE cash flow from our premium sales is just a bonus if all goes well!
-
- NVO – Also new! Net $7,525 on the $15,000 spread with $7,475 (99%) upside potential (and some income).
- PR – Net $1,715 on the $2,500 spread has $785 (45%) income potential but we already cashed out or first income sale and here’s another one at 14% in 3 months, etc. etc… Good for a new trade as 7 x $240 is $1,680 (97.9%) – THAT’S where the money is (going to be) on this one!
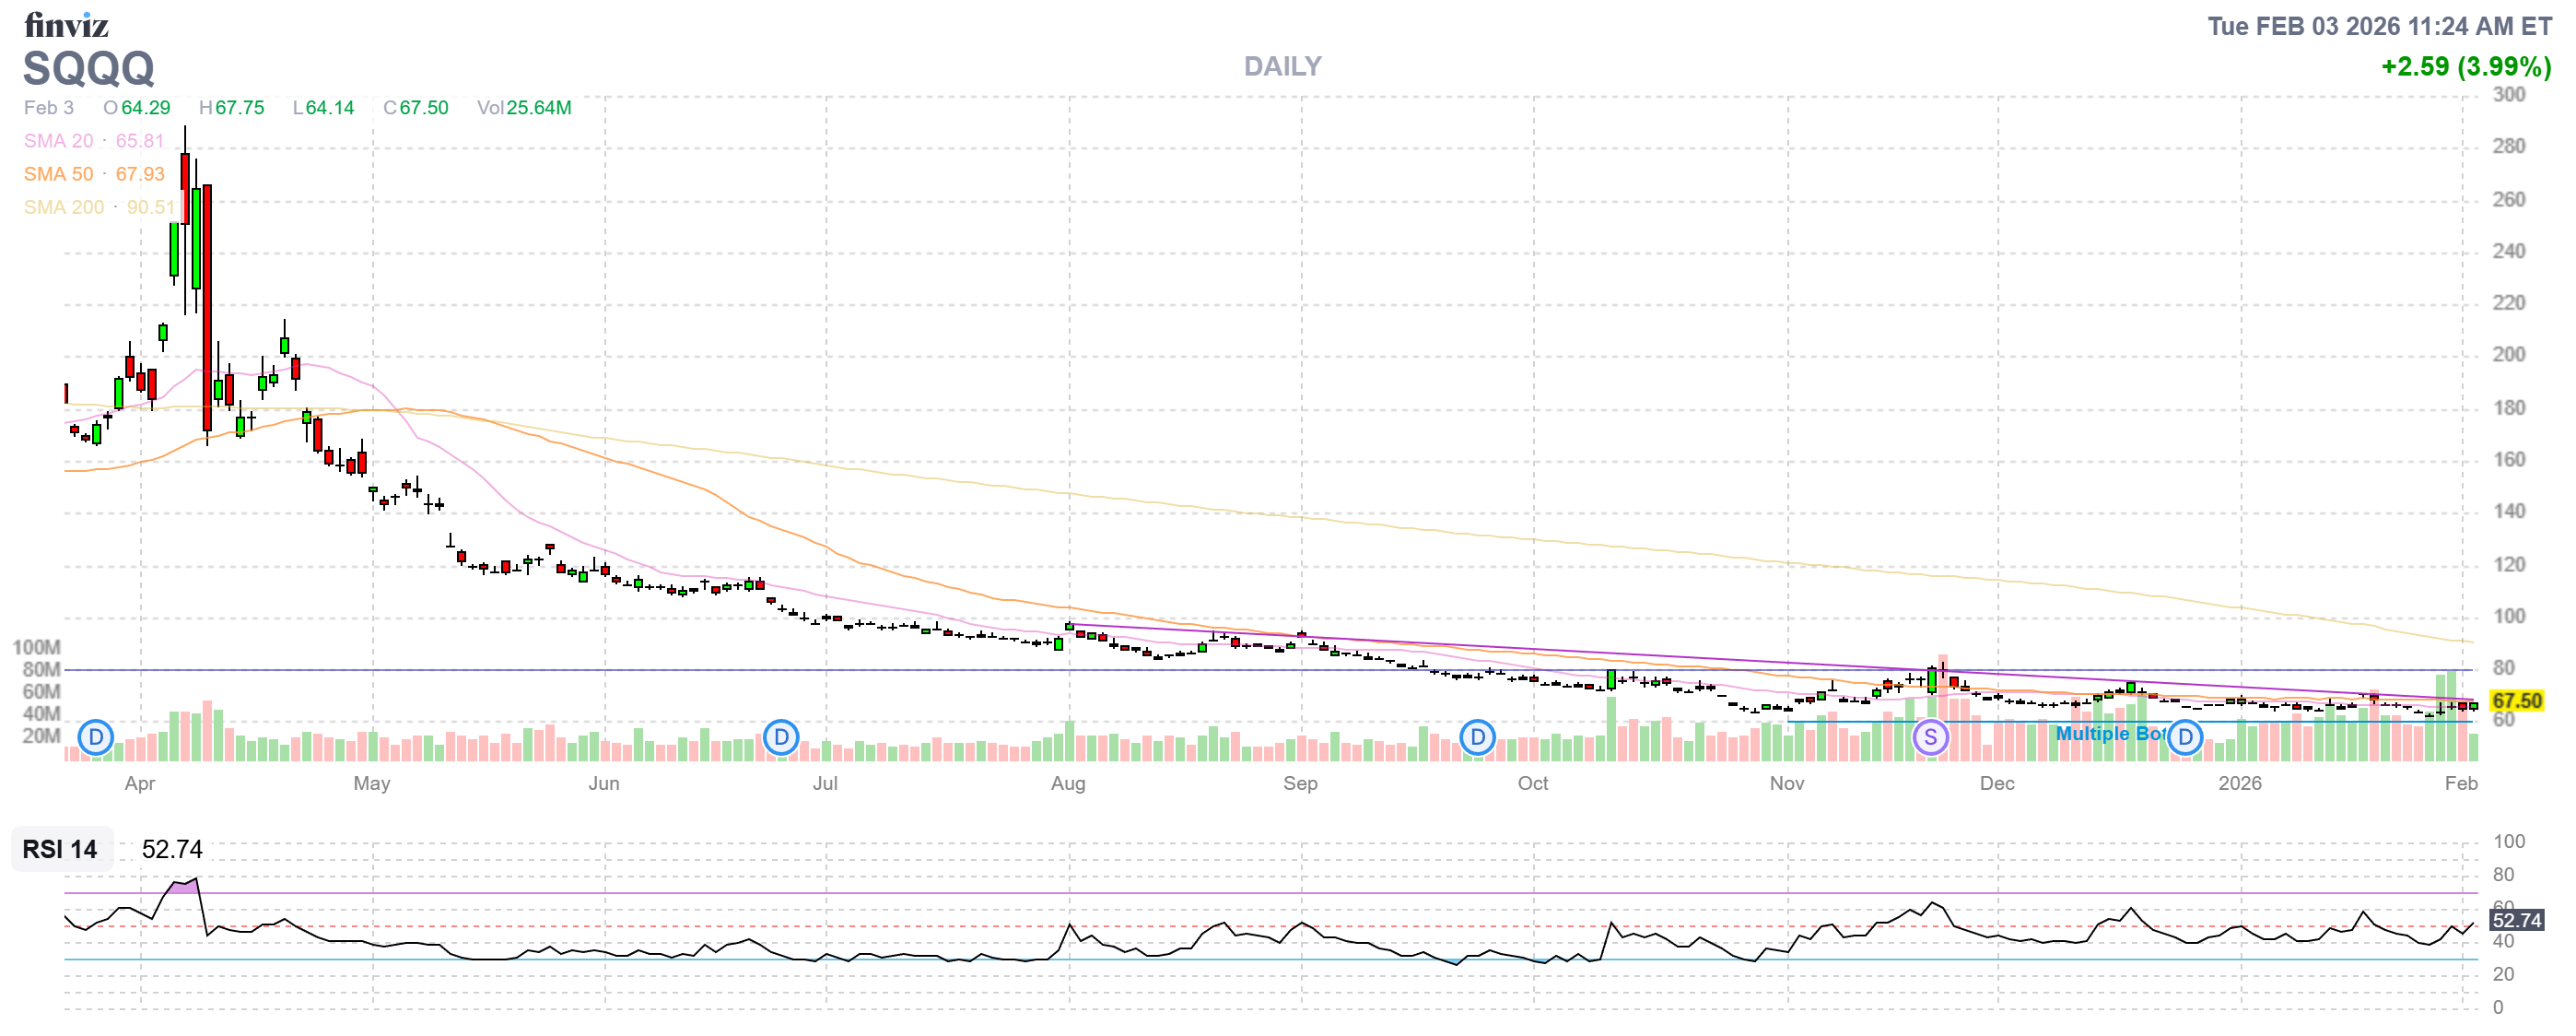
- SQQQ – Our hedge is net $6,092 and 1.6 x 64.91 is $103.85 and that would be $33.85 x 7 is $23,695 less $6,092 is net $17,603 downside protection. Notice it’s not costing us anything overall (P&L balance) and we’ll keep selling short-term calls until we’re in a free spread.
So it looks like we’ve taken net $3,685 off the table in our adjustments so we’ve ADDED to our CASH!!! pile:
| Position | Adjustment Description | Cash Flow |
| ET | Rolled 2027 $13 calls to 2028 $15 calls | +$1,650 (Credit) |
| SAIL | Rolled March $17.50s to Sept $15s; sold Sept $17.50s | -$1,370 (Debit) |
| SOFI | Rolled 2027 $10s to 15 2027 $20s; sold April $23s | +$450 (Credit) |
| ULCC | Sold 10 more April $5 calls | +$830 (Credit) |
| UUUU | Rolled 2027 $5s to 2028 $15s; sold 2028 $25s | +$2,250 (Credit) |
| VFC | Cashed out old spread; moved to 2028 $15/$25 spreads | -$125 (Debit) |
| Total Net Cash Flow | +$3,685 (Credit) |
And we have $91,389 (98%) upside potential NOT including our income potential so we should be in pretty good shape for the next year or so – as long as we find a few more nice upside positions – for which we have plenty of CASH!!! ready to deploy:
| Category | Positions Included | Combined Upside |
| New Adjustments | ET, SOFI, UUUU, VFC, SAIL, ULCC | $55,335 |
| Existing Positions | ARCC, B, EPD, F, HELE, HPQ, NVO, PATH, AAL, GEO, PR | $36,054 |
| Total Potential | $91,389 |
And we do have to do BETTER than this to hit our aggressive goal is it’s been 62% ANNUALLY so far so, next year, we should go from $93,196 to $150,977 and, by Feb 2028 we should be at $244,583 and Feb 2029 is $396,225 and $641,885 in Feb 2030 and $1,039,853 in Feb 2031 and the reason that’s behind the Rate Calculator is I didn’t count on the additional $700s each month – those add up and compound as well!
That’s where the extra few months are going to come from…
There you have it, the magic of slow, steady compounded investing. See how easy it is? See you at $1,000,000!


")
