
“This is your Captain – we are going down.
We are all going down, together.
And I said: Uh oh!
This is gonna be some day.
Standby.” – Laurie Anderson
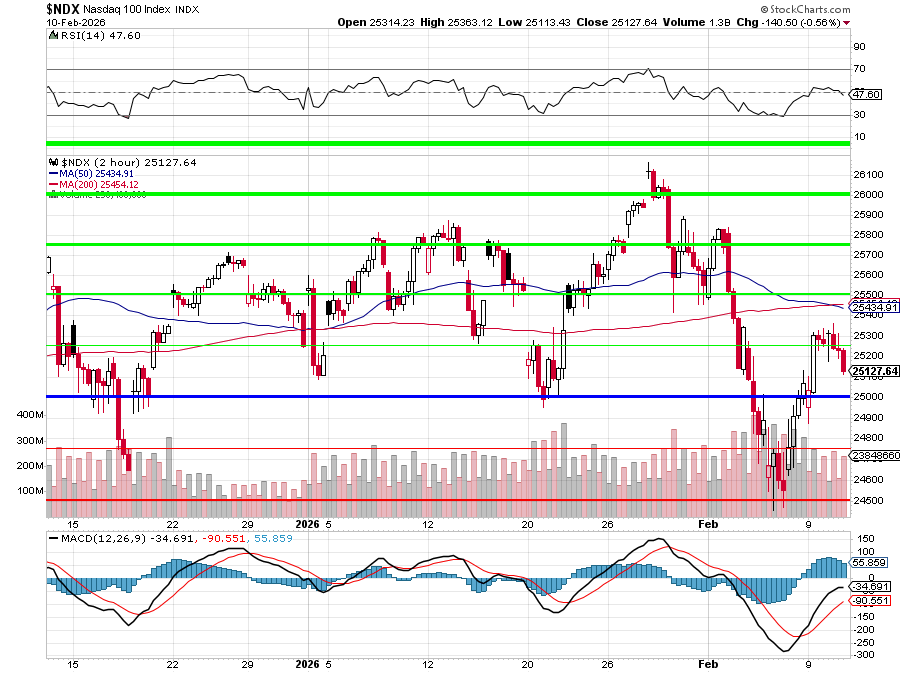
That’s a very ugly 2-hour chart! The 60-minute chart is just as ugly but the daily chart is not so bad BUT we hit 26,000 in October and that was the last hurrah for the great Nasdaq rally – so far – as the Shiller P/E Index hit 40 (now 40.36). And yes, we were valuing stock at 40 times earnings before – in early 2000, in fact – that ended well, didn’t it?
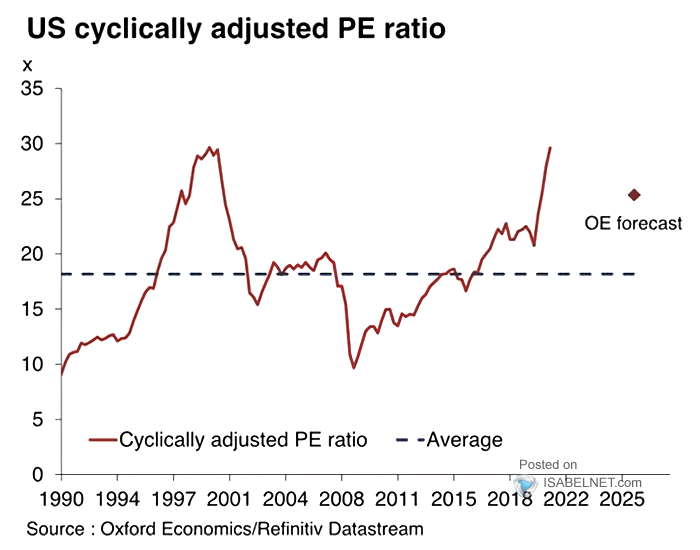
When I say “Shiller P/E hit 40,” I’m not talking about the usual P/E you see on CNBC. The Shiller P/E (also called CAPE – Cyclically Adjusted P/E) takes today’s index price and divides it by the average of the last 10 years of earnings, adjusted for inflation (imagine how ridiculous it would be NOT to adjust for inflation?). In other words, instead of asking “how expensive is the market versus one noisy year of profits,” it asks “How expensive is it versus a full decade of REAL earnings power?”
That makes it a lot harder to game with one boom year. Regular P/E will look “cheap” if margins are temporarily fat or if a single AI bubble year blows earnings out; CAPE smooths that by averaging ten years and inflation‑adjusting the past. Historically, that has made CAPE much better at flagging truly extreme overvaluations. The only times it’s been around 40+ were 1929, the Dot‑Com peak in 1998–2000 (all‑time high 44) and the current everything‑bubble. Today we’re back at 40.3 vs a long‑term average of about 17.
You simply CAN’T, economically, sustain this kind of price‑to‑earnings ratio because, above a certain point, the math of future returns stops working. At a Shiller P/E of 40, the market is implicitly saying: “I’m willing to pay 40 years of average, inflation‑adjusted earnings for this stream of cash flows.”
That translates into a real earnings yield of only 2.5% (1 ÷ 40) before any growth assumptions. For that to make sense long‑term, one of two impossible things has to happen:
-
-
- Earnings would have to grow far faster, for far longer, than they EVER have historically.
-
-
-
-
- Over 150+ years, real S&P earnings have grown around 1.5–2% per year; total real returns (including dividends) about 6–7%. Any higher than that and Inflation becomes an issue, which impacts margins and brings down earnings.
- At 40× CAPE, you’re implicitly betting on permanently higher growth and margins than any prior era in human history in an Economy that is already running into hard constraints (energy, chips, water, demographics).
-
-
2. Investors must forever accept much lower returns than history.
-
-
-
- With a 2.5% real earnings yield, EVEN IF GROWTH IS FANTASTIC , your expected long‑run real return collapses toward 3–4%, not the 6–7% that pension funds, endowments, and boomers’ retirement math are built on!
-
-

Historically, whenever we’ve pushed CAPE into the high‑30s/40s (1929, 1999/2000, 2021, 2025/6) – the system has resolved that tension the only way it can:
-
- Either earnings mean‑revert down (recession, margin compression)
- Or prices mean‑revert down (a long, ugly bear/sideways market)
- Or some combination of both – which drives very poor 10–15‑year forward returns
So when I say you CAN’T “Economically sustain” 40× CAPE, I mean:
-
- You can carry it for a while on cheap money, story stocks, and FOMO
- But you cannot compound 6–8% real for the next decade from here without either:
- rewriting the laws of earnings growth, or
- accepting that someone (pensions, savers, future retirees) is going to eat much lower returns than the models are assuming.
The past century of data says we won’t get that miracle – we get mean reversion. And let’s not forget: in the U.S., the bottom 60% of households hold almost no financial assets at all – no real savings, no retirement cushion, essentially no buffer. So when we say someone is going to eat the losses when 40× earnings comes back to earth, unless you’re in the top 1% of the asset pyramid, that ‘someone’ is YOU.
Labor data comes out shortly and Non-Farm Payrolls are likely to be weak (under 100,000) but let’s keep an eye on Hourly Earnings (0.3%) and the Average Workweek (34.2) as those indicators can alert us to shifting trends.
Meanwhile, THE ALIENS HAVE LANDED – or something because the FAA VERY SUDDENLY shut down the El Paso Airport for TEN (10) Days!!! They have CLOSED the Airspace and grounded ALL flights, locking down everyone in the region with, so far, NO explanation!
What else could it possibly be?
8:30 Update: Jobs were actually GOOD, with 130,000 jobs added in January vs 75,000 officially expected. As I said earlier, Hourly Earnings are important and they went UP to 0.4% from an anemic 0.1% in December and the Workweek went from 34.2 to 34.3 and 0.1 x 165M jobs is like adding another 165,000 jobs. That is good news – especially with all those layoff announcements we’ve heard!
I guess we can live with 40x earnings for another few weeks and, if we keep getting numbers like these – maybe this time IS different. AI in the workplace is the biggest boon to Corporate America since the Industrial Revolution and yes, it will displace tens of Millions of workers (not yet) and it will drive millions of businesses out of existence (not yet) but, keep in mind, we are discussing whether the S&P 500 can sustain it and the S&P 500, BY DEFINITION, is an index of our 500 BIGGEST Corporations – NOT an index of the “losers“ (who get dropped from the index).
So, should we bet that 500 companies will grow and prosper and consolidate their base and drive out competition until it is just them and their 10 humans (each) and millions of robots extracting every dime out of “users” who are, effectively, under house arrest in Trump’s Amerika? ABSOLUTELY!!!
You have a chance to bet on the Top 1% wiping out the rest of society and you already know the game is rigged – might as well make some money off it, right?


