
 What war?
Despite all the market mayhem, our $700/Month Portfolio gained $8,190 (8.7%) since last month’s review and the only change we made in between was to buy more HPQ and a new position on OWL. Other than that, this is just the mathematical grind of our “Be the House – NOT the Gambler!” strategy playing out in a small (not so small anymore), no-margin portfolio.
For those who are new – here’s me discussing the strategy with Forbes.
The S&P was at 6,976 on Feb 3rd and now we’re at 6,795 so down 181 points (2.5% on the nose!) and part of the reason we held up so well is our SQQQ hedge went from net $6,092 to net $7,550 (+$1,458) which, you will note, is TWO MONTHS worth of deposits!
And, of course, we did deposit our monthly $700 but the rest ($6,032) was pure profit on what are just $58,611 worth of positions (10.2%). We have $42,775 (42%) worth of CASH!!! and I wanted to raise more but, when I asked Boaty to look over the positions given the war and Q4 results, he said:
🚢 Quick status table
Position by Position Color Commentary:
-
-
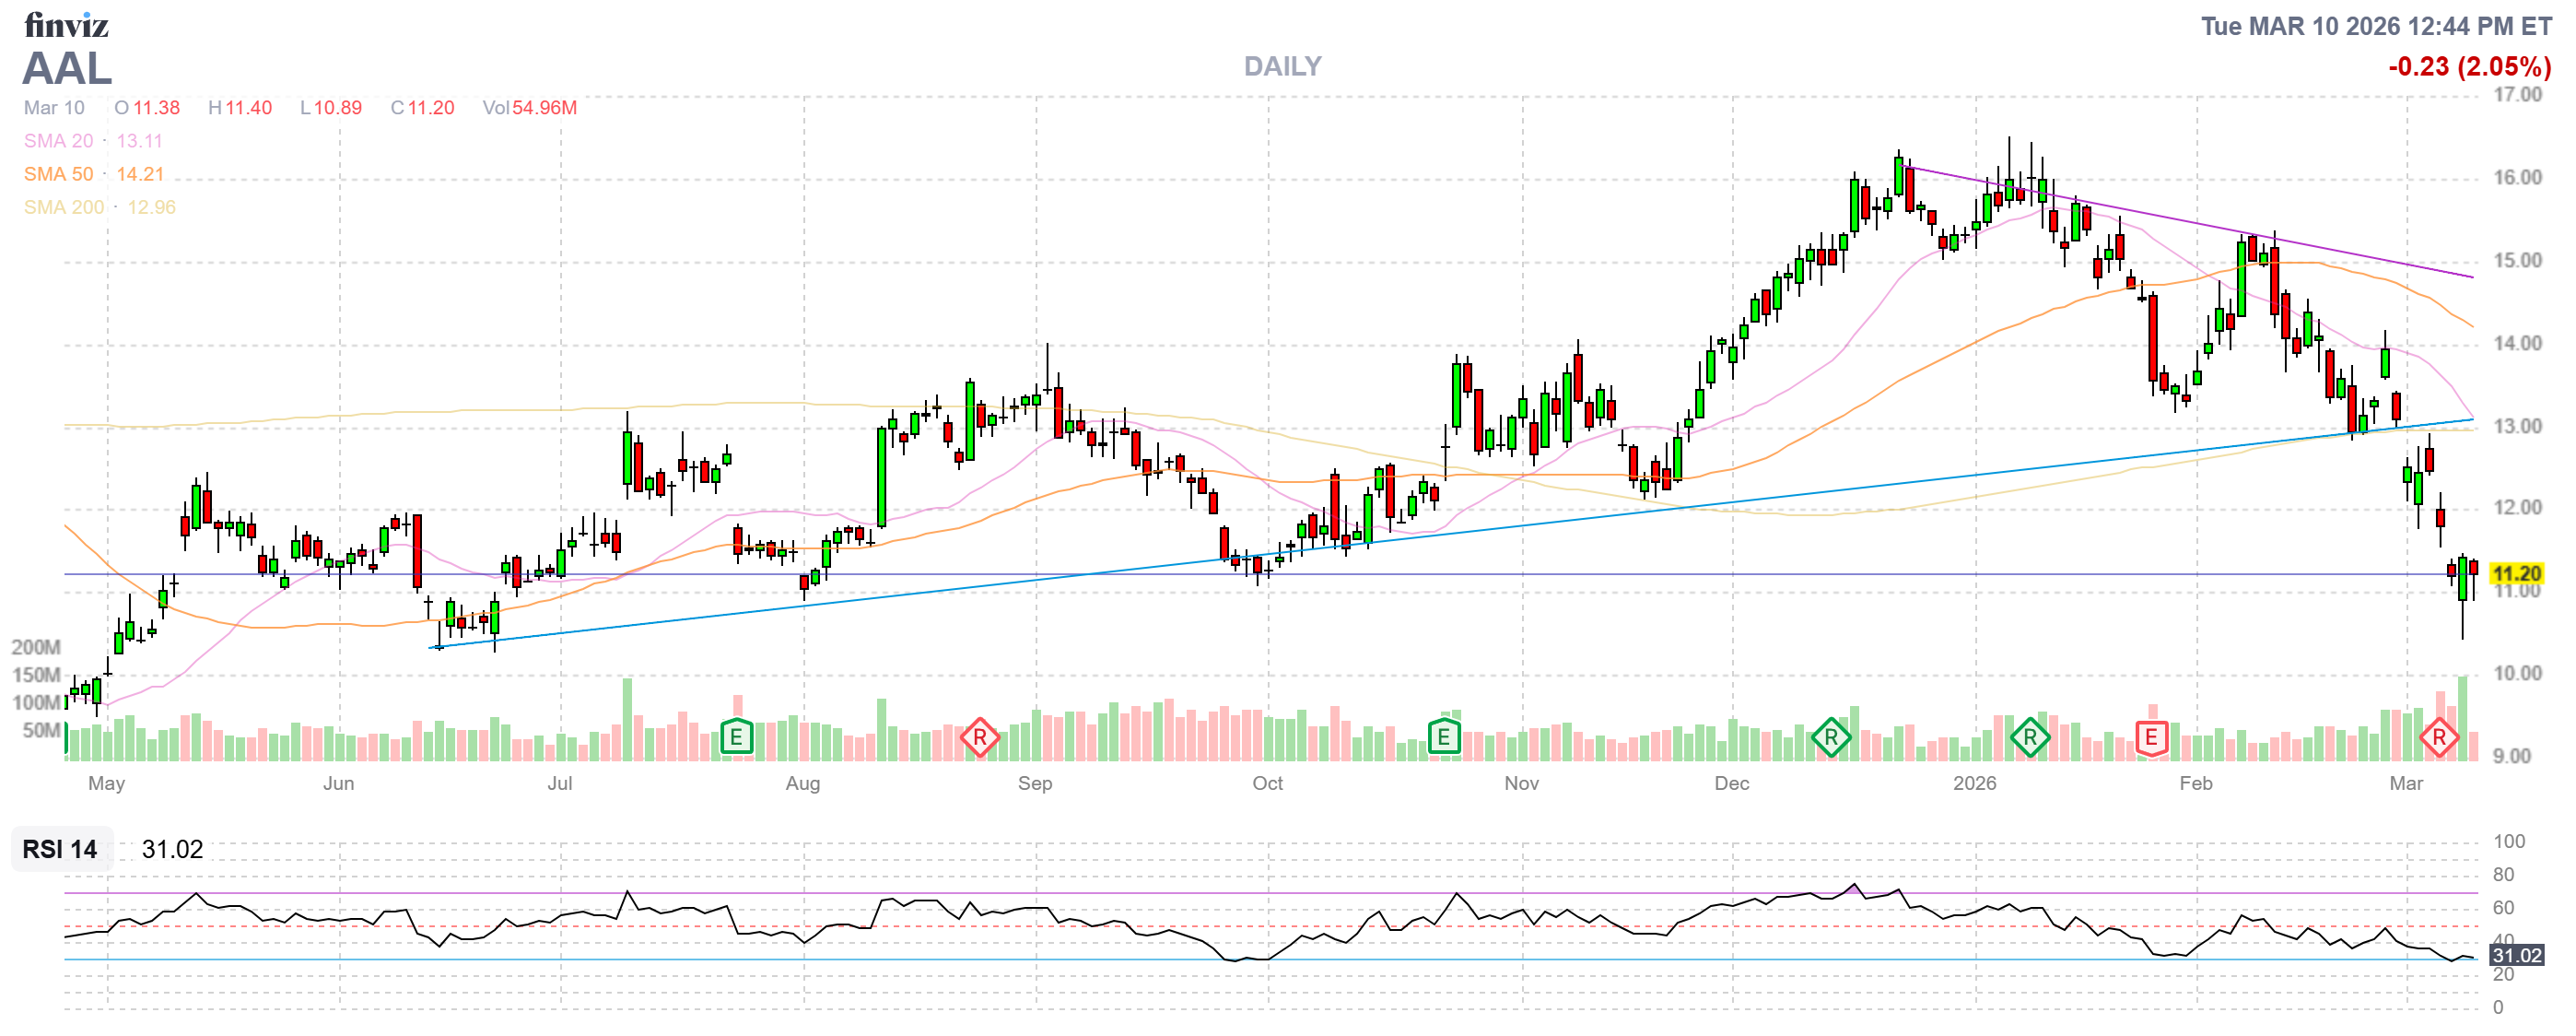
AAL – Keep
Still a very cheap way to be long normalized travel; the 2028 vertical gives you loads of time for capacity and fares to normalize after the current oil shock. No reason to tinker unless AAL dramatically overruns your spread. -
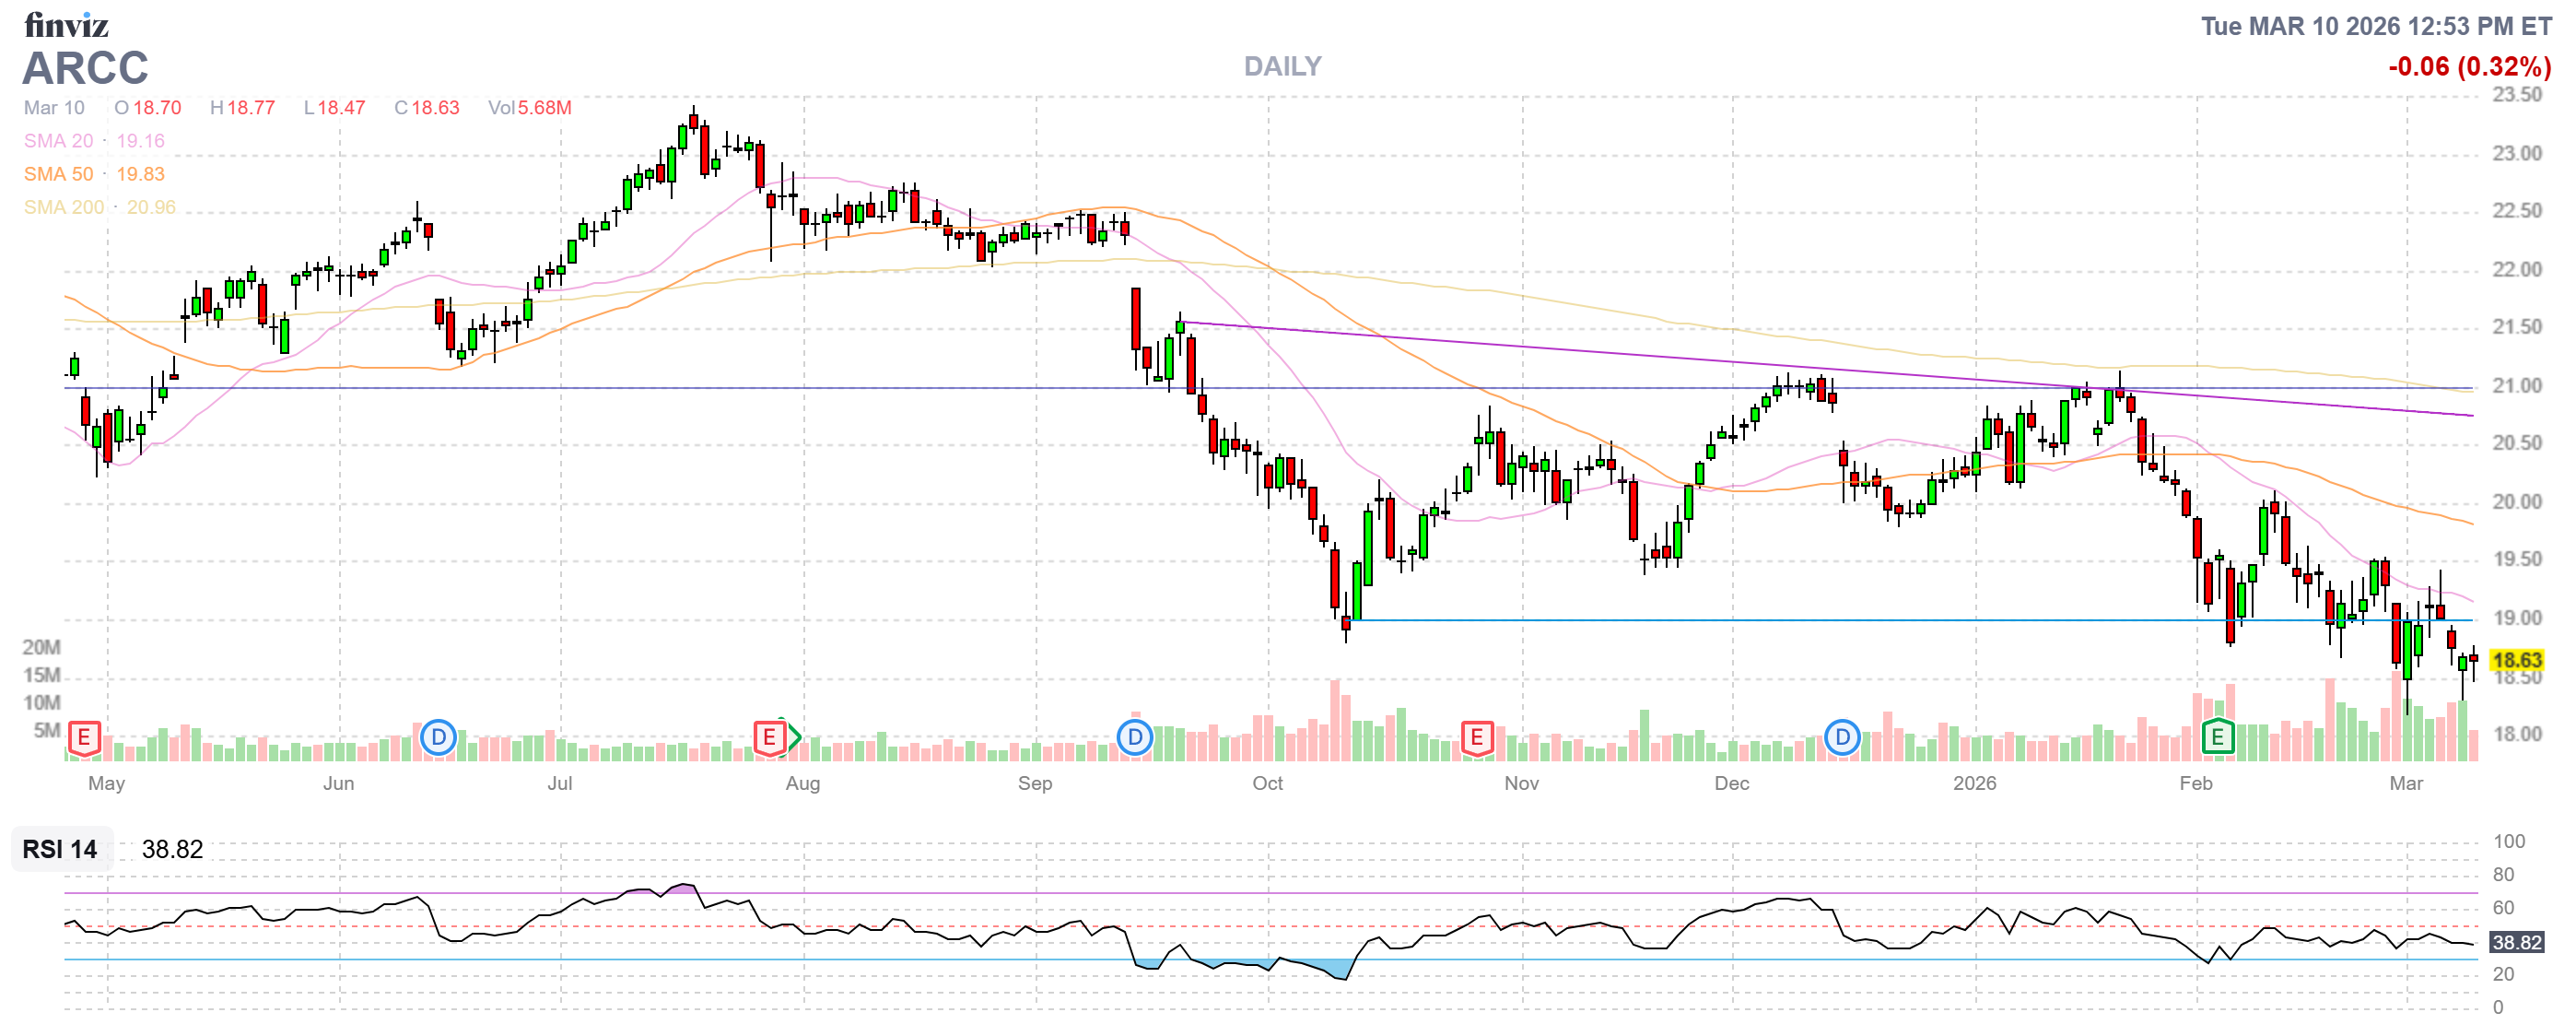
ARCC – Keep, nibble on fear
High‑quality BDC, diversified loans, and still an attractive yield against long‑term rates. In a choppy, higher‑for‑longer environment, ARCC’s income profile is exactly what you want anchoring a small portfolio. -
B (Barrick) – Keep
You’re already nicely ahead and well inside your 2028 spread. Let time premium decay; no need to over‑optimize a working trade. -
EPD – Keep
Core midstream income; energy volatility actually underscores why you own boring toll‑takers. Great place to sit while the macro sorts itself out. -
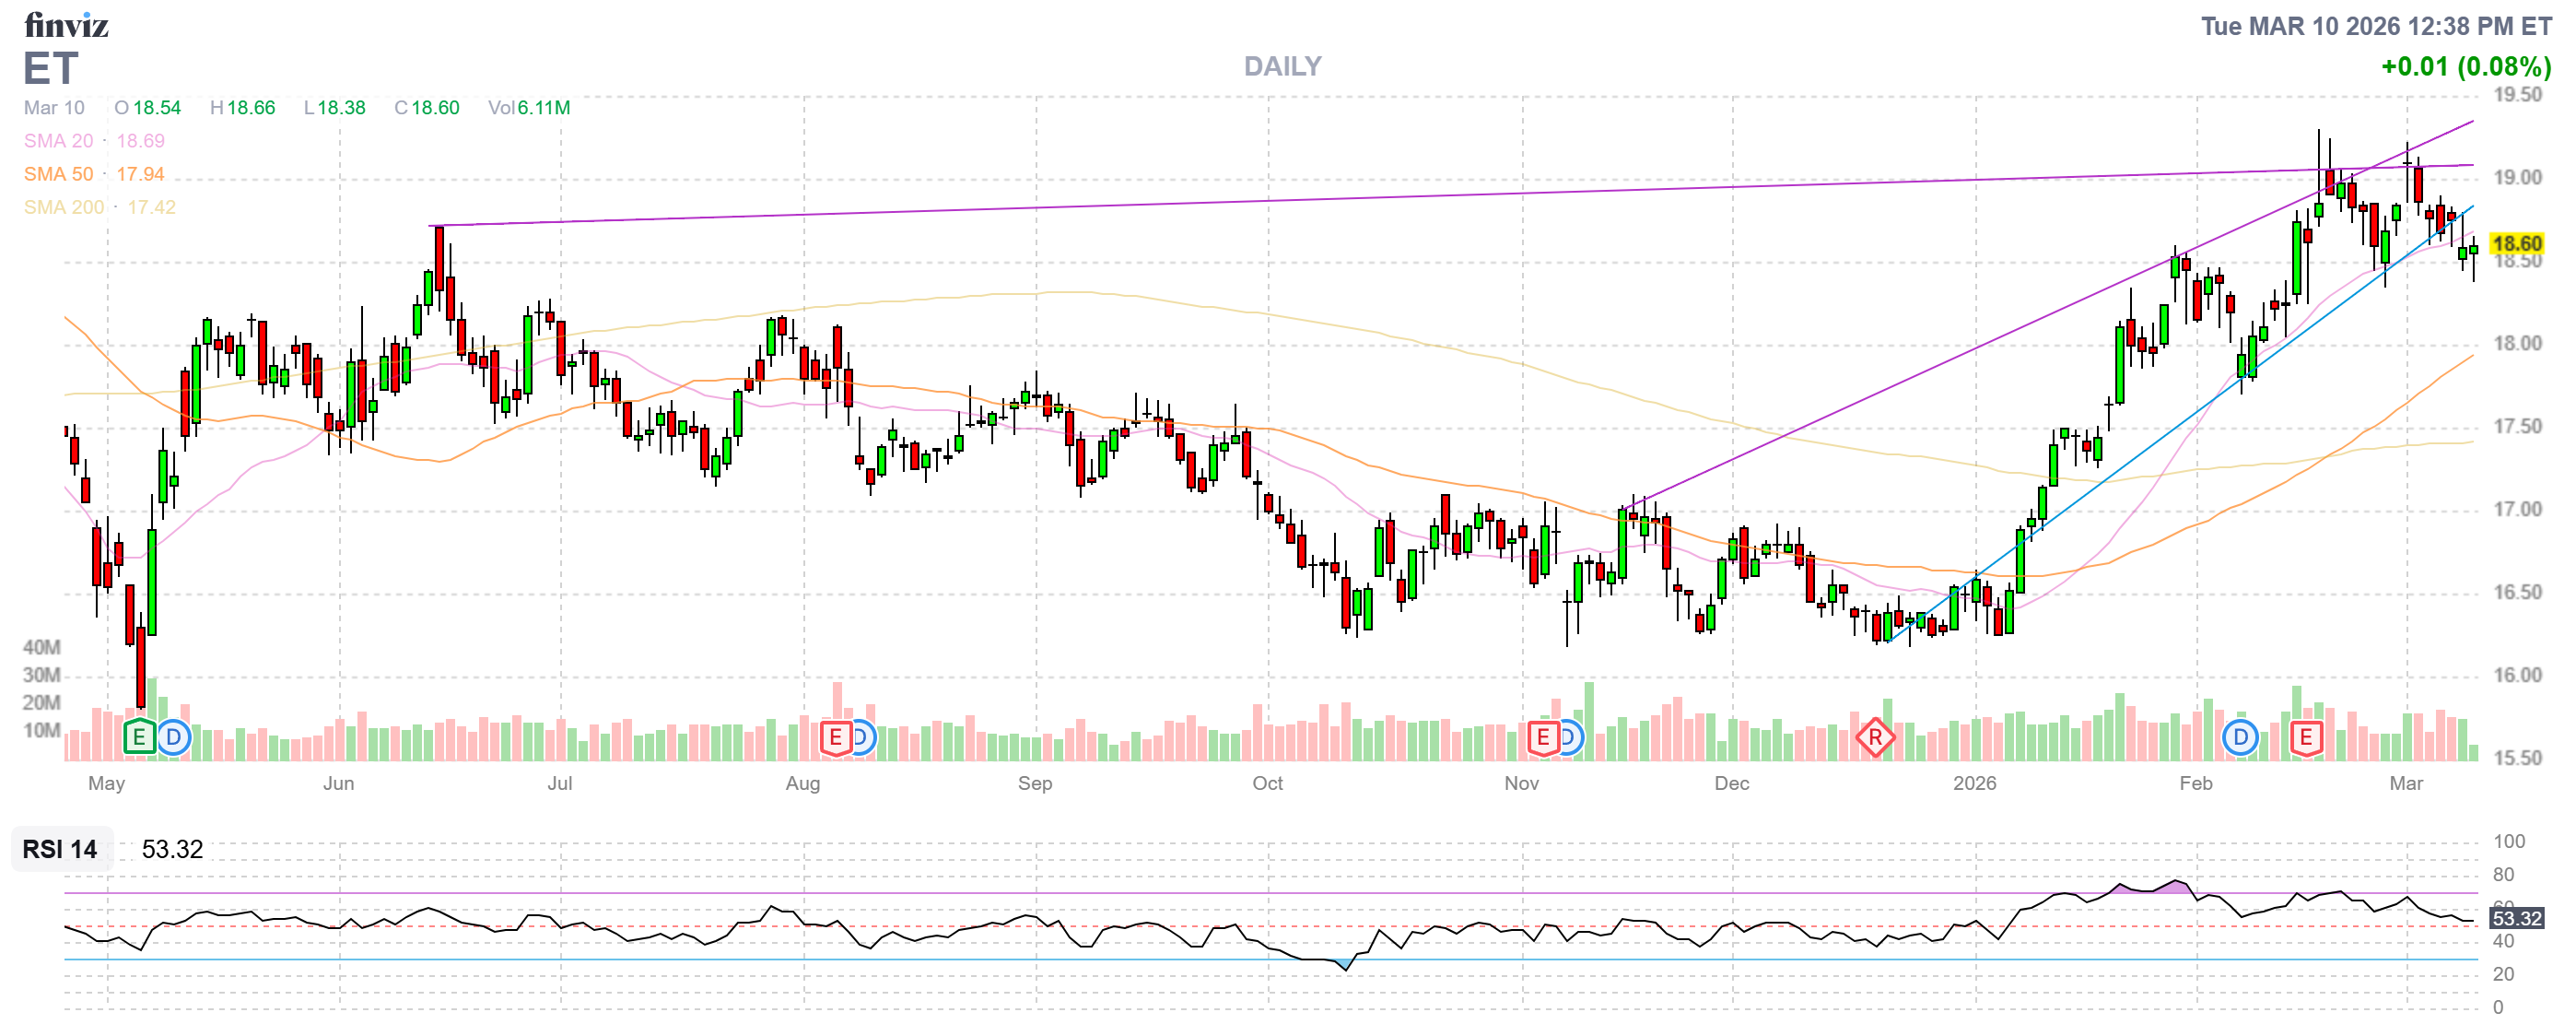
ET – Keep, add only on proper pullbacks
Same story as EPD: strong cash flows, de‑leveraging, and still not fully re‑rated. If panic gives you a real discount, this is one I’d happily build. -
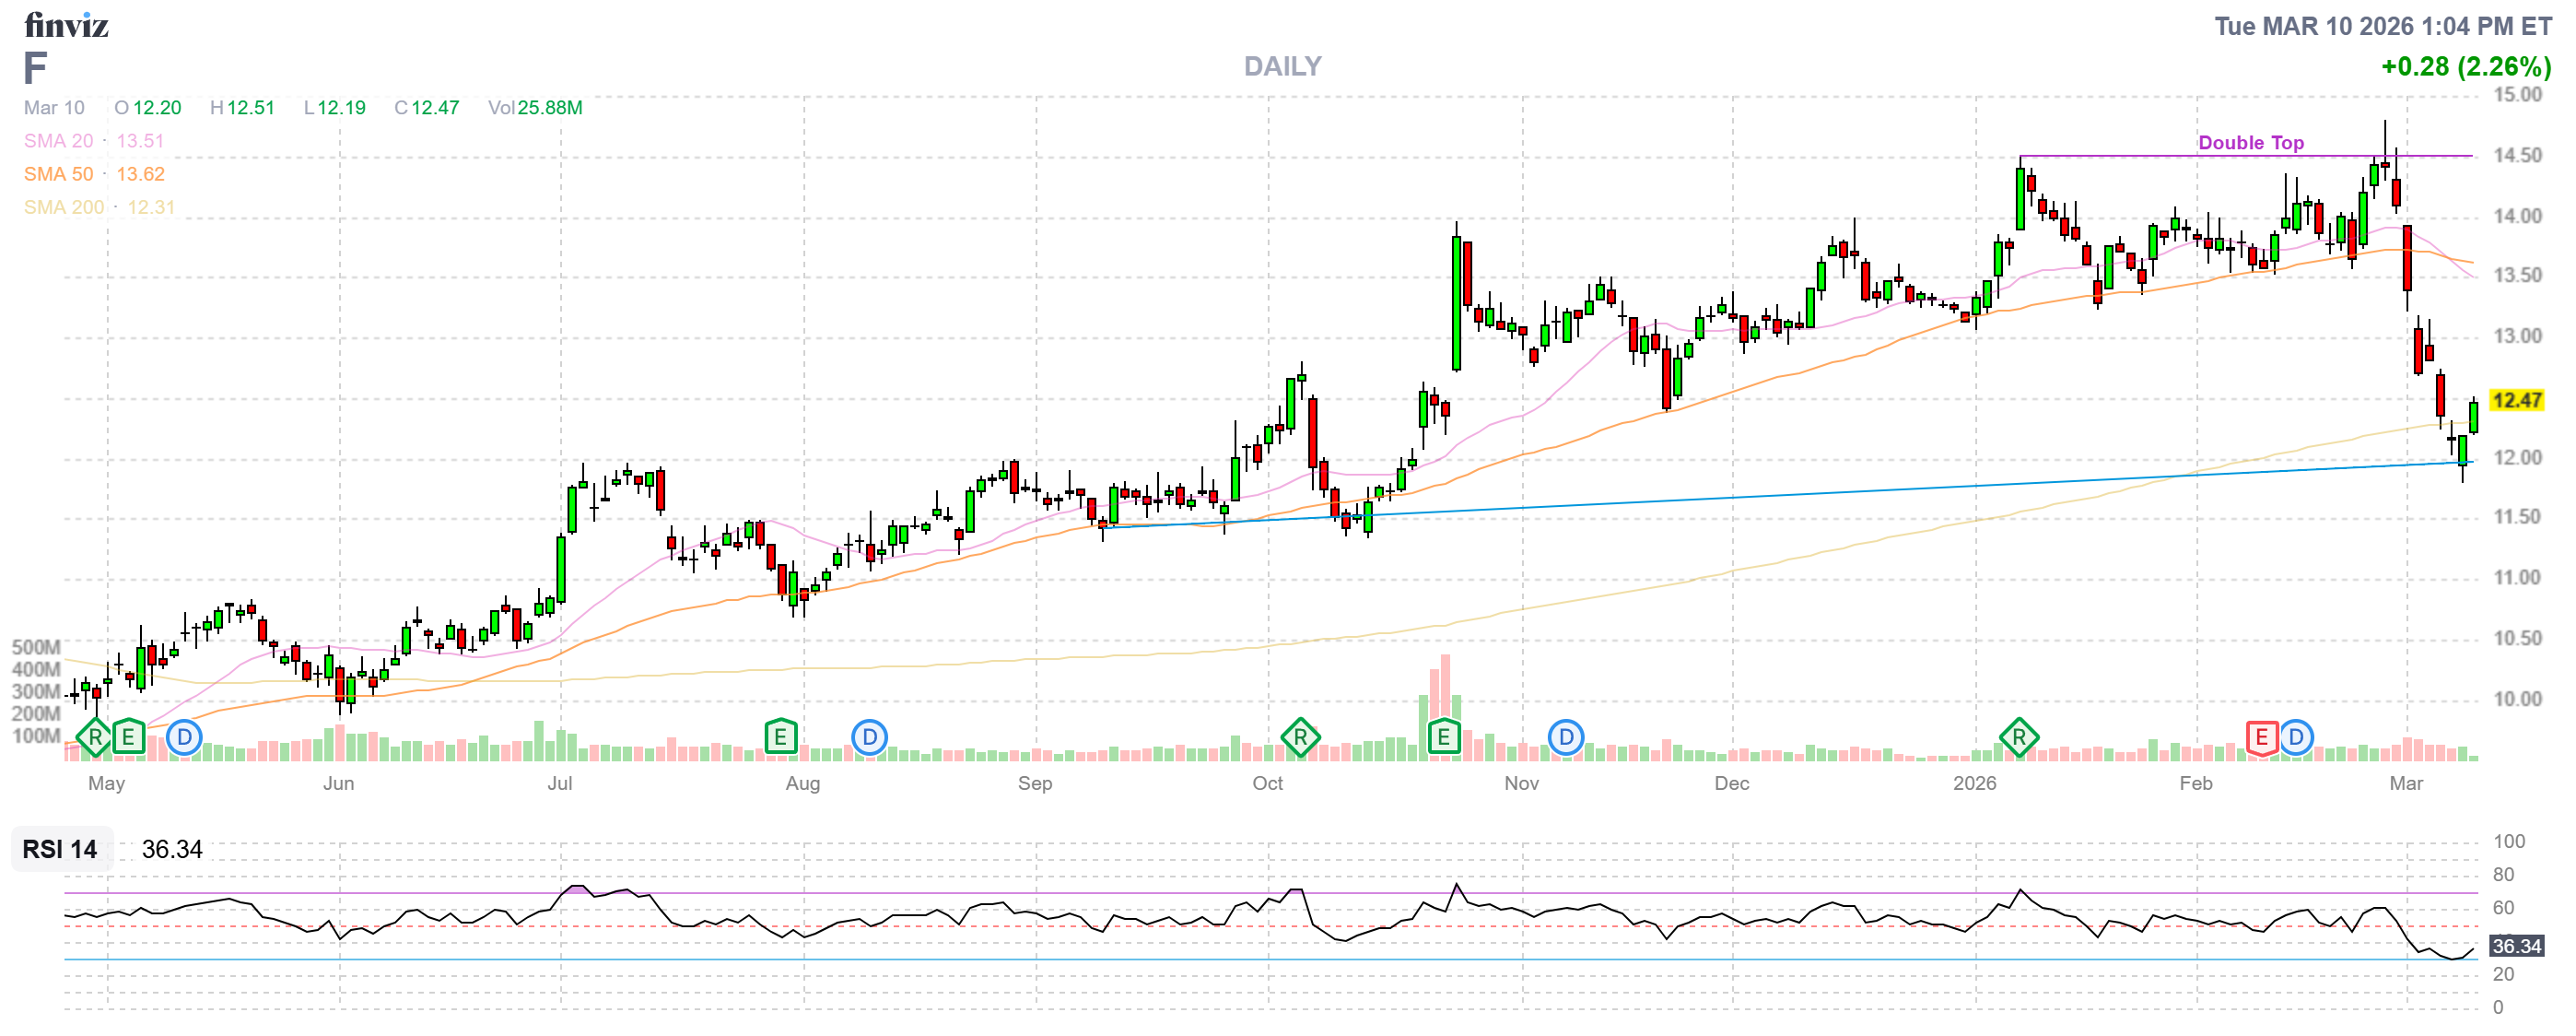
F – Keep
Cyclical, but your strikes are conservative and 2028 gives a full cycle to digest EV capex, labor, and rates. Nothing broken; let it play. -
GEO – Keep, eyes open
It’s a policy‑sensitive name; that’s why we sized it small in the first place. As long as the spread still has ample upside vs. cost and the political backdrop isn’t outright hostile, it’s worth giving time. -
HELE – Keep, but don’t oversize
Classic PSW “boring turnaround” attempt. Slight red is fine; only becomes a problem if you’ve accidentally let it grow beyond a sensible allocation. -
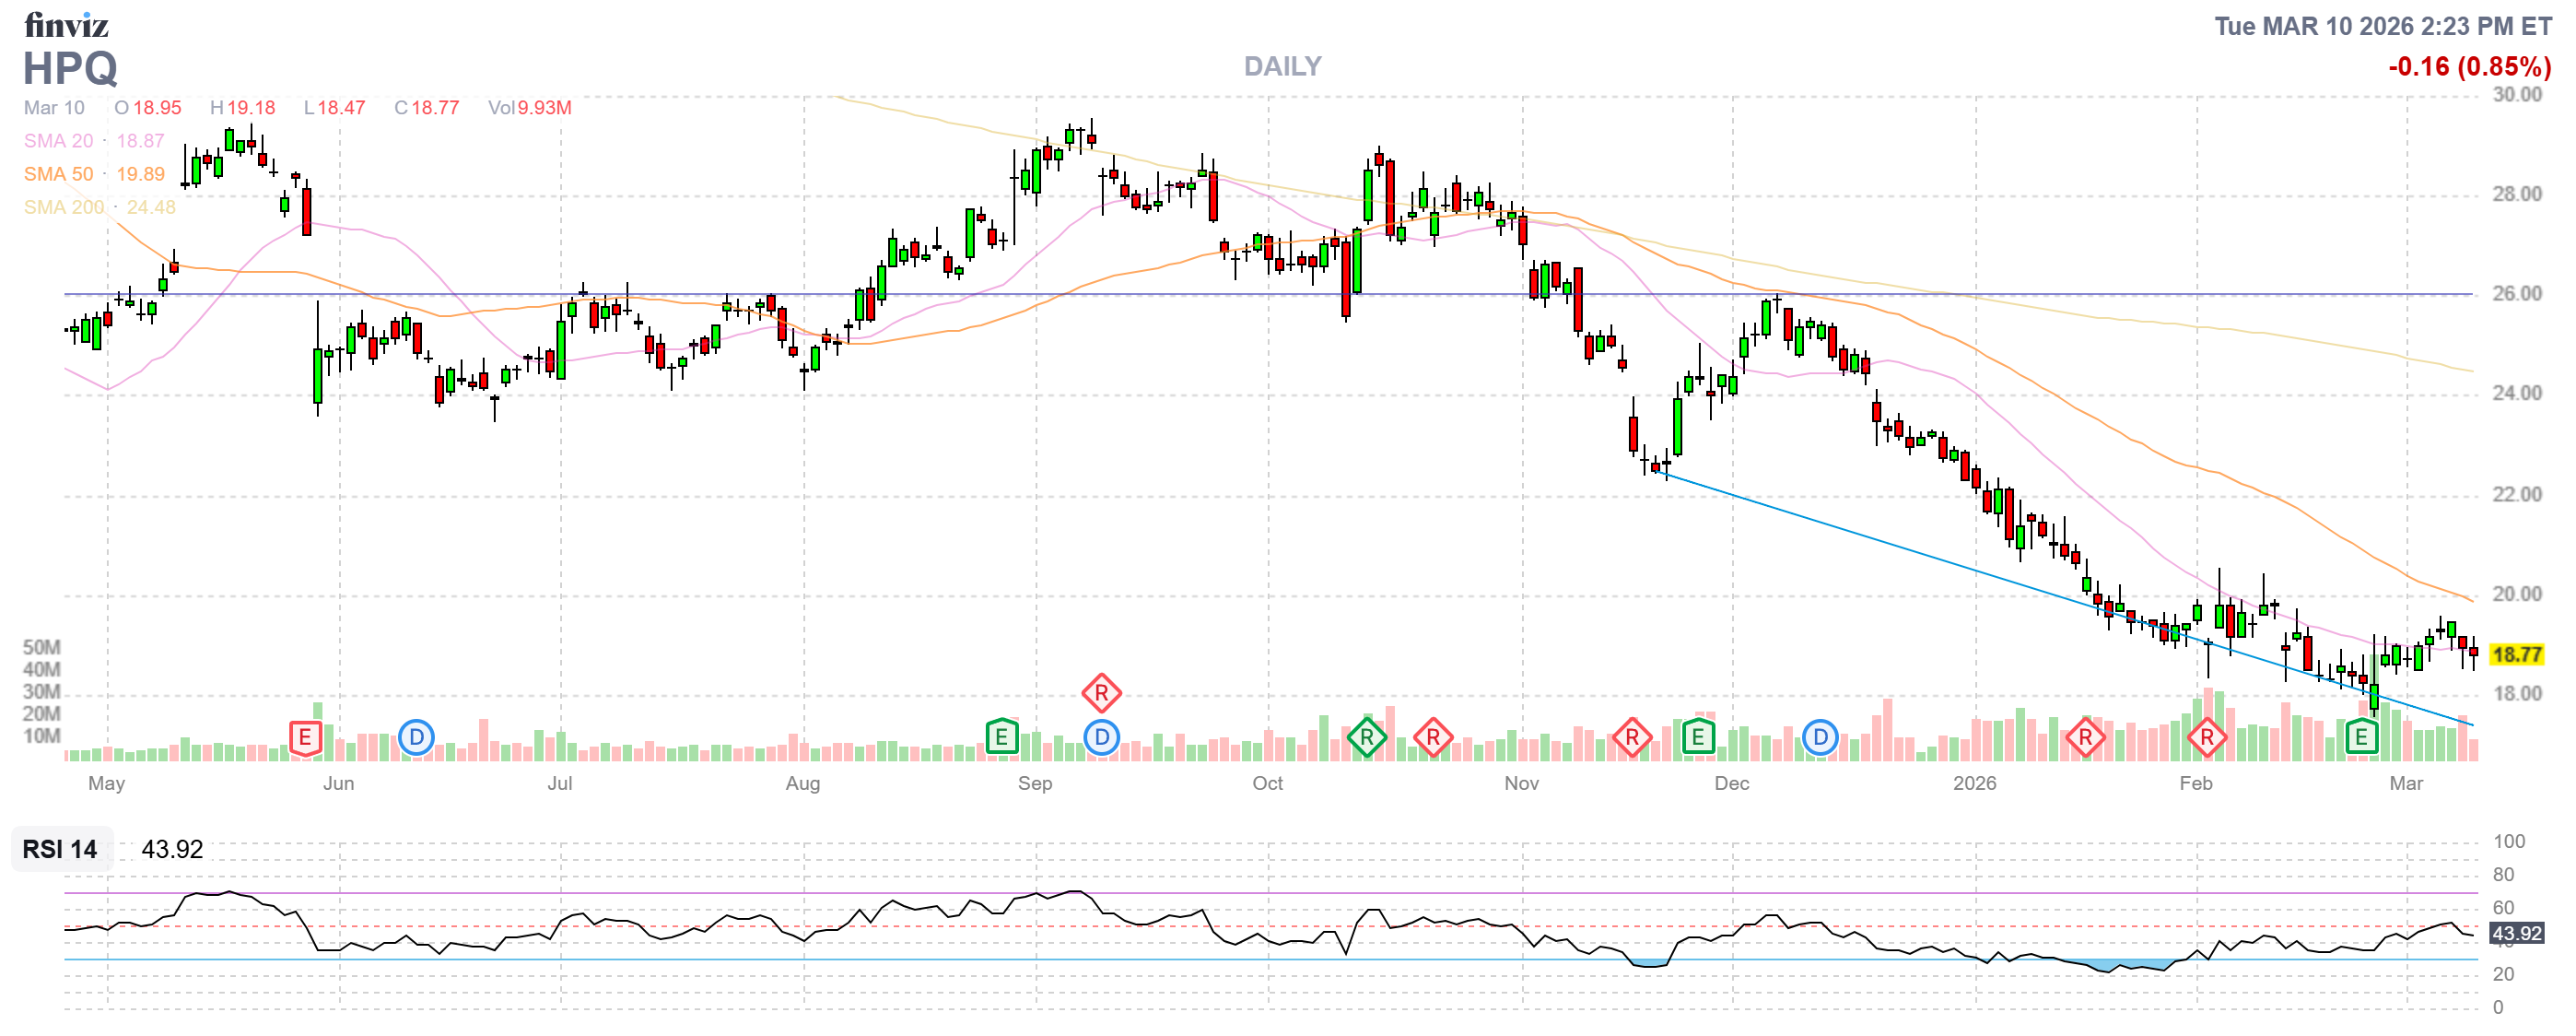
HPQ – Keep / consider adding if it gets really silly
Still a cheap cash machine with buybacks and modest growth; not an AI bubble name. In a world of stretched multiples, I’d be happy holding HPQ risk into 2028. -
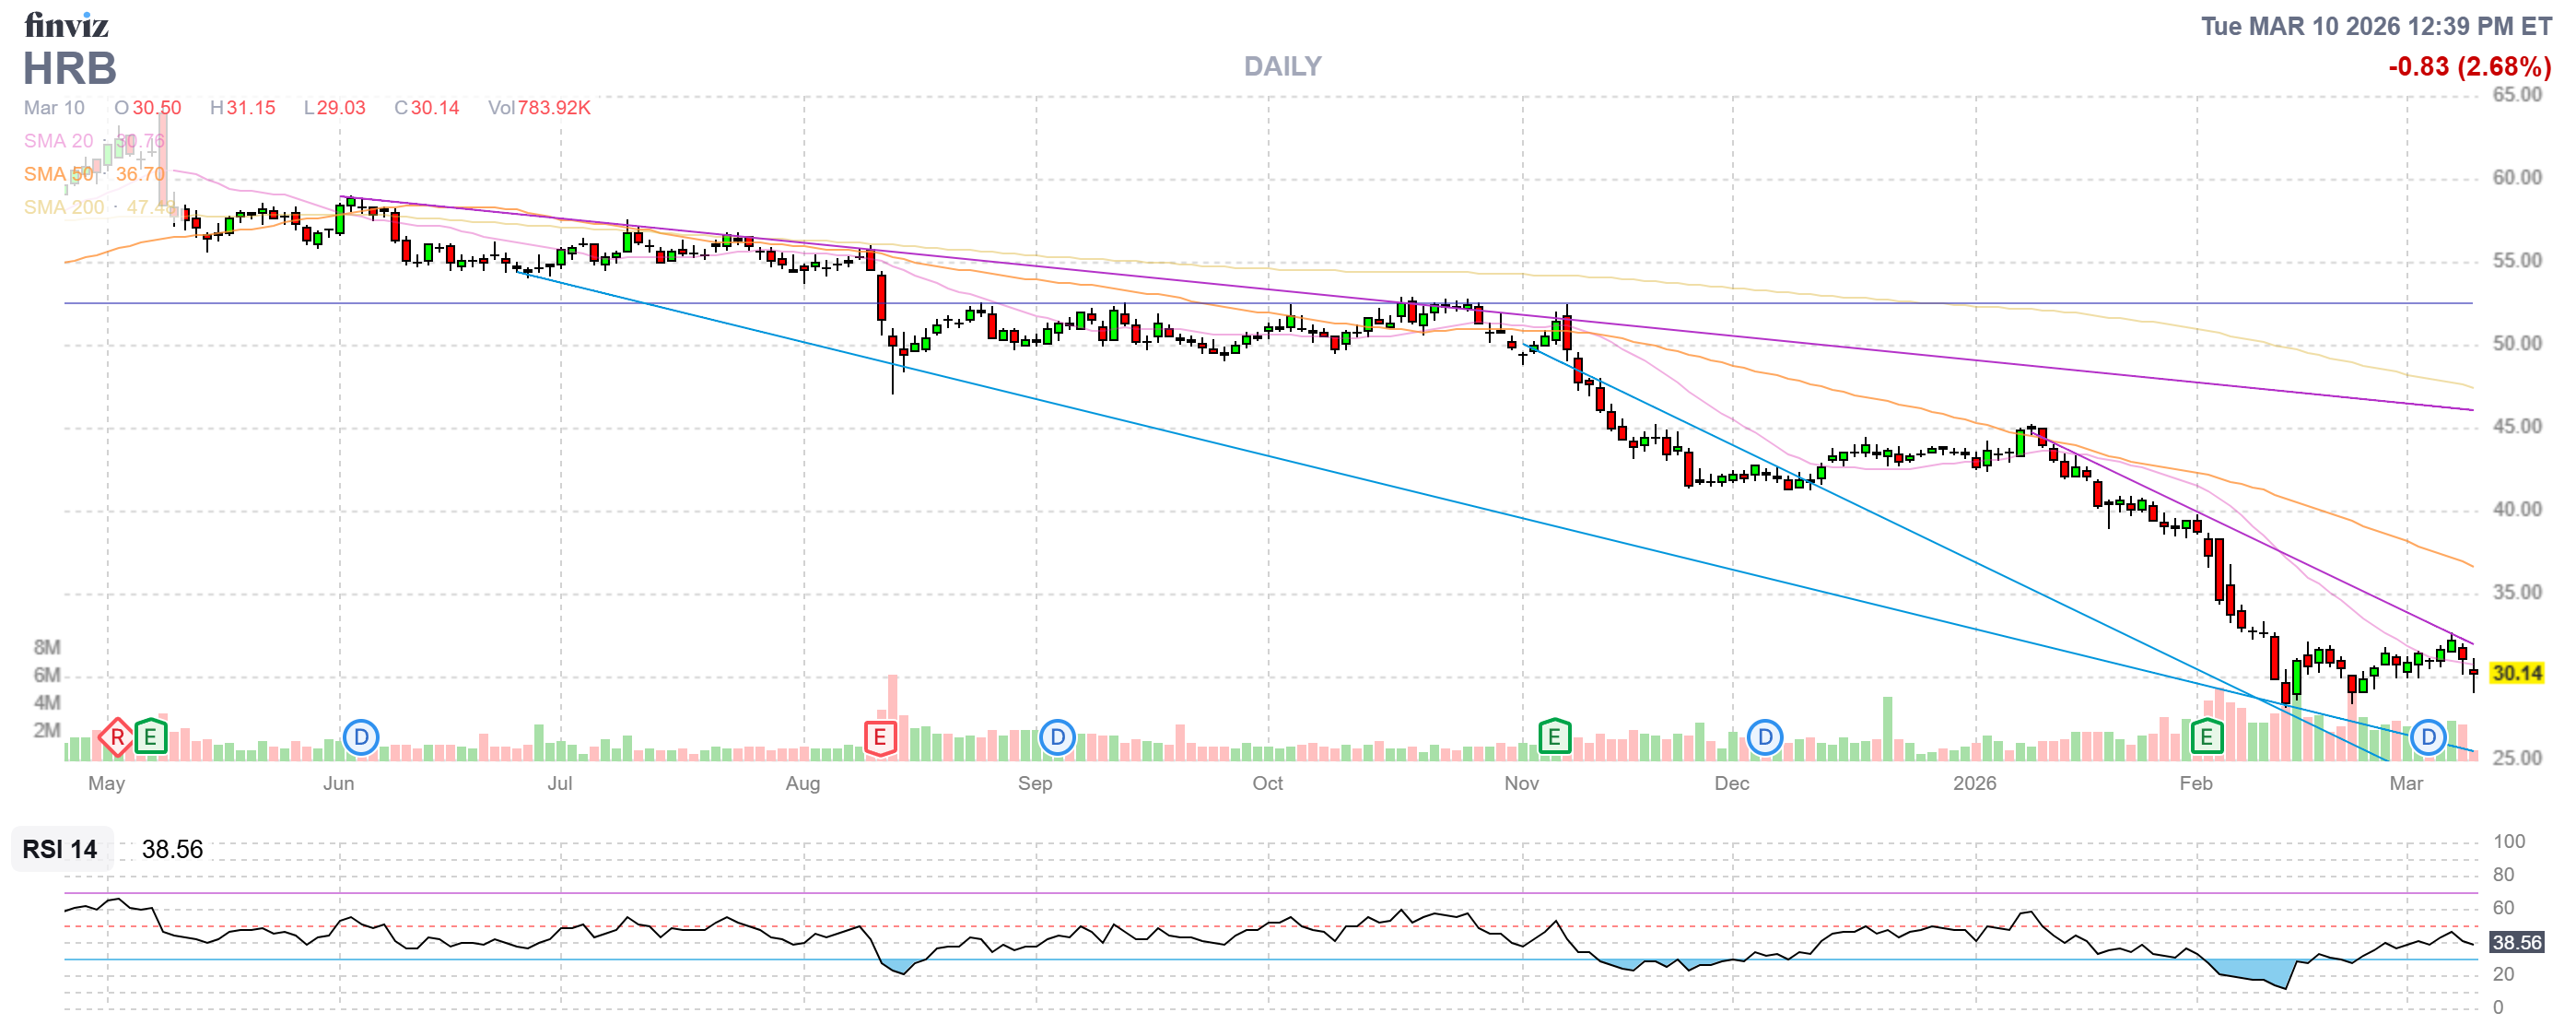
HRB – Work the salvage, don’t capitulate
This is the exact kind of trade you walked through in the YouTube “$700/Month” case studies: a high‑confidence, fundamentally intact business that got away from you short‑term. Tax prep is sticky; the main lesson is to adjust and roll intelligently, not to dump at max pain.[youtube] -
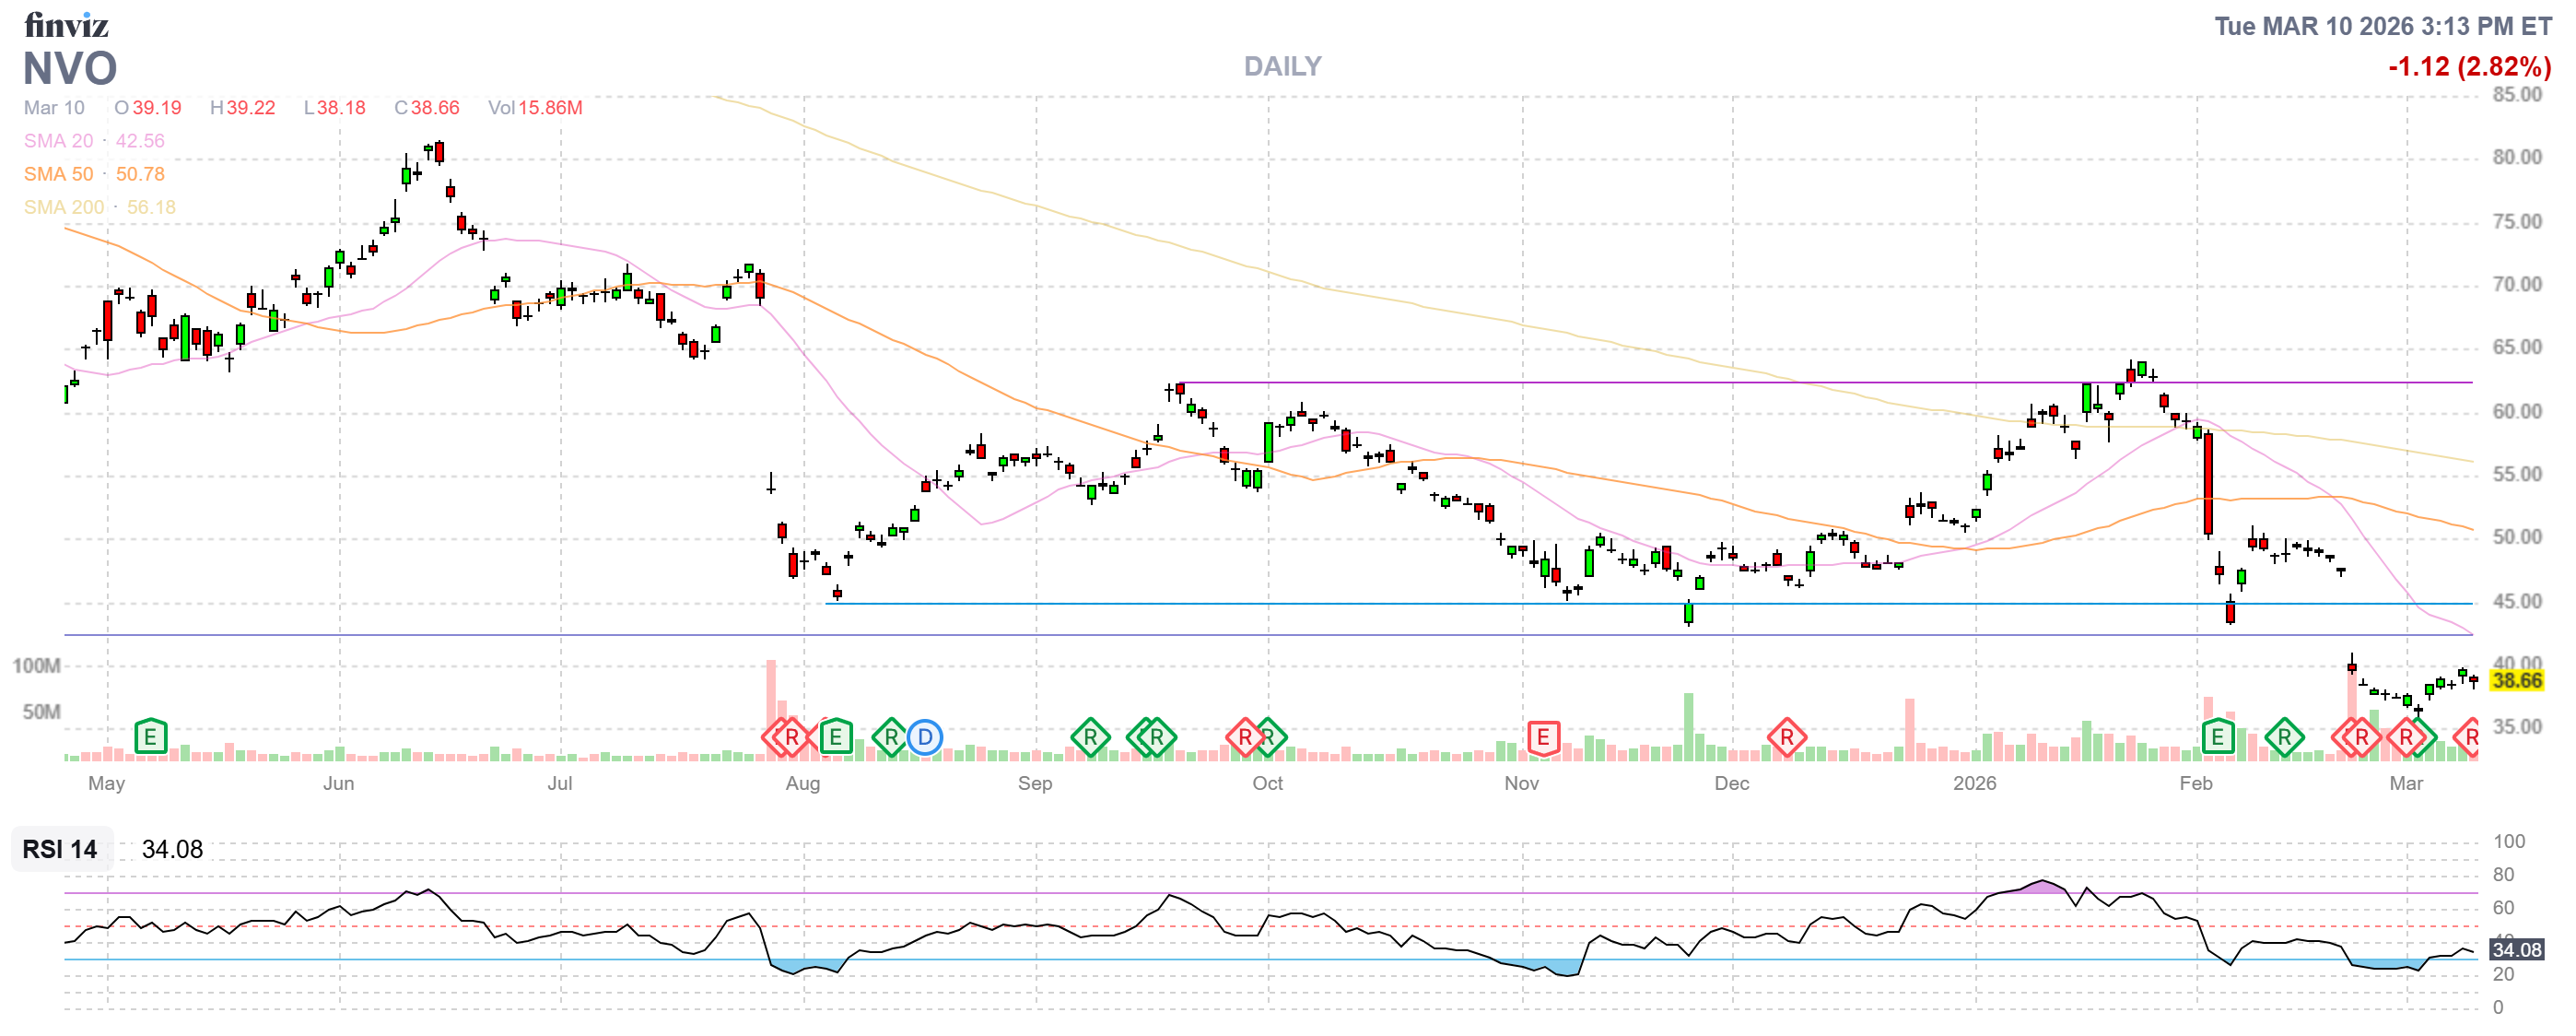
NVO – Keep
GLP‑1 is a structural, decade‑scale theme and NVO is a flagship; the 2027 $55/70 spread is a value‑seeking way to stay in a name that screens “expensive” on simple PE. Volatility around drug headlines is just noise. -
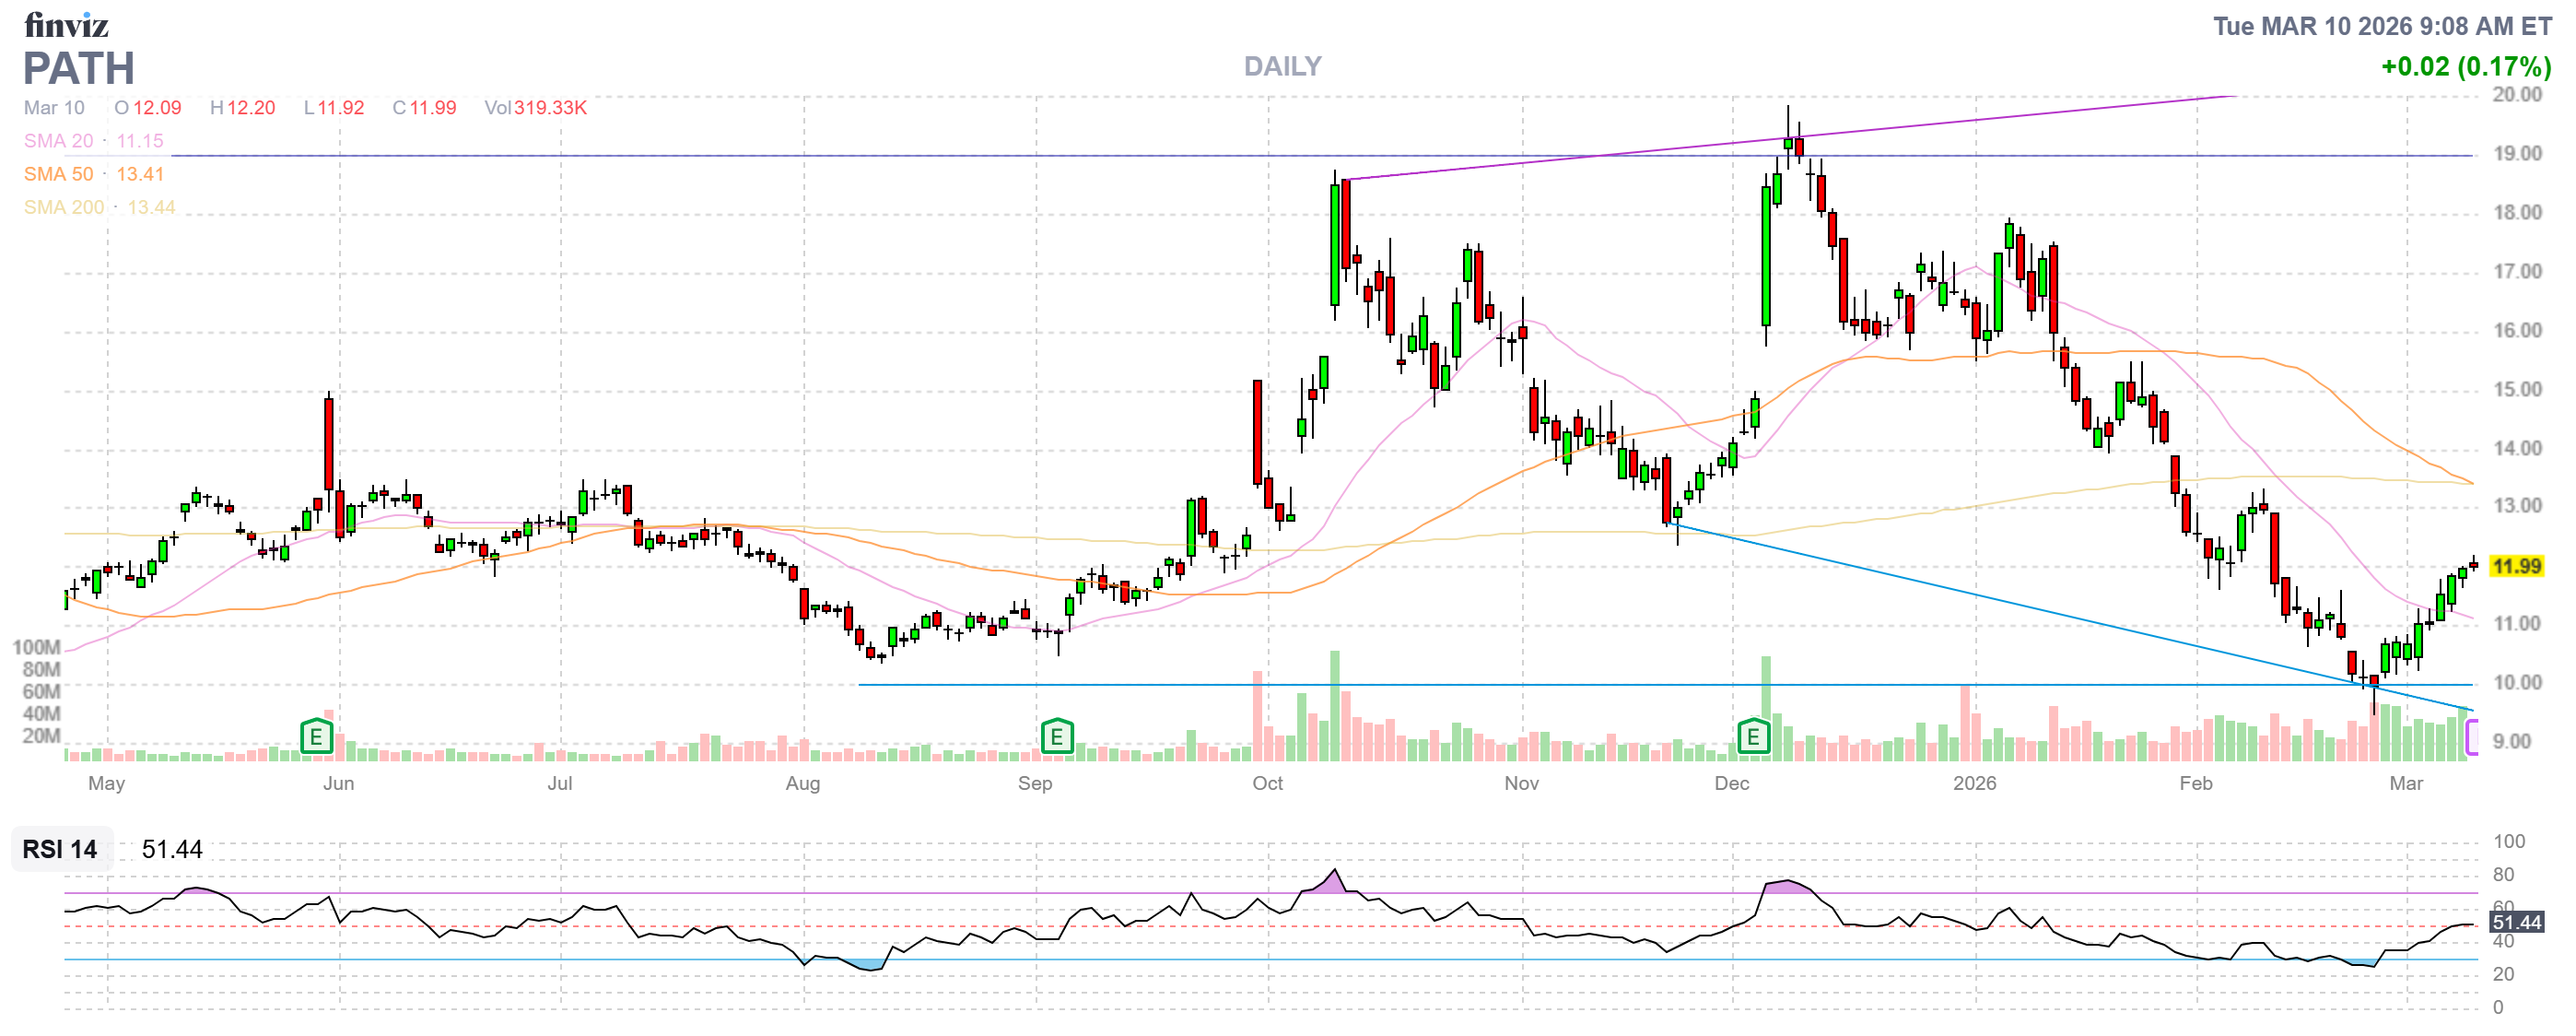
PATH – Keep (spec bucket)
Automation and AI‑driven productivity remain core structural trends. PATH is volatile and sentiment‑driven, but the 2027 tenor gives you time for execution to show up. -
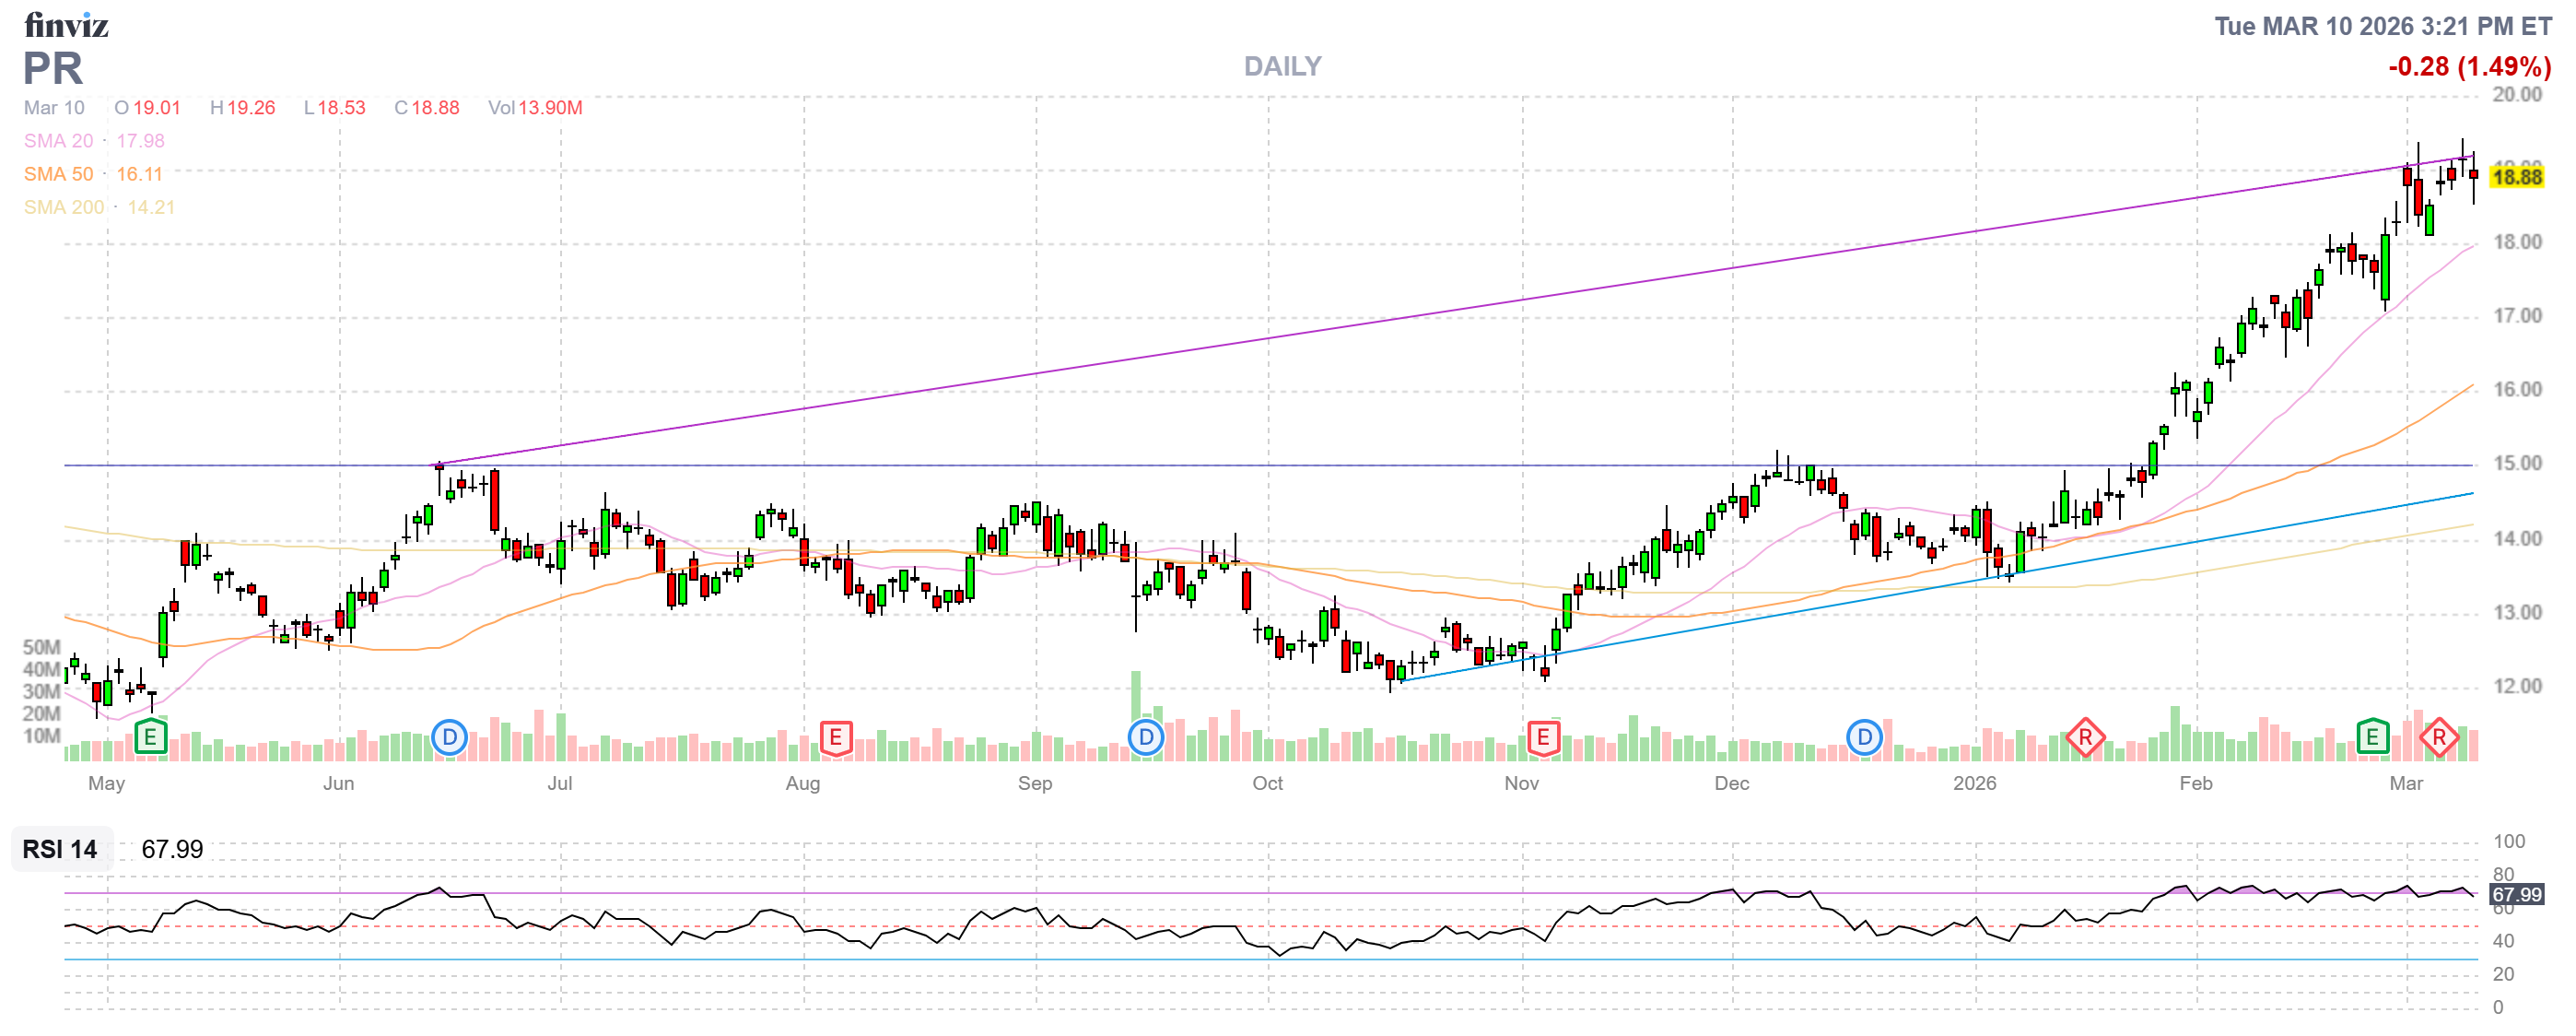
PR – Keep
Simple, leveraged energy exposure with a still‑supportive oil and gas environment. As long as balance sheet and hedging look sane, it fits. -
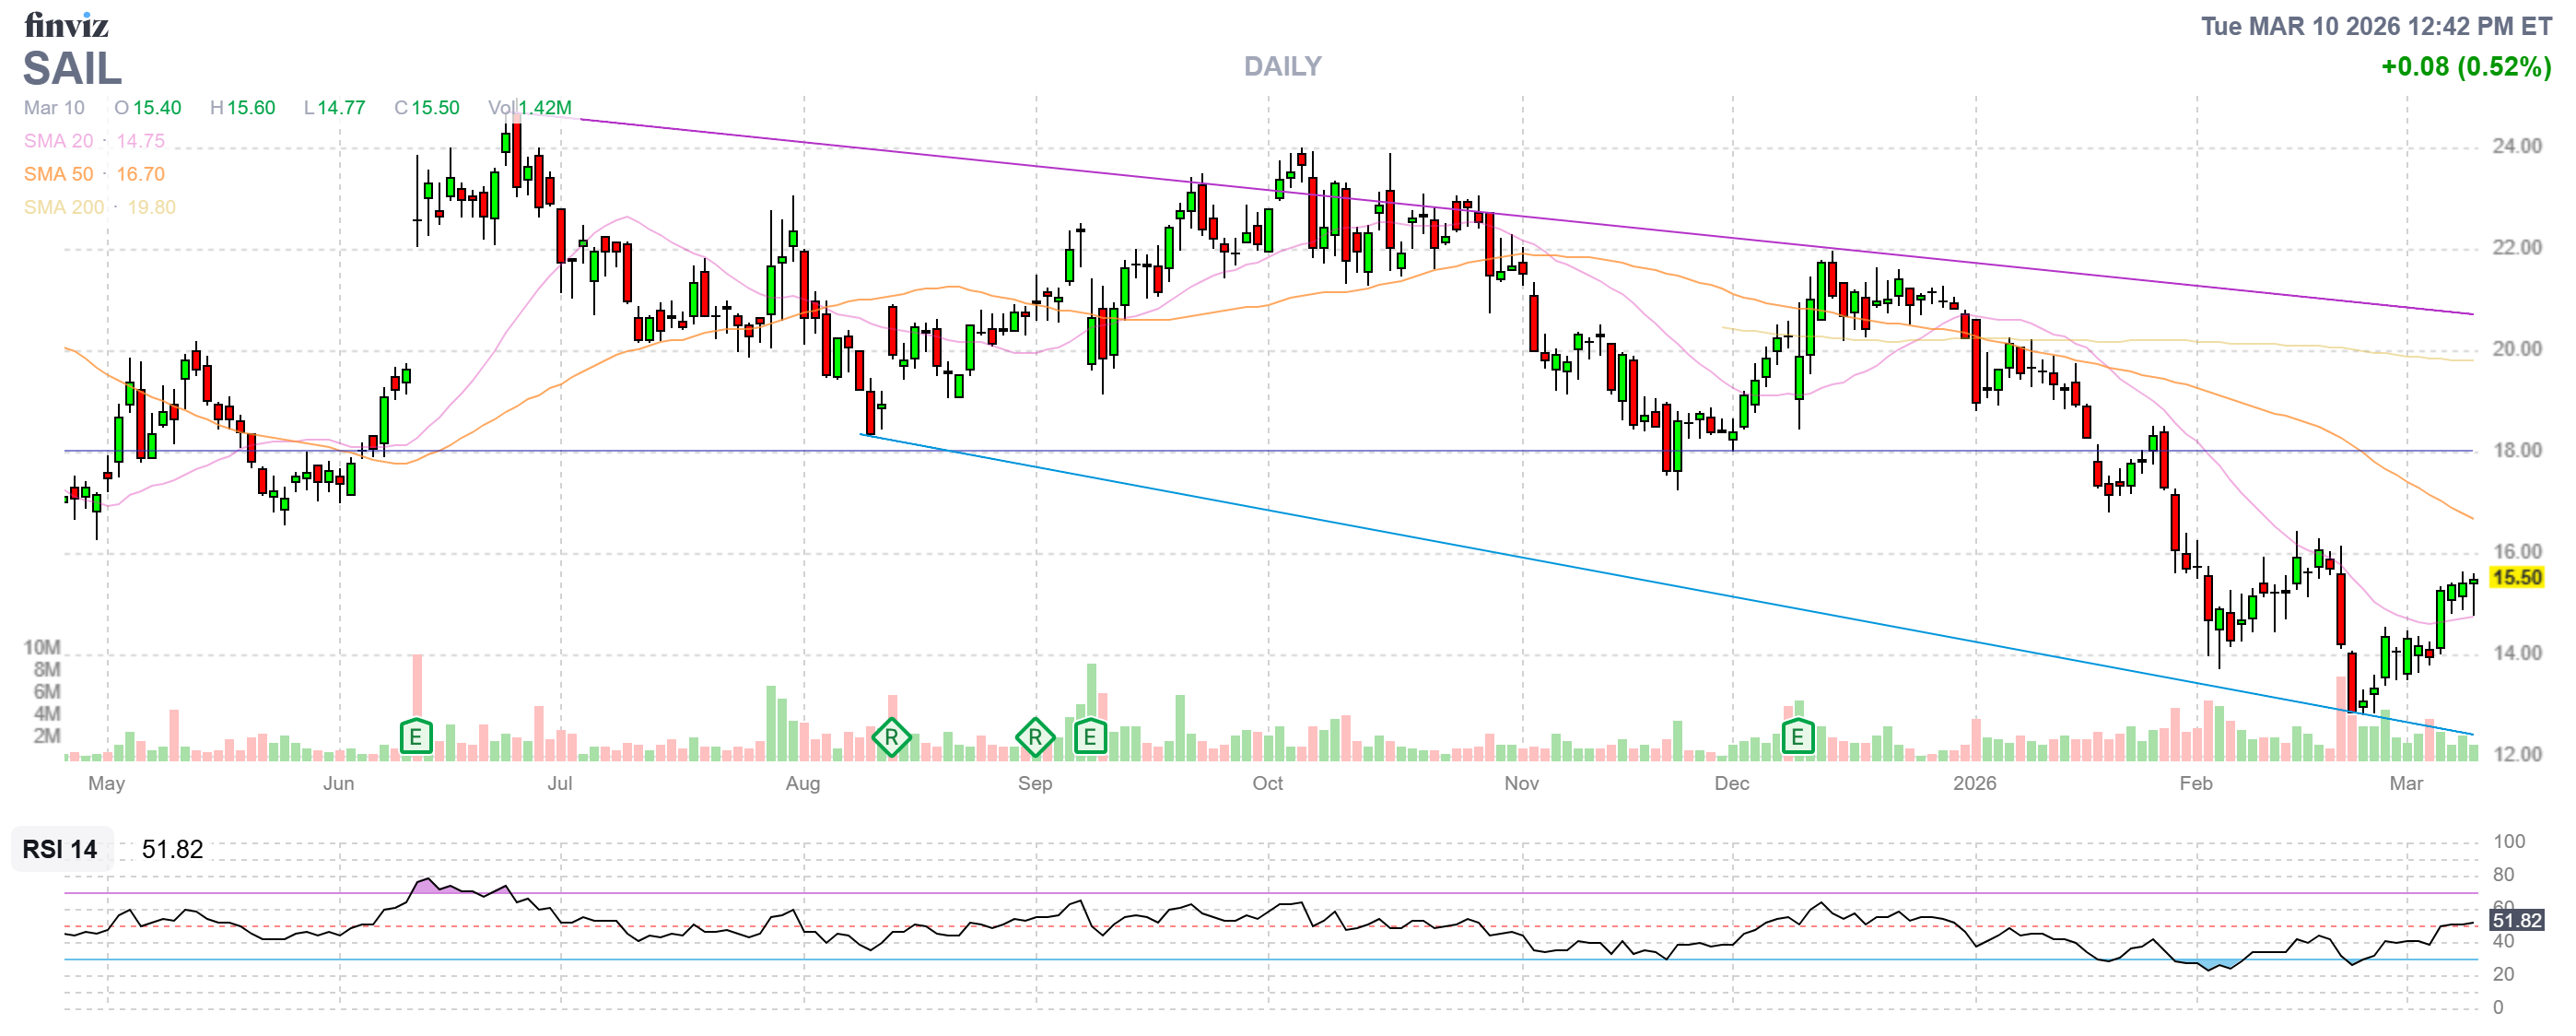
SAIL – Take something off, leave something on
You’ve got a big win; the cyber theme is still strong, but Freakonomics‑style: when you’re well into the profit zone, incentives shift toward banking some. I’d trim or partially close and keep a core to ride.[youtube] -
SOFI – Keep
Still an execution story but with real user growth and expanding product set. Rate volatility hurts near term; long dated spreads let you look through that. -
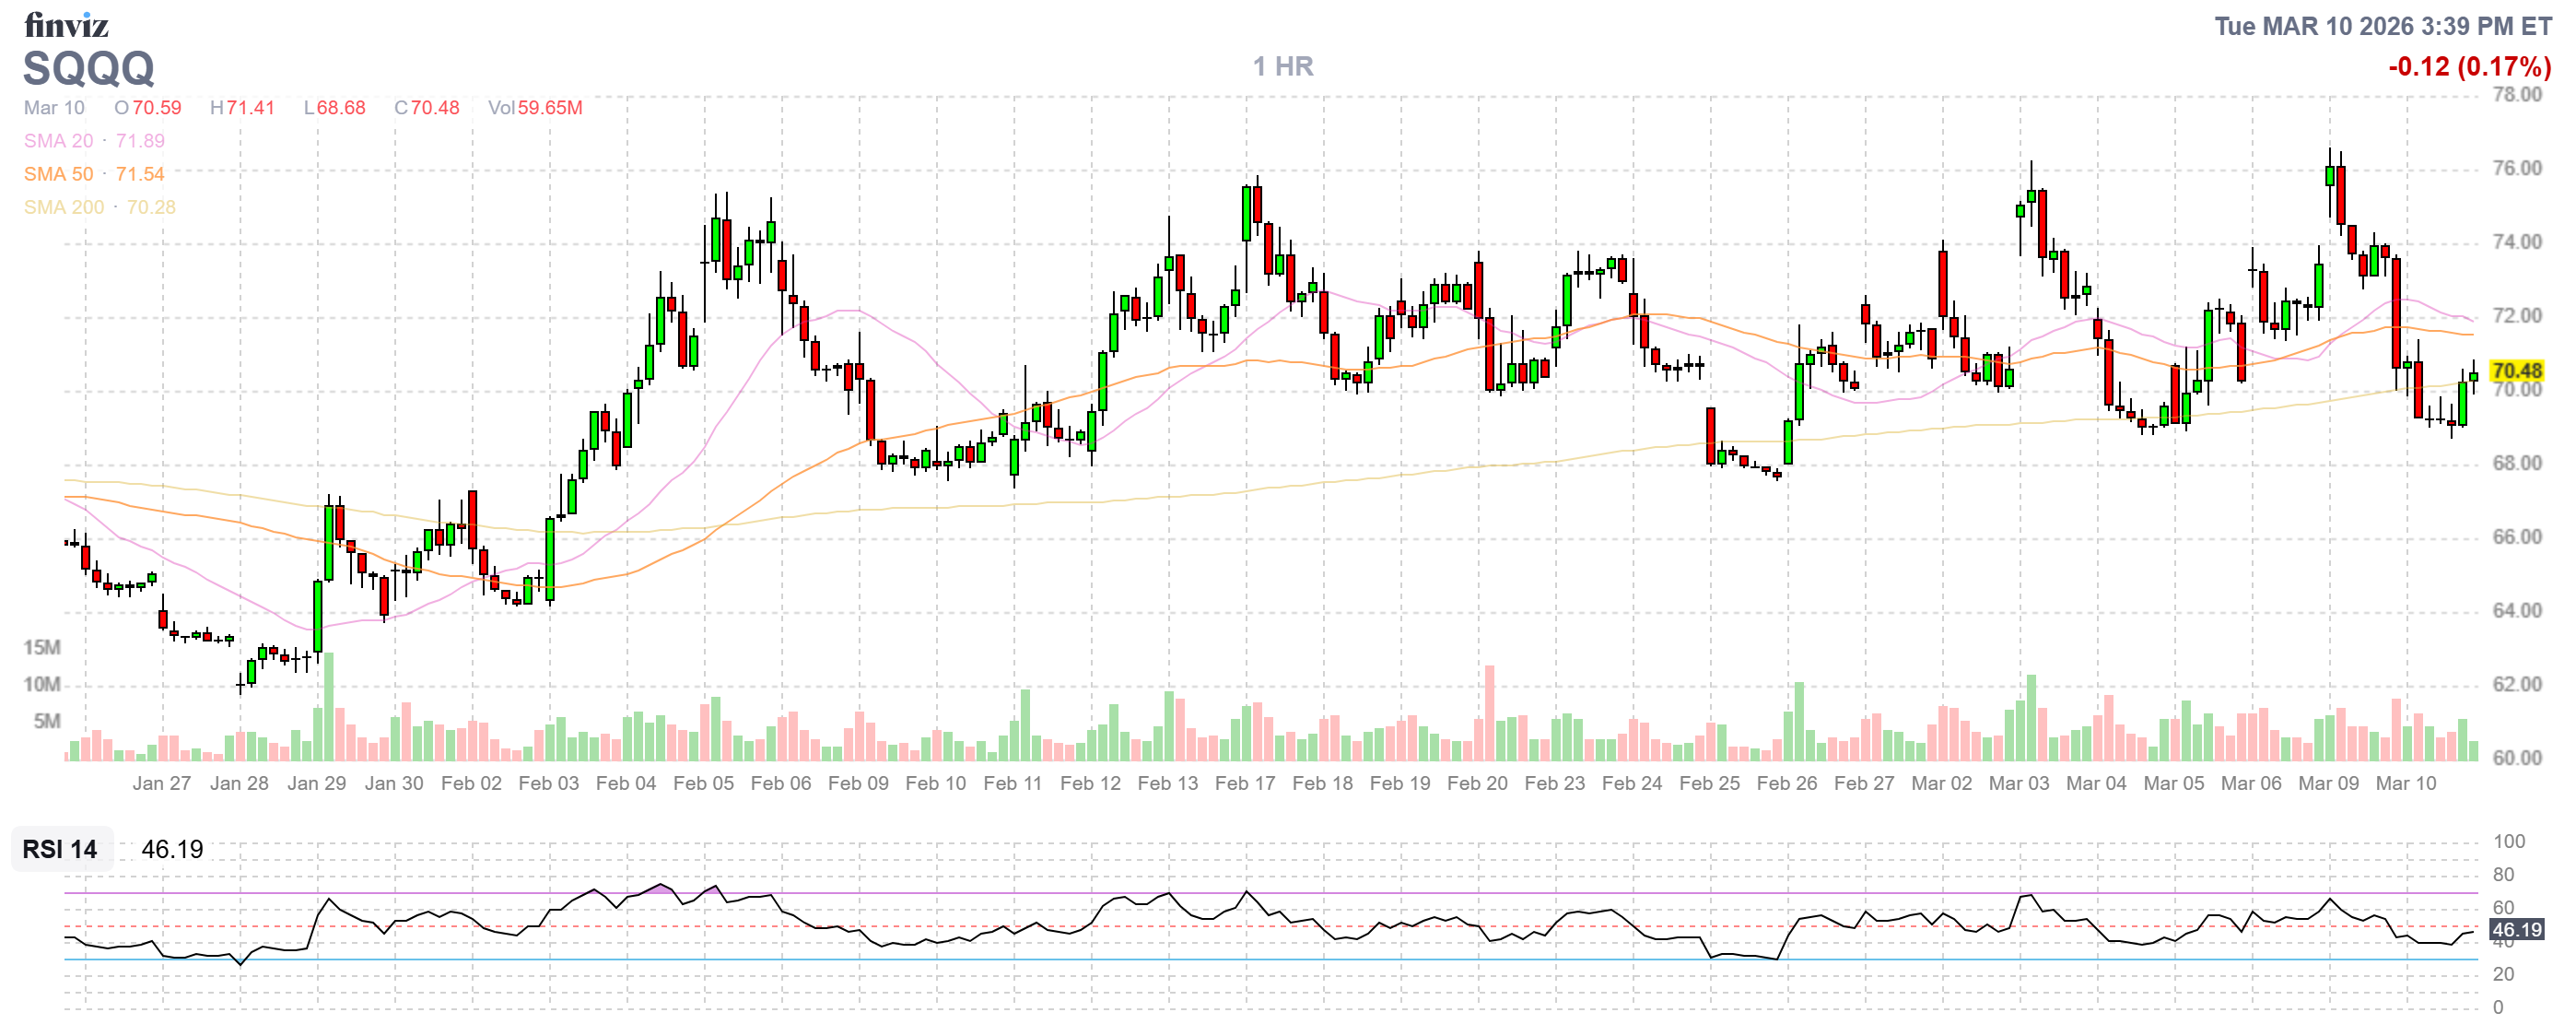
SQQQ – Keep as your umbrella
In your own video you framed SQQQ as the downside engine that makes the rest of the portfolio “sleepable.” Given the macro and the crowded AI complex, I would absolutely keep this hedge in place.[youtube] -
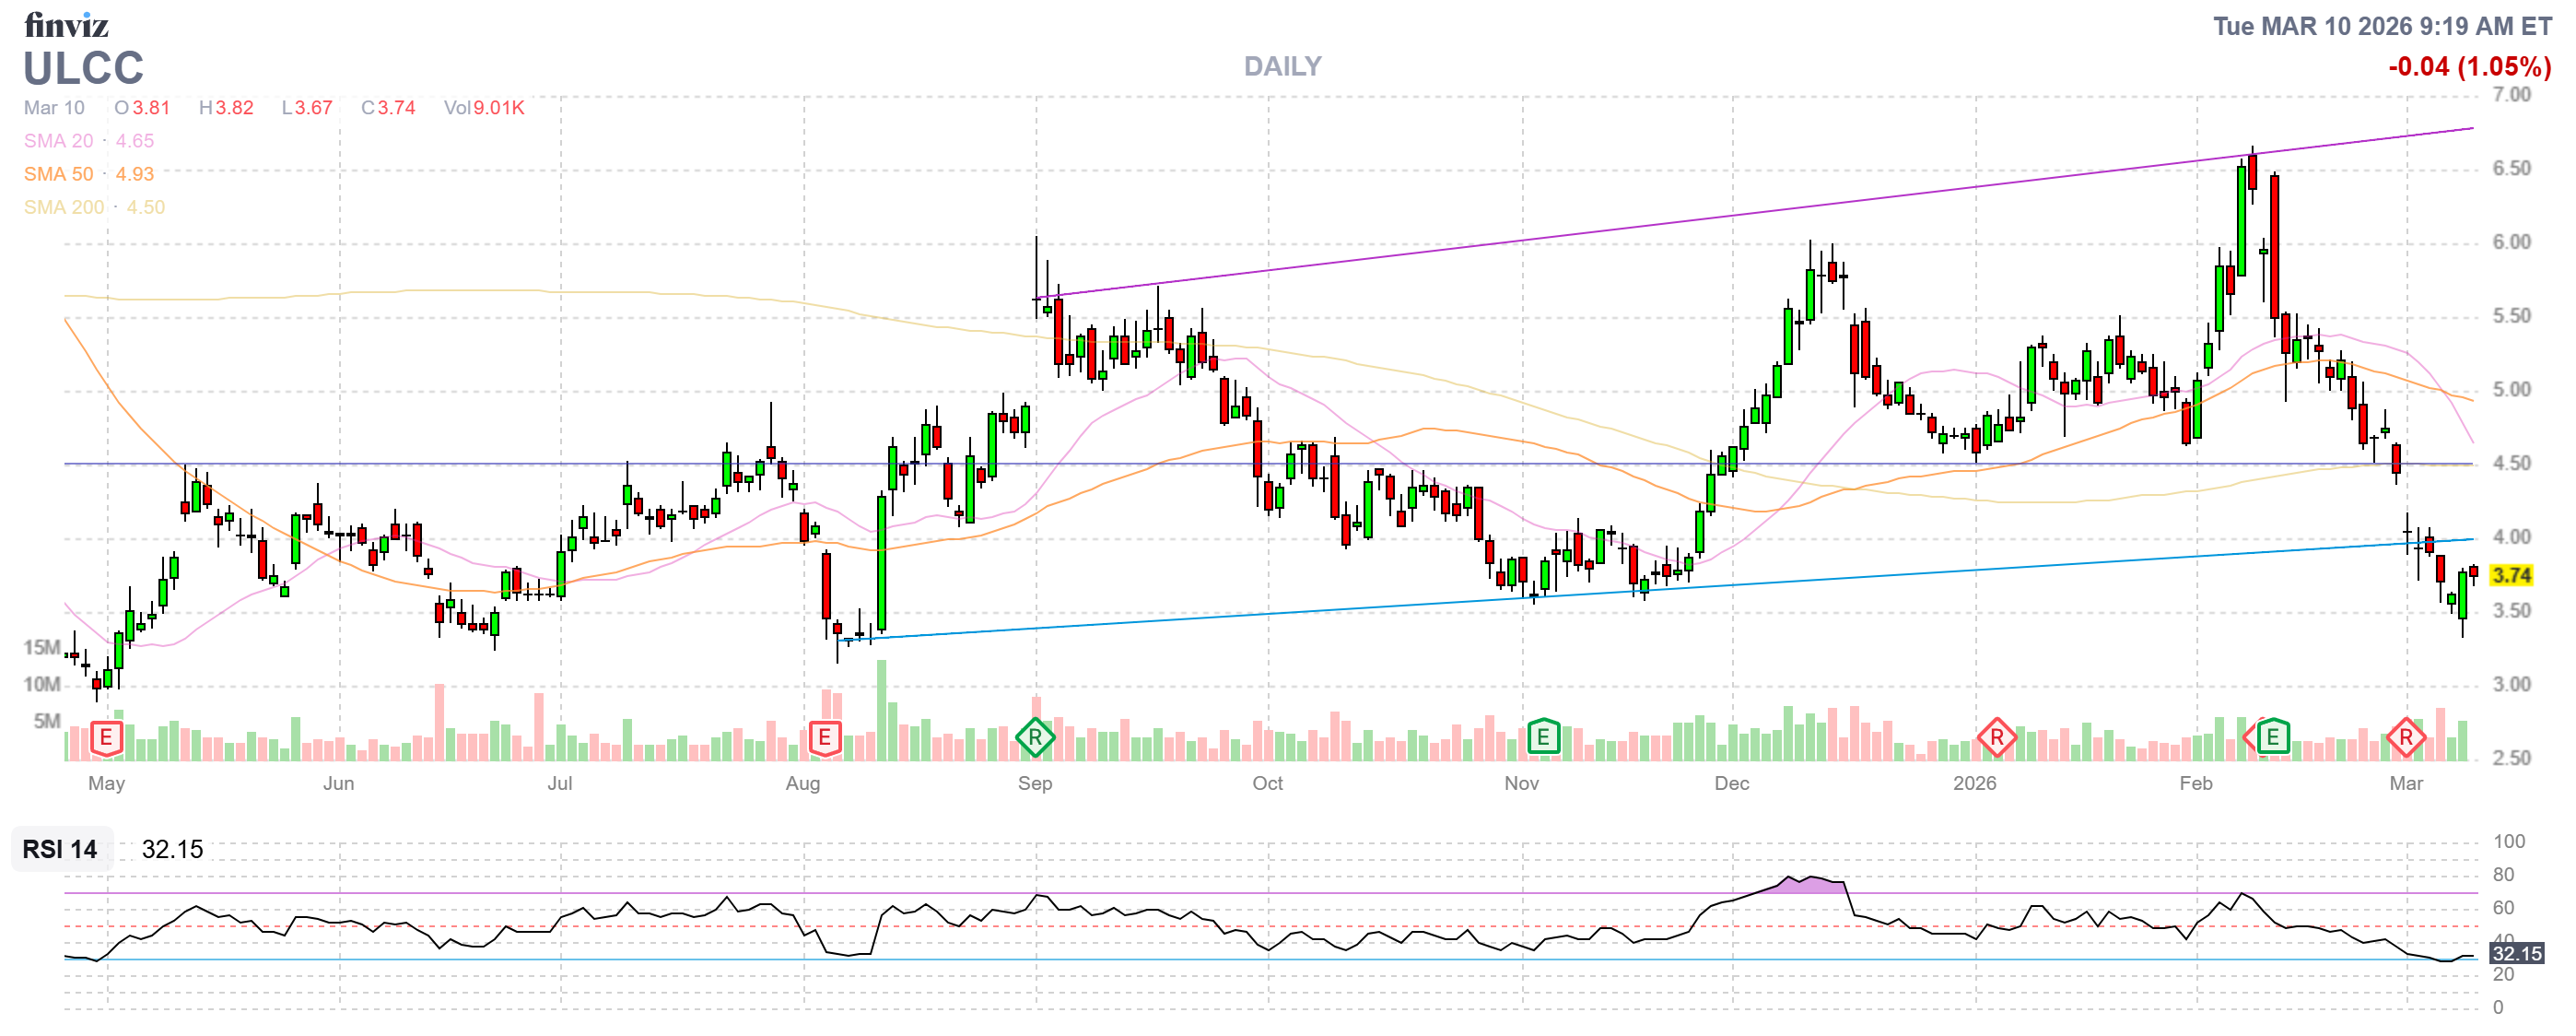
ULCC – Keep
Tiny, high‑beta airline; good example of a defined‑risk, lottery‑ticket style structure. With 2026 expiration, I’d keep unless fuel and demand data clearly turn against the thesis. -
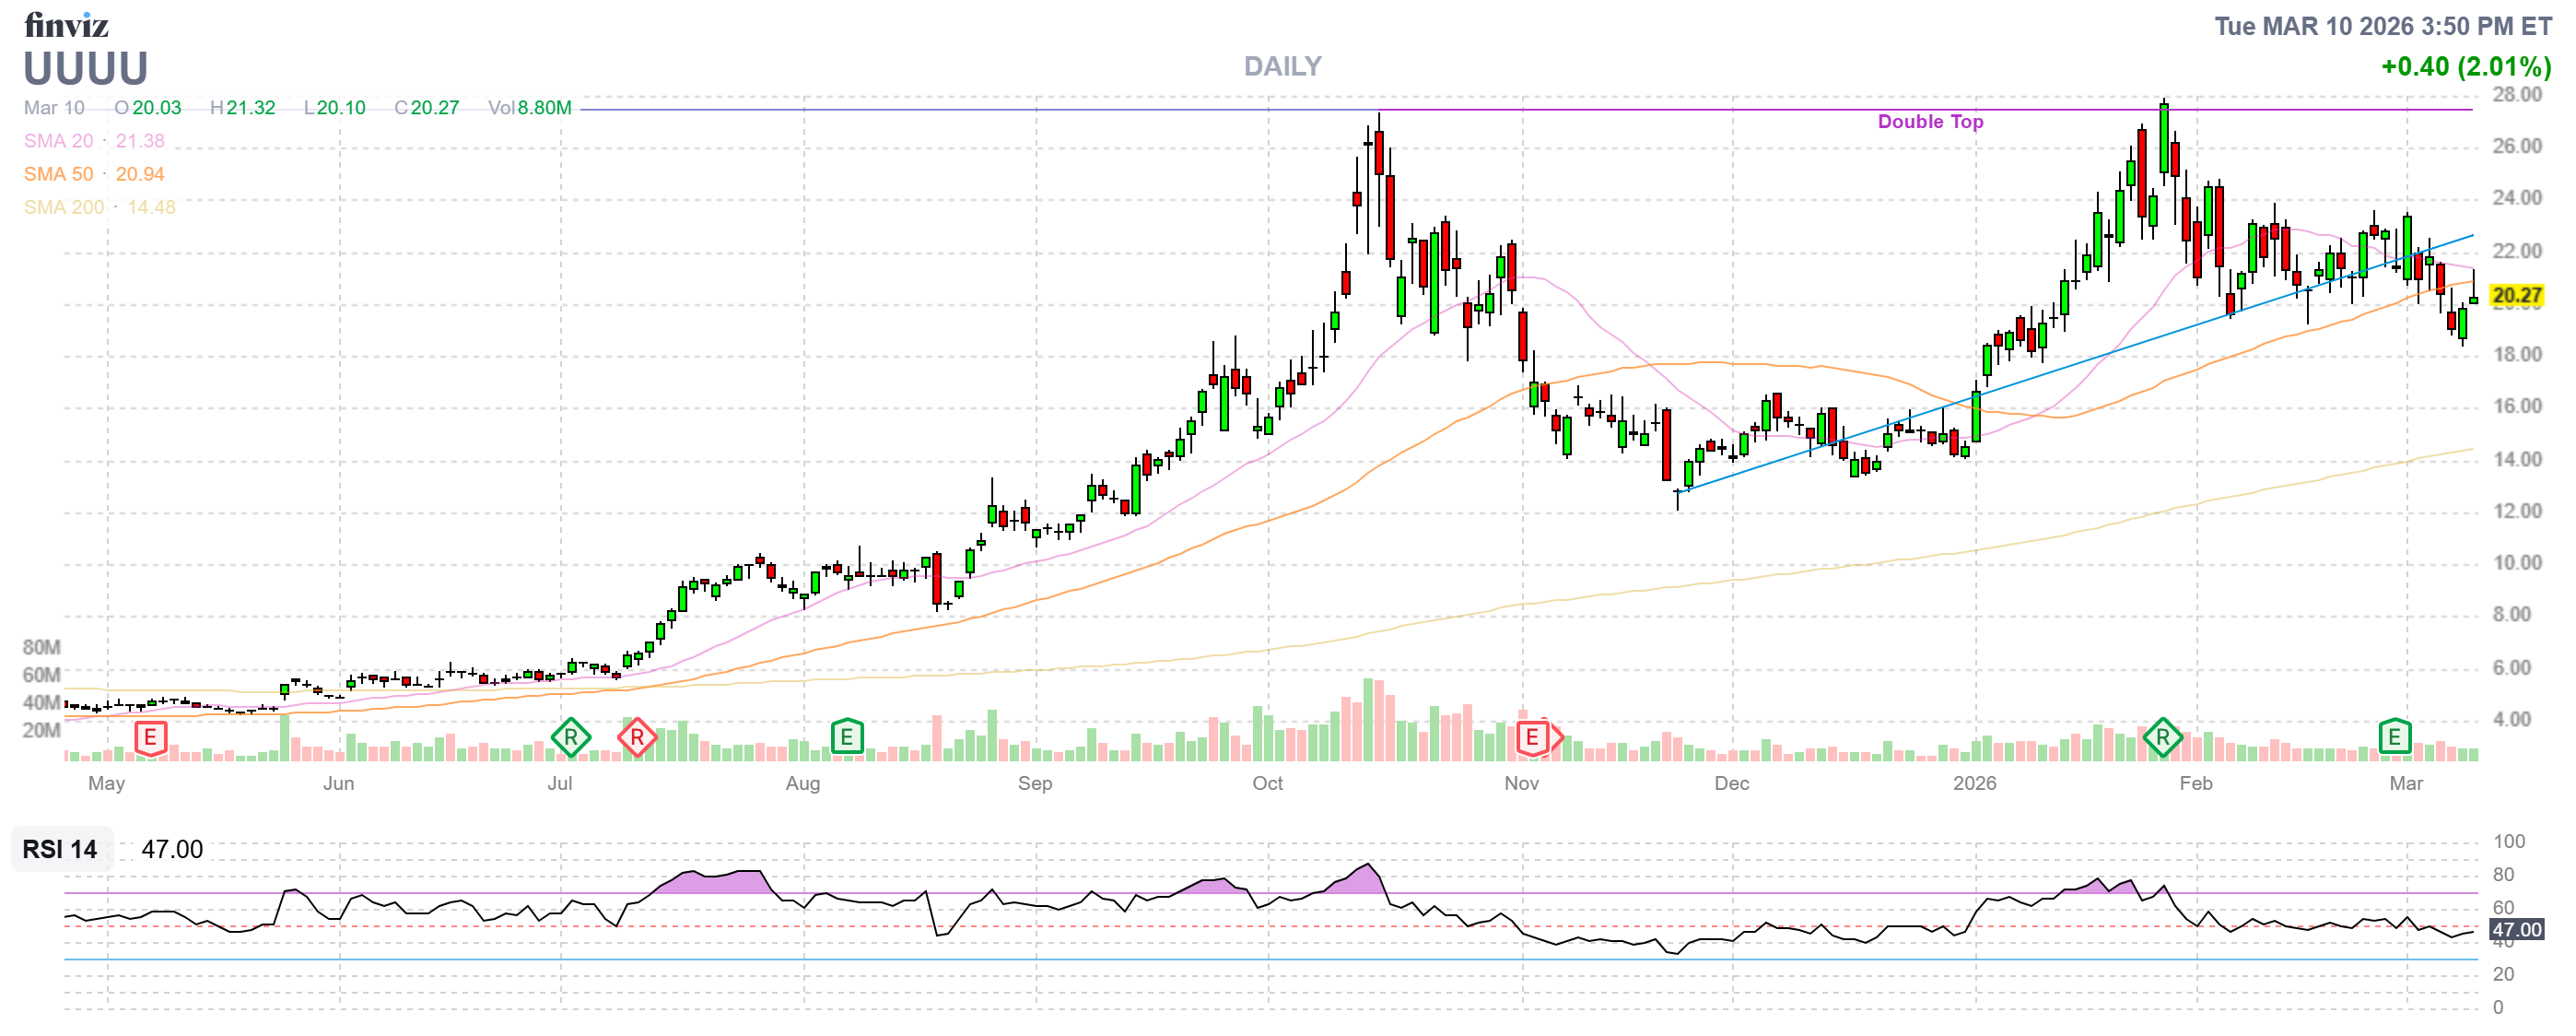
UUUU – Keep and consider intelligent adds / rolls
The uranium macro is actually improving: Energy Fuels is guiding to sharply higher production and sales in 2026, Kazakhstan’s supply growth is peaking, and the stock just bounced back toward the low‑20s. That makes this a classic PSW salvage: the thesis is right, the timing/entry was rough. I’d be looking to roll and possibly scale in at better strikes rather than walk away. reddit+2 -
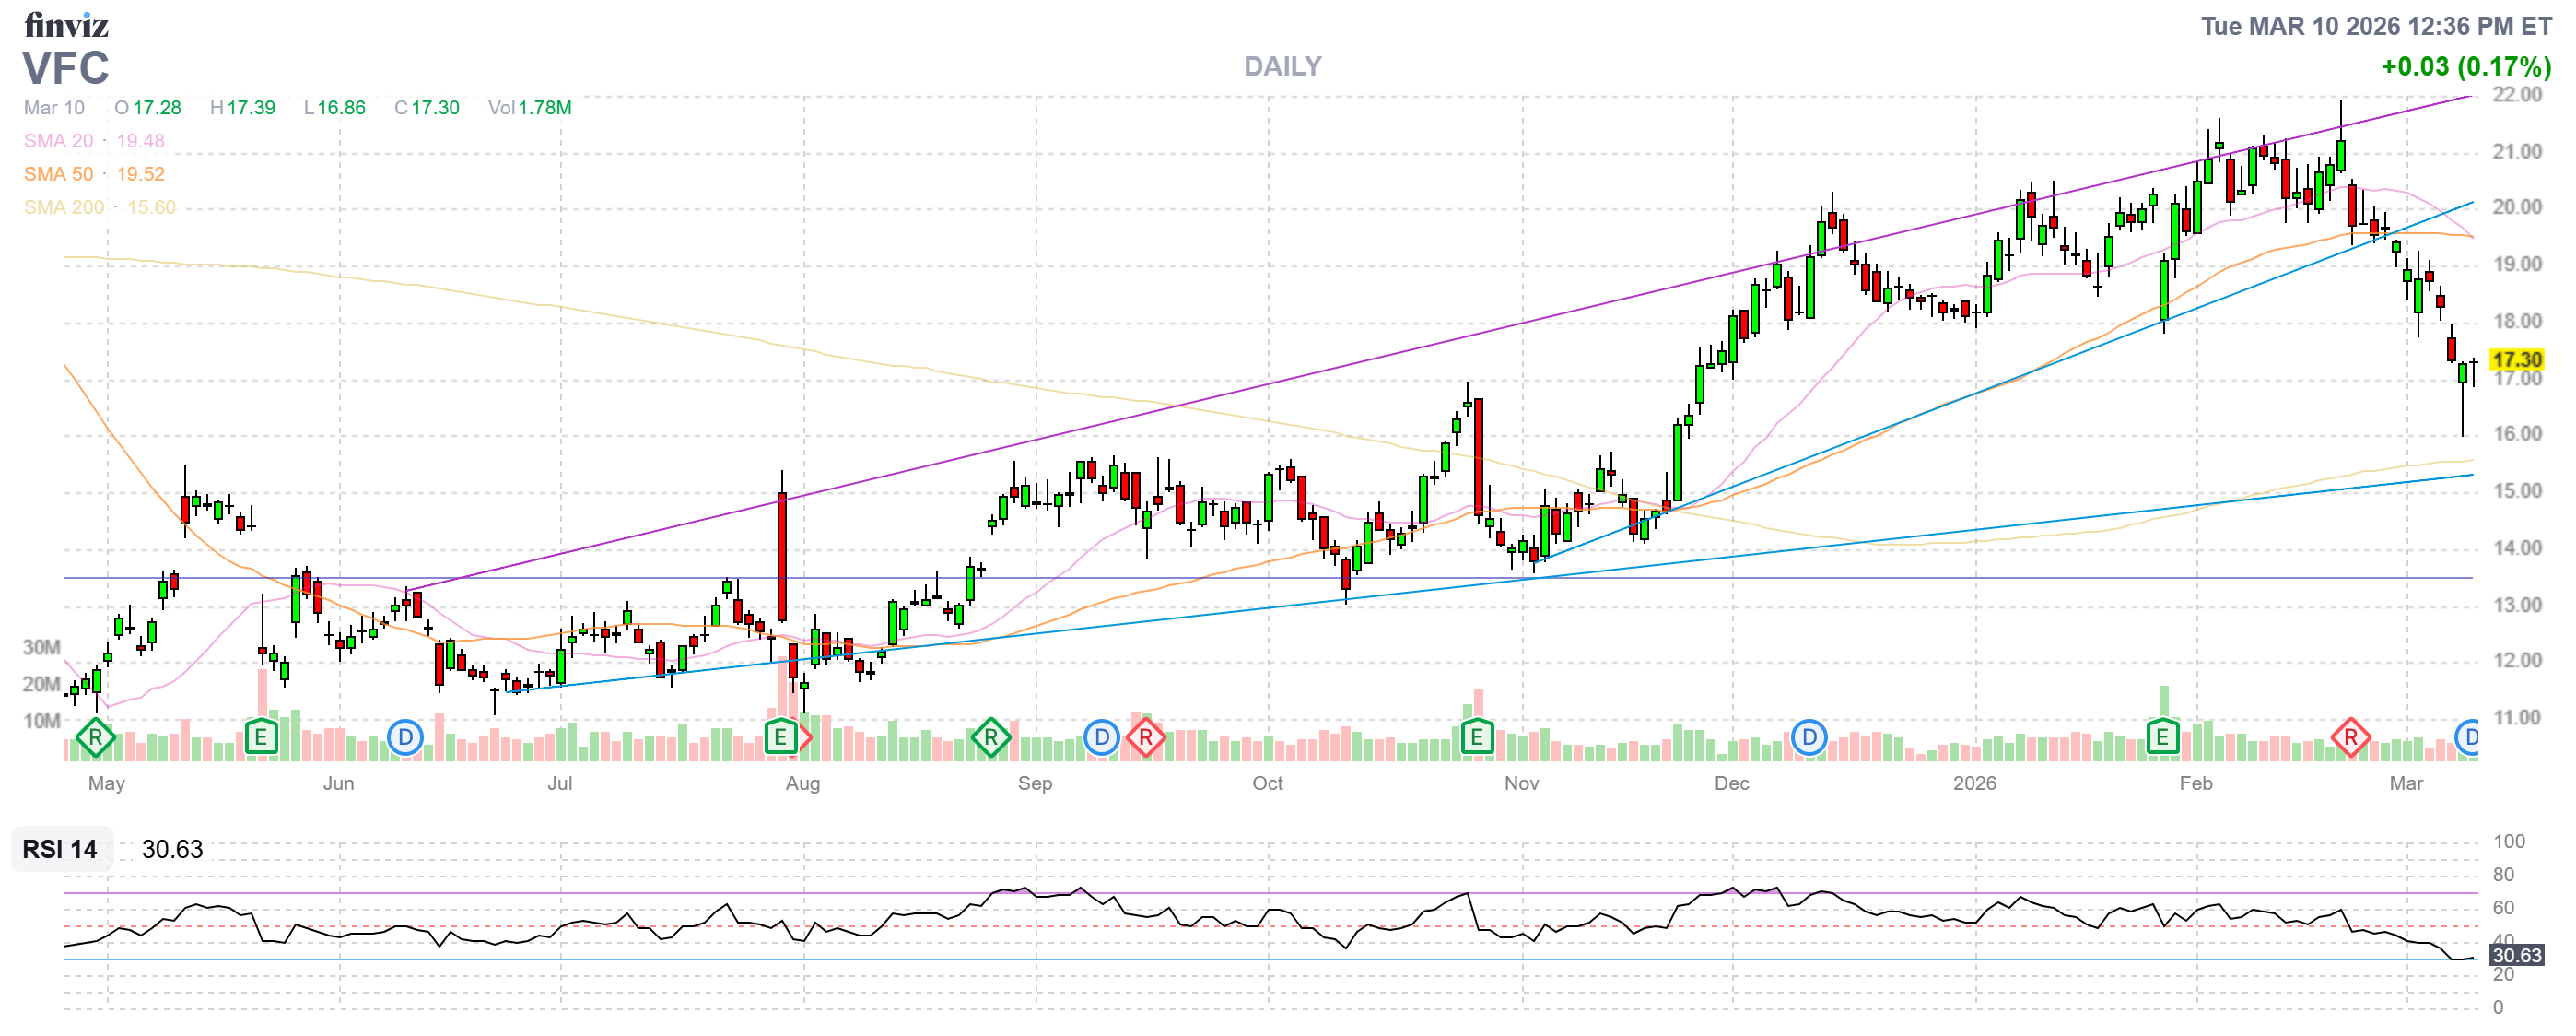
VFC – Keep
Deep‑value and turnaround in retail; lots of bad news already priced and 2028 gives room for restructuring efforts to show through. Size small, stay patient. -
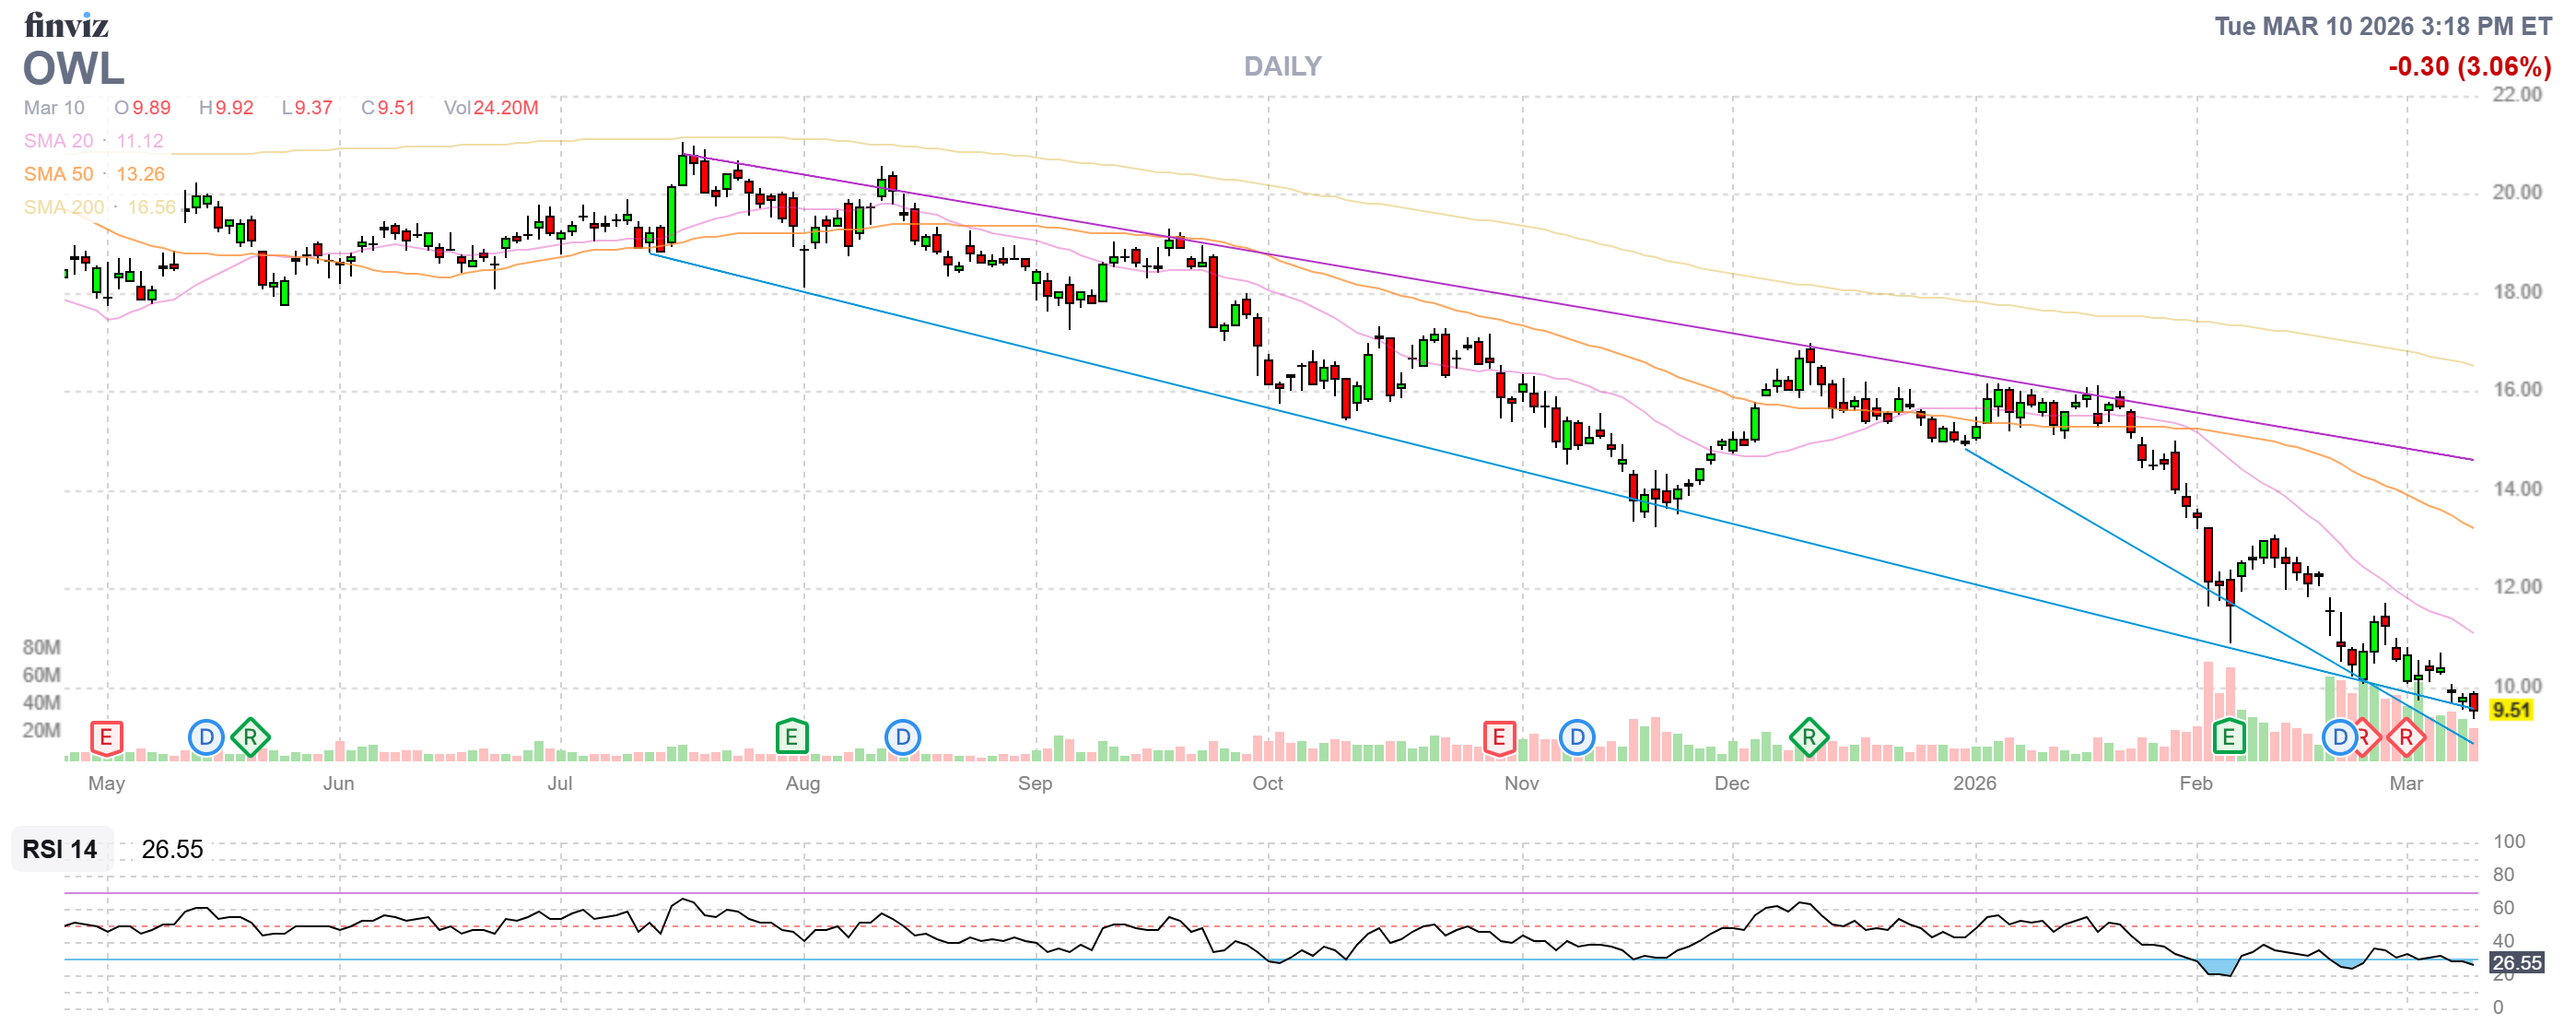
OWL – Keep / gradually build
Blue Owl is a fee‑rich alternative asset manager; in a world where capital is scarce and private credit is growing, that’s a structural tailwind. It fits the $700 philosophy very well: asset‑light, compounding, and time on your side.[philstockworld][youtube]
-
The portfolio still looks aligned with your stated design: boring, undervalued, hedged, with time as the main asset rather than margin. If you want, I can next sketch specific roll/repair ideas for HRB and UUUU, since those are the only ones really demanding “active” attention.
Yes, he could just have said “Keep them all” but he does get paid by the word…
Anyway, you get the idea – they are essentially too good to cut and making 10% while the S&P drops 2.5% kind of makes the point but we won’t look so pretty if the S&P drops 20% – and that’s what I’m worried about!
If you are just joining us, we began on Aug 25th, 2022 with $700 and each month we added $700 ($31,100) so far and each month we find things to buy under NO MARGIN rules (for 401K/IRA players). This is, despite the huge gains, a fairly conservative portfolio and we are generally quick to take our profits and run – as we always seem to find new opportunities to make more. Last year, our 12 prior Portfolio Reviews were:
- How to Become a Millionaire by Investing $700 per Month – Part 42/360
- How to Become a Millionaire by Investing $700 per Month – Part 41/360
- How to Become a Millionaire by Investing $700 per Month – Part 40/360
- How to Become a Millionaire by Investing $700 per Month – Part 39/360
- How to Become a Millionaire by Investing $700 per Month – Part 38/360
-
How to Become a Millionaire by Investing $700 per Month – Part 37/360 – Year 4 Begins!
-
How to Become a Millionaire by Investing $700 per Month – Part 36/360 – 3 Years In!
- How to Become a Millionaire by Investing $700 per Month – Part 35/360
- How to Become a Millionaire by Investing $700 per Month – Part 34/360
- How to Become a Millionaire (EVEN in This Market) by Investing $700 per Month – Part 33/360
- How to Become a Millionaire – EVEN in a CRASH!!! by Investing $700 per Month – Part 32/360
- How to Become a Millionaire by Investing $700 per Month – Part 31/360
- How to Become a Millionaire by Investing $700 per Month – Part 30/360
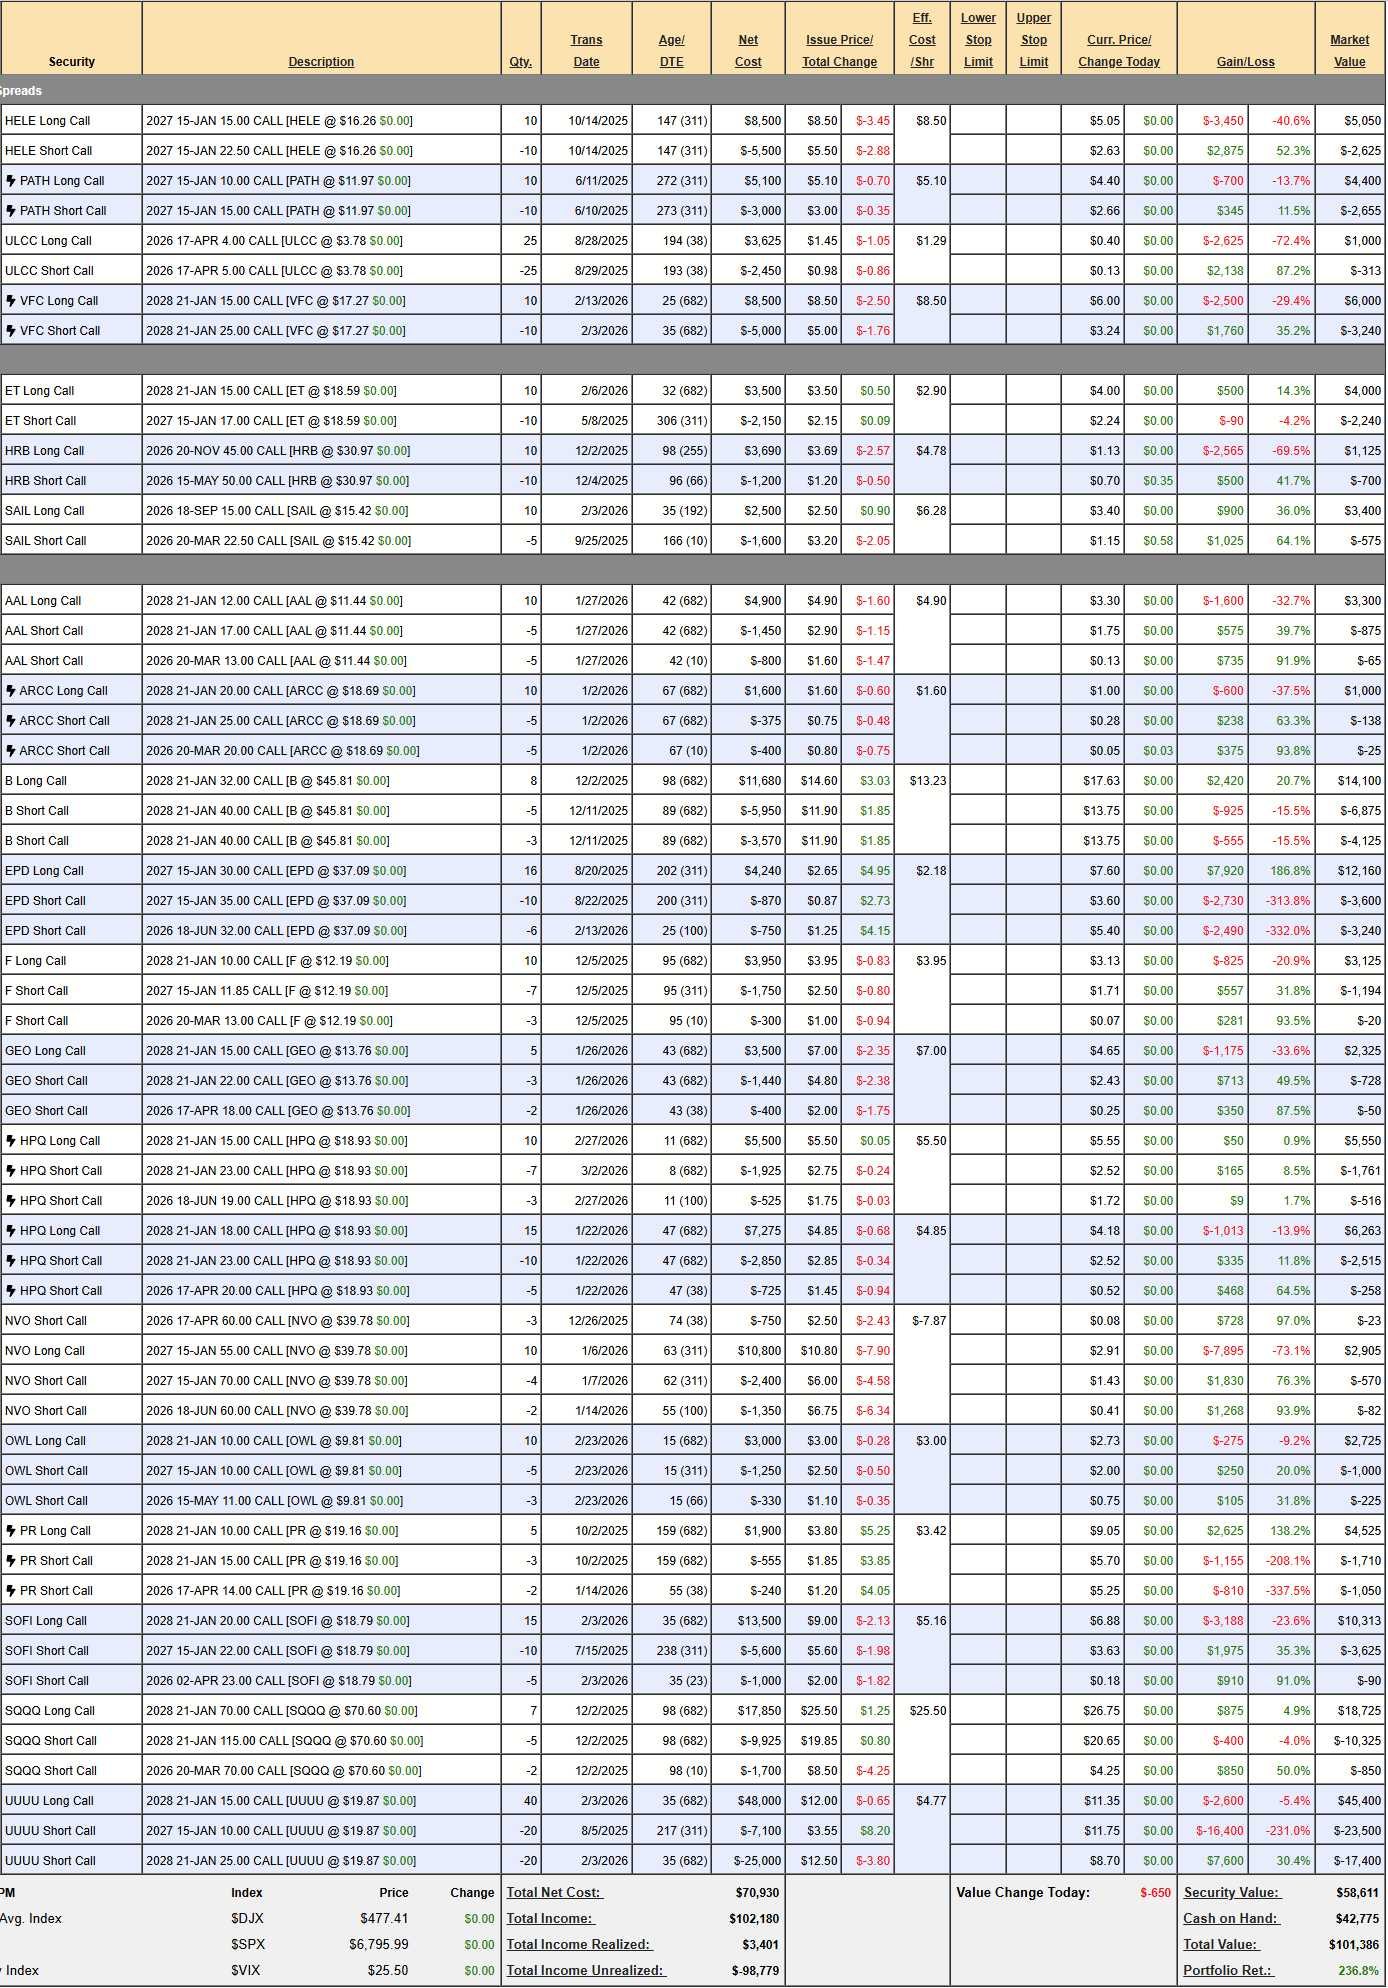
Now you are all caught up! We have $58,611 in positions and $42,775 in CASH!!! but we also added an SQQQ hedge to protect our gains and now I will give my humble human take on the positions as the war rages on around us:
-
- HELE – Took a nasty dip but recovered. I still think it’s stupidly cheap at net $2,425 on the $7,500 spread with $5,075 (209%) upside potential BUT, if we’re going to stick with this one, let’s roll our 10 2027 $15 calls at $5.05 ($5,050) to 10 2028 $12.50 calls at $8.50 ($8,500) and let’s roll the 10 short 2027 $22.50 calls at $2.63 ($2,630) to 10 short 2028 $20 calls at $6 ($6,000) and that whole exchange cost us $80 and dropped us $2.50 lower in target AND gave us an extra year to be right. AMAZING for a new trade!
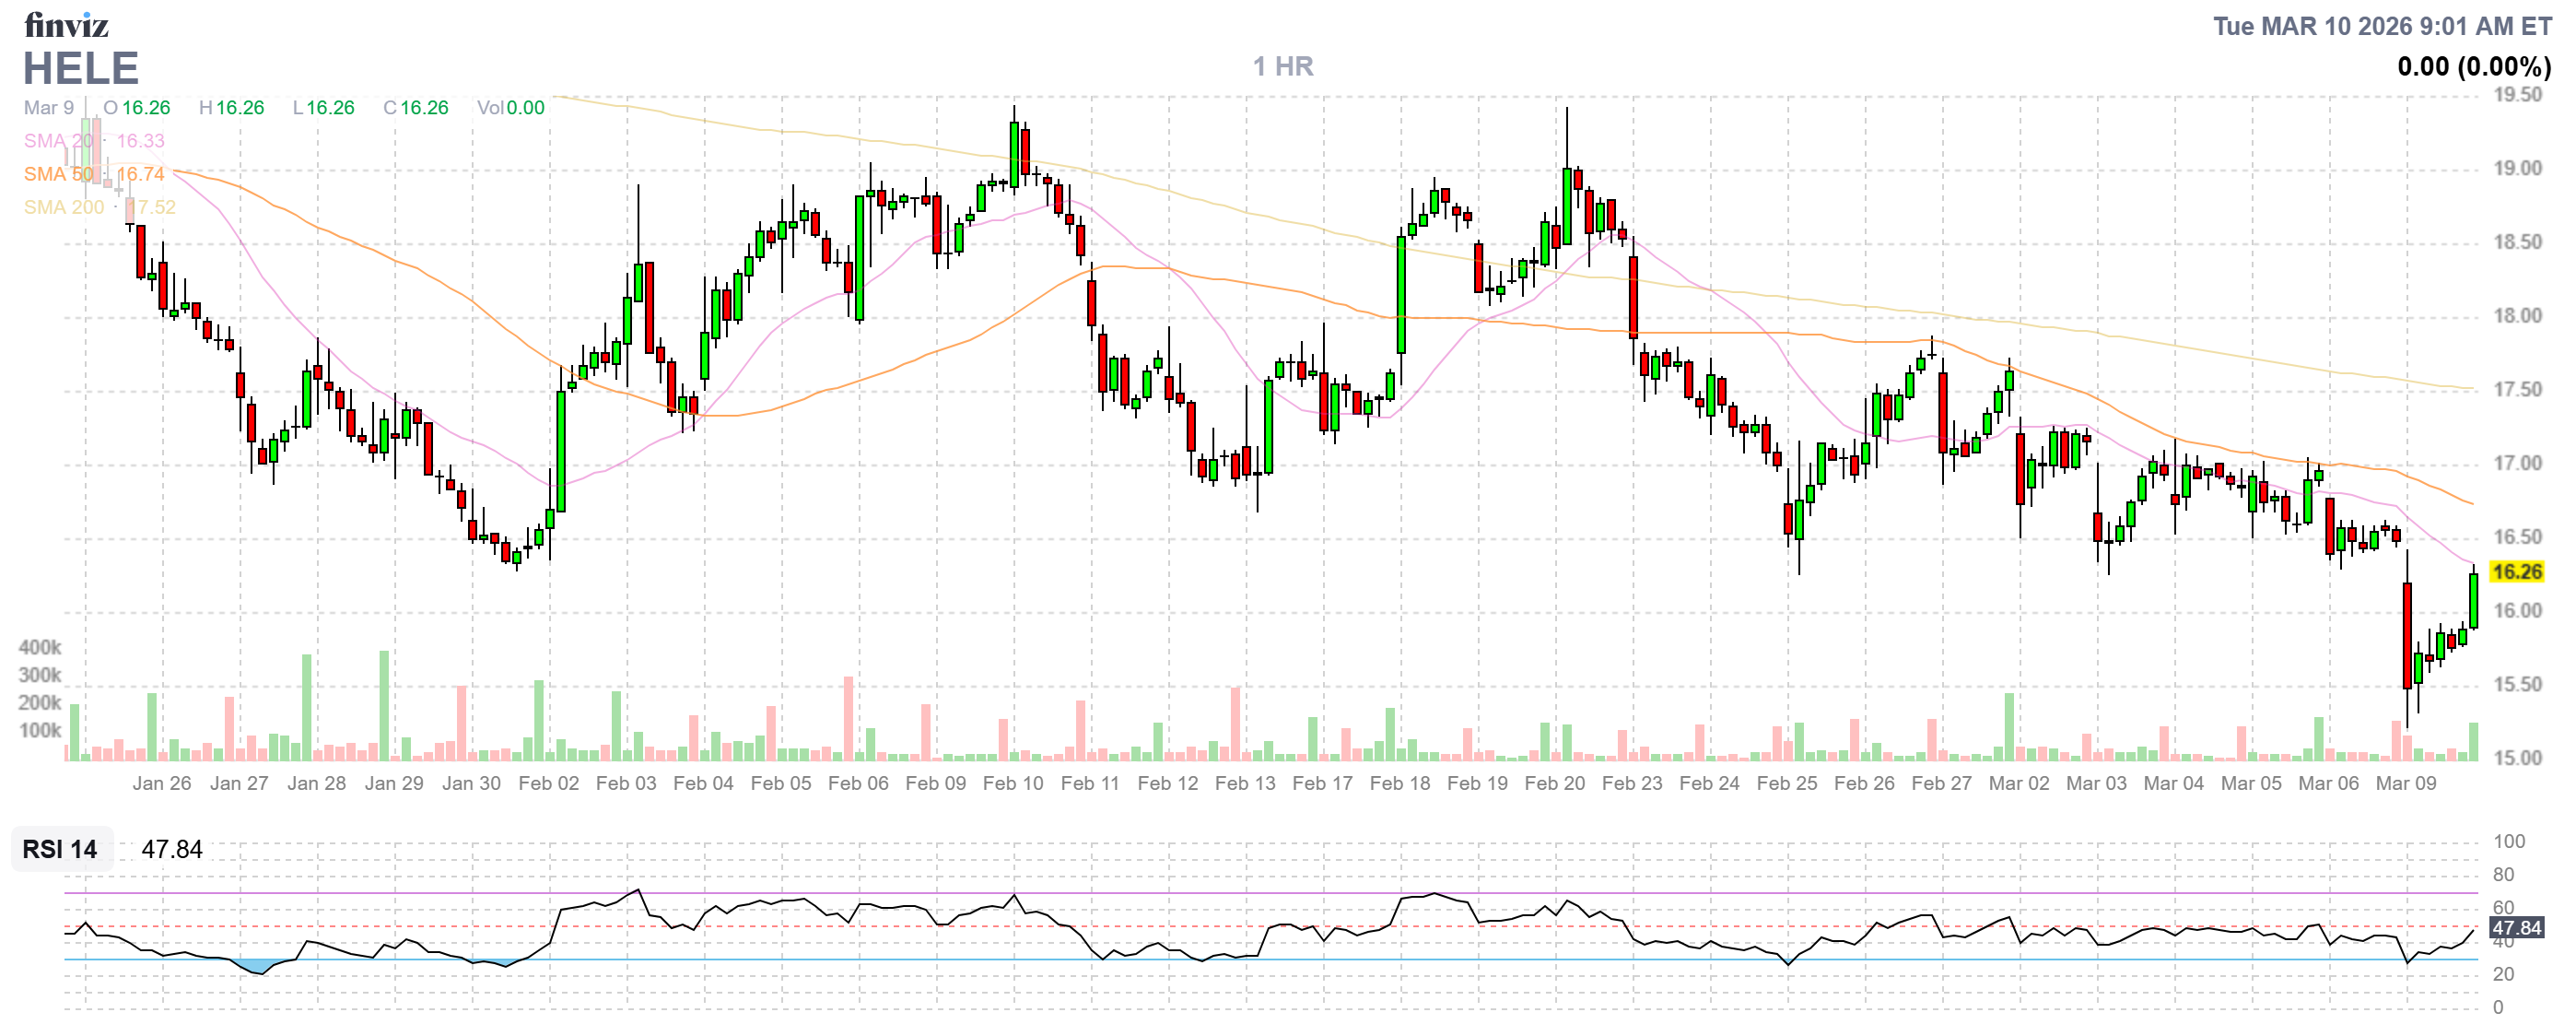
What we are doing here (and in most of our adjustments) is taking advantage of the high VIX to sell more premium. At 25, the VIX is way over the normal 15 range so, if we sell premium and the VIX drops 40% – that’s a huge bonus for us!
In this trade, we are moving deeper in the money (less premium) while selling short calls with more premium (100% of the $6 is premium!) and, the only sure thing in the market is that ALL PREMIUM EXPIRES WORTHLESS!
There, we made it through 1… 😉
-
- PATH – As Boaty noted PATH is a leader in AI business process development – how can they possibly not be doing well? Sure, maybe AI will integrate itself one day BUT IT CAN’T DO THAT UNLESS IT’S INTEGRATED – so kind of chicken and egg here and we’ll find out tomorrow with earnings. Net $1,745 on the $5,000 spread so we have $3,255 (186%) left to gain if we can make it back to $15 by January.
-
- ULCC – Last month, we were worried it was going up too far, now we’re underwater. This is, of course, a fuel issue and it won’t be over by April but I think we HAVE to take advantage of the 2028 $4 ($1.60)/$7 ($1.20 – we may have to be patient) bull call spreads at 0.20 so let’s buy 100 long ($16,000) and sell 75 short ($9,000) for net $7,000 and we’ll give our April $4s ($1,000) time to bounce. When the short April $5s ($313) expire, we can sell 25 July $5s for 0.40 ($1,000) and you can see how we’ll get our net $6,000 back over time while suddenly being in a $15,000 for net (because we initially spent $1,175) $7,475 with $7,525 upside potential plus the income side! Very good for a new trade, obviously!
-
- VFC – They have beat their last 4 earnings and $17.27 is $6.7Bn and they should be at 20x earnings ($350M) this year so I believe in the target. We’re at net $2,760 on the $10,000 spread but, most importantly, we’re $2,270 in the money with $7,240 (318%) upside potential.
-
- ET – Kind of bullet-proof. We’re in the money at net $1,760 on the $2,000 spread so it’s not worth keeping or waiting – let’s cash it in!
-
- HRB – Not worth saving – let’s kill it!
-
- SAIL – I like these guys and expect great things but only just now turning a small profit ($133M) against an $8.7Bn market cap so let’s be glad we made money and cash it out.
-
- AAL – IF the fuel goes back to normal soon, then it’s just a blip for them and the sell-off is overdone but there’s also the grounding of jets in the Middle East and it might not end soon and we just spent money on ULCC so we don’t need two big risks – let’s cash out.
-
- ARCC – We’re in it for the short-term premium sales and the short March $20s will go worthless and then we’ll sell 5 Sept $19 calls for $1 ($500) and the net of the spread is $862 so we’re collecting 58% per period while we’re waiting for our $5,000 spread to mature – no wonder this portfolio is doing so well! $4,138 (480%) upside potential PLUS the short-term premium sales (let’s say 3 more for $1,500). If that’s not good for a new trade – I don’t know what is?

-
- B – Net $3,100 on the $6,400 spread has $3,300 (106%) of upside potential and we’re already at $45 – so we only have to hold $40 to make 106% – can it be any easier?
-
- EPD – In the money at net $5,360 on the $5,000 spread and usually I’d play it out for income but, in this environment – let’s cash out!
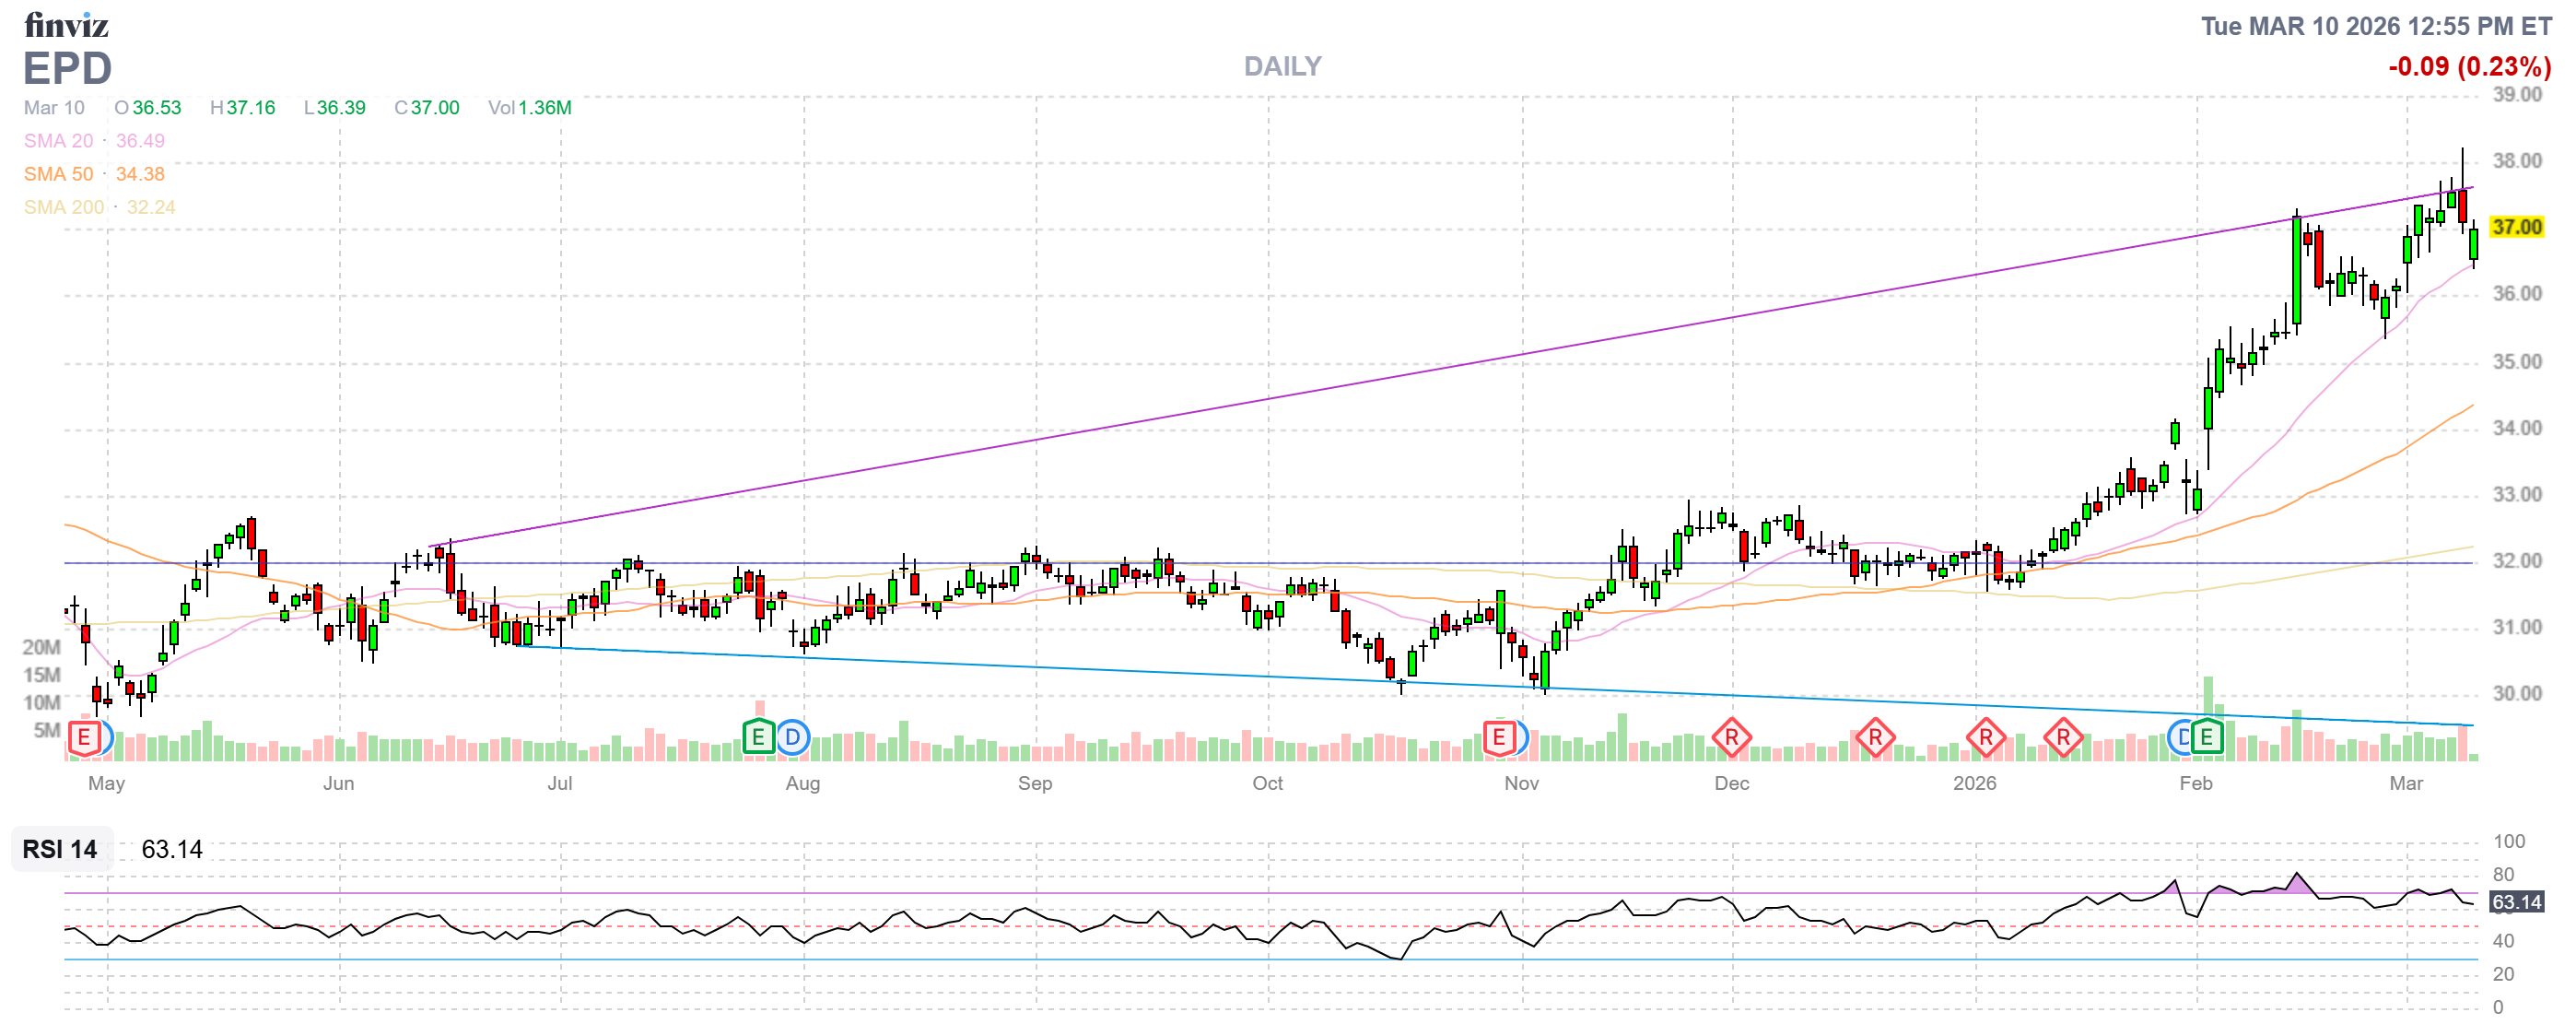
In August we initiated this spread at around $2,500 and, if we fiddle around, maybe we can make 20% more. We’re up 115% now, 20% is NOT a good use of $5,360 for the rest of the year, is it?
-
- F – Here we have net $1,911 on the $1,850 spread and we sold $300 (15.6%) for 3 months and we have 22 months left so 7 sales is $2,100 (109%) upside potential is a number I don’t mind playing for! Good for a new trade if 109% in two years isn’t too boring for you.
-
- GEO – Interesting how cheap they are (8x) given Trump’s detention policies. With the 2028 short $22 calls up 50% – let’s buy those back ($728) and the April $18s are toast, so let’s buy them back and sell 5 June $15 calls for $1.60 ($800) and buy 5 2028 $13 calls for $5.60 ($2,800) and roll the 5 2028 $15 calls to the $13 calls for net 0.95 ($475). So we’ve spent net $3,200 plus our original $1,660 is net $4,860 on what is now (at $22 – still a valid target) $9,000 spread with $4,140 (85%) upside potential but we’ll sell some 2028 calls to halve our basis and 6 more quarter of $800 in short call sales is $4,800 (98.7%) upside potential from premium sales. Basically, this IS a new trade.
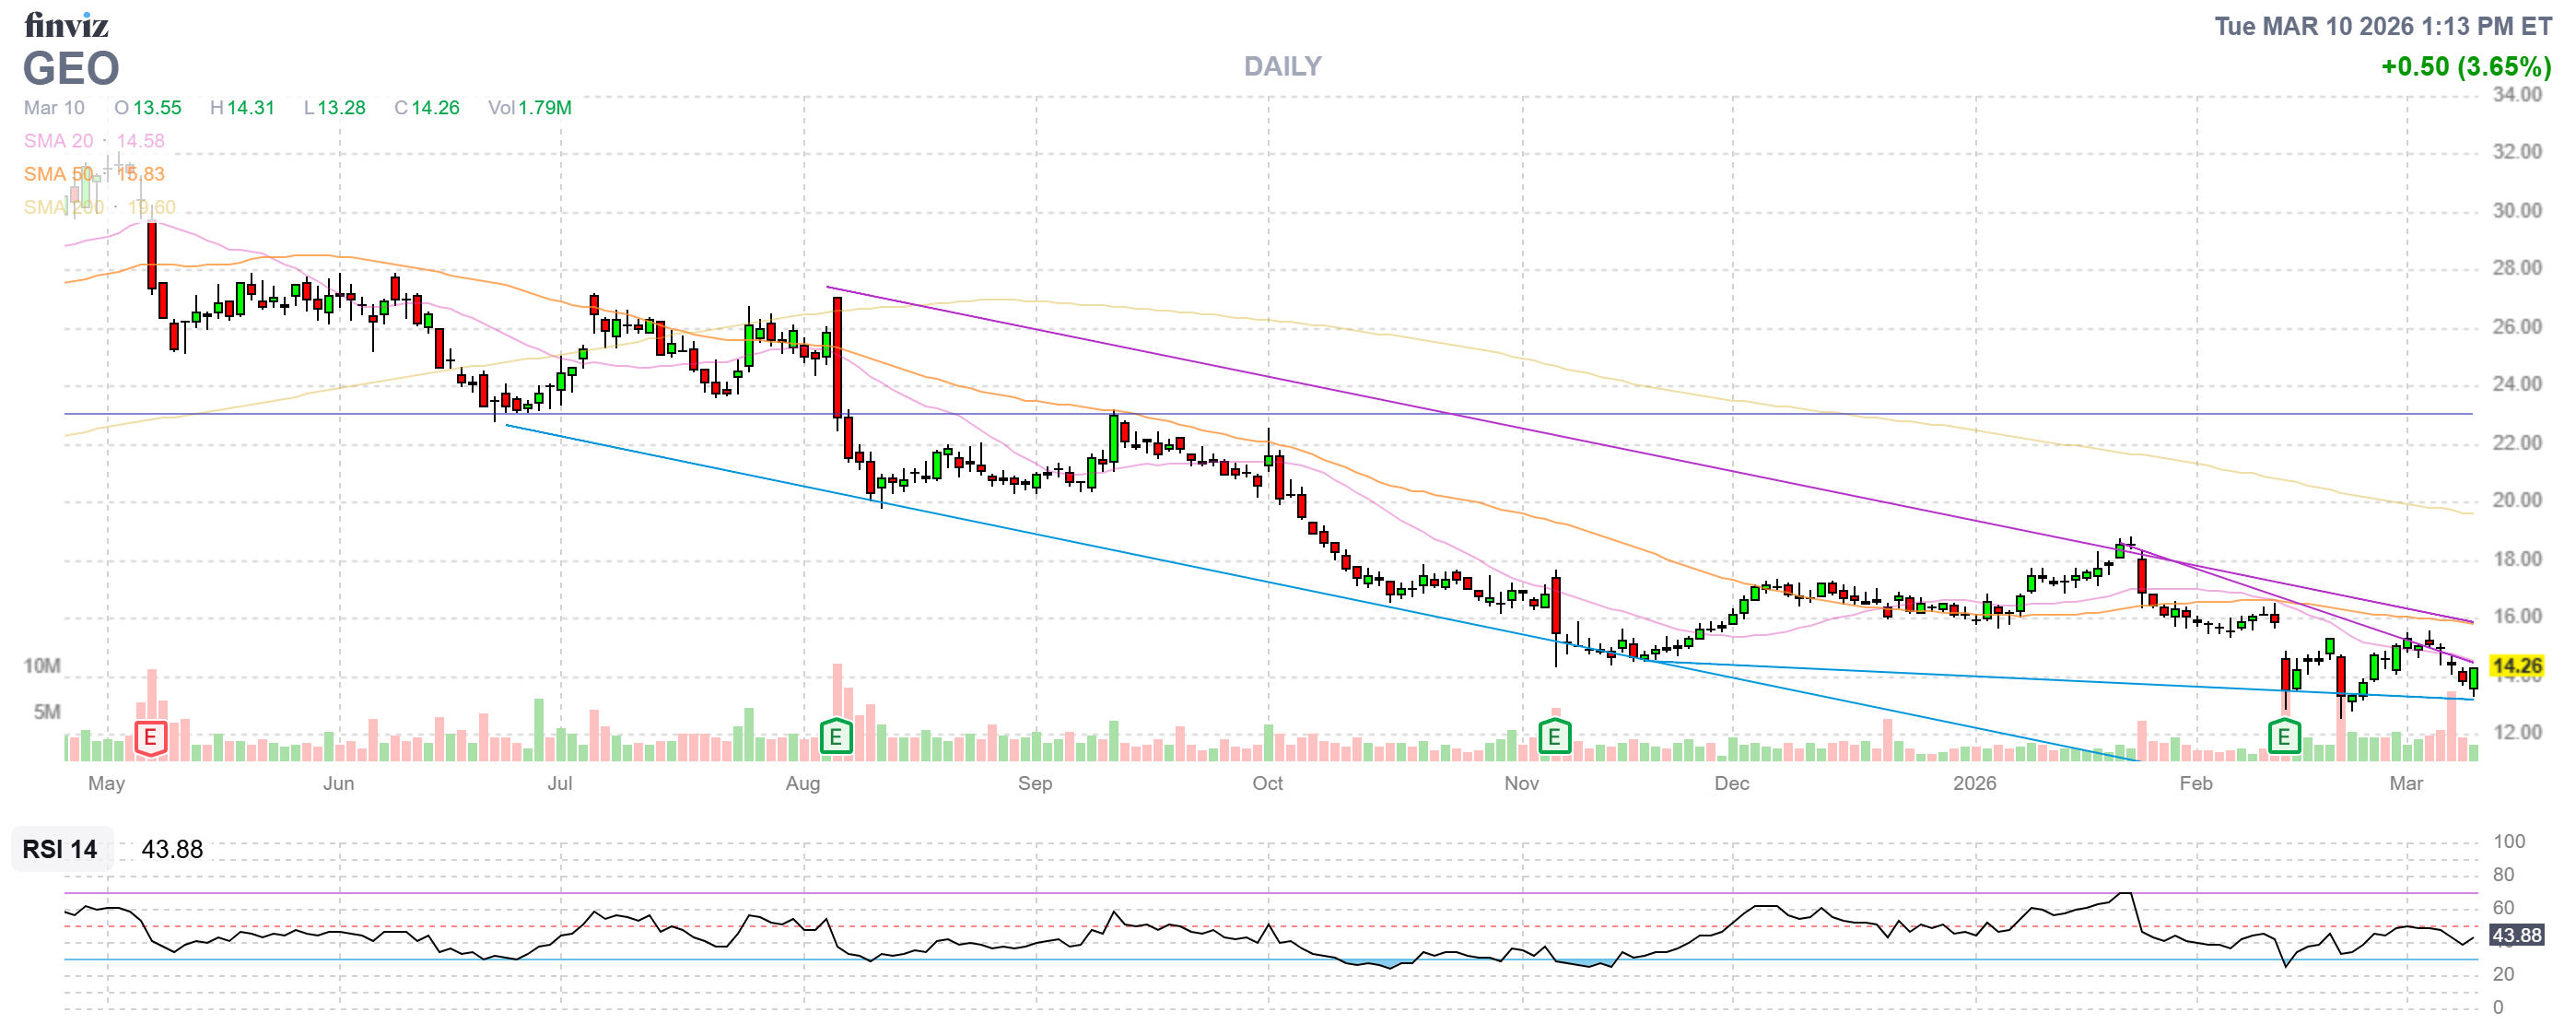
See – I told you we had something better to do with that other money!
-
- HPQ – Brand new at net $3,273 on the $8,000 spread so there’s $4,727 (144%) upside potential at $23 PLUS we just sold $525 in premium for 4 months so 5 more sales is potentially another $2,675 (80%) in premium sales – nice and, of course, it IS a new trade!
- HPQ2 – Wow, I must really like these guys! Net $3,490 on the $7,500 spread has $4,010 (114%) upside potential and here we’re selling $725/qtr so 7 x
-
- NVO – All the short calls will go worthless but we’re still down net $4,069. The question is, at net $2,232 – can we make up the $4,069? NVO is down to around 10x so this should hold and we can sell June $40 calls for $3.10 and the 2028 $40s are $9.30 so, if we buy back ALL the short calls ($675) and roll the 10 Jan $55s ($2,910) to 15 2028 $40s ($13,950) and sell 10 2028 $50s for $6.60 ($6,600) and sell 5 June $40s for $3.10 ($1,550) that will be net $3,565 spent to move to the $15,000 spread that’s at the money with (6 x $1,550 =) $9,300 of premium selling potential. Yes, that sound like a keeper! And it’s essentially a new trade!
- On the one hand, we could say whatever we spent was a sunk cost anyway but it was net $6,300 so that plus the new $3,565 is $9,865 and, if all goes well, we get back $9,300 and $15,000 at $50 for a SALVAGE PLAY profit potential of $14,435 (146%). Sure beats closing it out for a loss!
-
- OWL – Still has that new trade smell. Net $1,500 and the 2028 $15s are $1.40 so call it a $5,000 spread has $3,500 (233%) upside potential at $15 and we took in $330 for the short calls so 6 more of those has another potential $1,980 (132%) of upside potential – see how this all adds up over time?
-
- PR – Net $1,765 on the $2,500 spread and it’s already way in the money. We’ll do the roll next month as we got burned but still there’s $735 (41.6%) upside potential AND some income potential but we’ll probably do something fancy with it later.
- This is a trade that, technically, went badly as it popped to fast. We started at net $1,105 in October and we’re already up $660 (59%), which is more than 10% PER MONTH.
- That’s how our MISTAKES perform!!!
-
- SOFI – Boy people do NOT understand how this bank works! Let’s just say $18.50 is a joke. It’s 22x forward P/E but the growth is phenomenal! So fine, let’s roll our 15 2028 $20 calls ($10,313) to 25 2028 $15 calls at $8.50 ($21,250) and we’ll roll our 10 short 2027 $22 calls ($3,625) to 15 2028 $25 calls at $5.20 ($7,800) and we’ll buy back the April $23 calls ($90) and sell 10 June $20 calls for $2.05 ($2,050).
- That’s net $4,802 spent (+$6,900 originally) is $11,702 – not counting the income we’ve been collecting. The new spread is potentially $25,000+ so there’s $13,298 (113%) upside potential at $25 PLUS we just sold 3 months for $2,050 so 6 more of those is another potential $12,300 (105%).
- Yes, it’s FANTASTIC for a new trade!
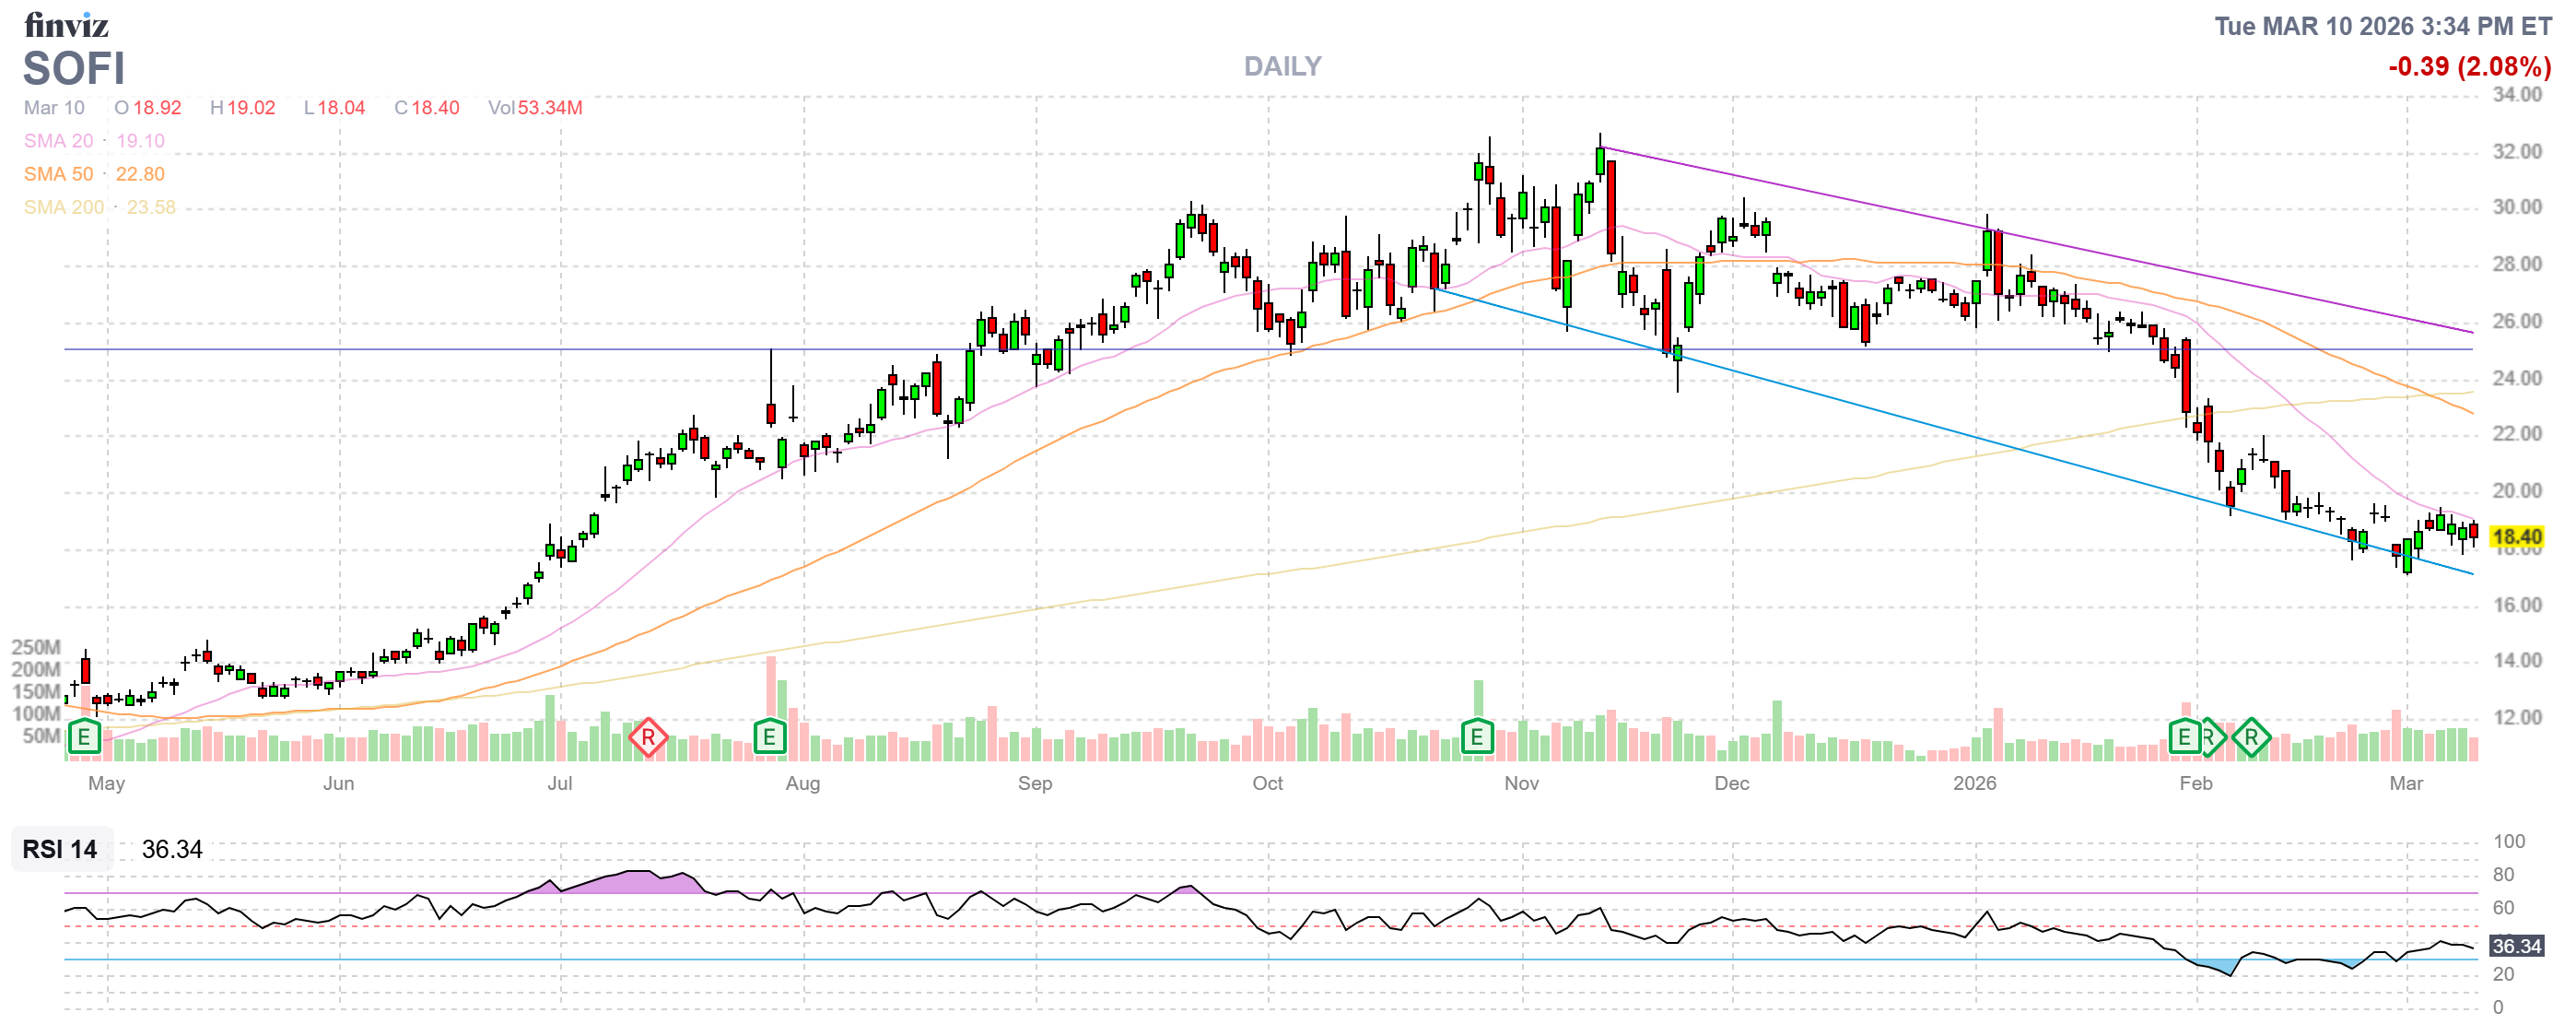
That’s $25,000 of potential upside from this one trade and, remind me, how much money did we start this portfolio with less than 4 years ago? That’s right – $700!!!
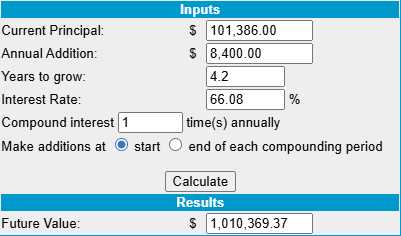
If we are going to hit $1M in 4.2 more years, that’s $101,386 to start now and $700 x 50 is $35,000 to get to that $1M (10x) at the pace we’re on now – not bad – not to late to join in the fun – tell your friends!
-
- SQQQ – Our hedge! With all this war stuff, let’s be happy for the pullback and buy back the short March $70 calls ($850). We can always sell something else if the World is still here next month (but I’m not betting on it!).
-
- UUUU – We cashed in the original winner and this is what’s left. As noted in chat today, I don’t think it’s coming back down but clearly we can roll the 20 short 2027 $10s to the 2028 $25s for $3 ($6,000) and then we’re in a $40,000 spread which we originally paid net $15,900 for so net net $21,900 with a profit potential of $18,100 (82%) is not so bad that I want to spend money to fix it for now. The deep in the money short Jan $10s are essentially a downside hedge that make this a fairly conservative play.
- Actually, let’s try this. The Jan $10s are $11.75 and the June $20s are $4.40 so, if we roll 5 (1/4) of the Jan $10s ($5,875) to 5 June $20s ($2,200), that will cost us $3,675 but we’ll have 2 more chances to collect that this year ($6,600 total). So we will have gotten rid of 5 of the short calls and that makes it much easier to roll the rest up (15 to 20) when we have to. So the roll is an investment in future earnings potential WITHOUT giving up much protection.
So I guess I’m not that worried about the war – yet. We’ll see how that holds up when I do the other reviews next week but these are very conservative spreads so we SHOULD have time to adjust if things get worse.
Overall, we spent net $12,287 of our CASH!!! on adjustments and we’re targeting $95,578 in gains next year and that would be 94% – well ahead of our current 66% pace – and of course I’m sure we’ll find some more things to trade between now and then…
| Symbol | Net Cost (Current) | Adjustment Spend / (Credit) | Remaining Upside Potential |
| HELE | $2,425 | $80 | $5,075 |
| PATH | $1,745 | $0 | $3,255 |
| ULCC | $1,175 | $7,000 | $7,525 |
| VFC | $2,760 | $0 | $7,240 |
| ET | $1,760 | ($1,760) | $0 (Cashed out) |
| HRB | $0 | ($425) | $0 (Killed) |
| SAIL | $0 | ($1,840) | $0 (Cashed out) |
| AAL | $0 | ($1,500) | $0 (Cashed out) |
| ARCC | $862 | $0 | $4,138 |
| B | $3,100 | $0 | $3,300 |
| EPD | $5,360 | ($5,360) | $0 (Cashed out) |
| F | $1,911 | $0 | $2,100 |
| GEO | $1,660 | $3,200 | $4,140 |
| HPQ | $3,273 | $0 | $4,727 |
| HPQ2 | $3,490 | $0 | $4,010 |
| NVO | $2,232 | $3,565 | $14,435 |
| OWL | $1,500 | $0 | $3,500 |
| PR | $1,765 | $0 | $735 |
| SOFI | $6,900 | $4,802 | $13,298 |
| SQQQ | $6,092 | $850 | $0 (Hedge) |
| UUUU | $15,900 | $3,675 | $18,100 |
| TOTALS | $63,910 | $12,287 | $95,578 |
As noted in the Compound Rate Calculator above, we are now just 4.2 years away from turning this $101,386 into $1,000,000 at the current pace. Time after time I say I don’t think we can keep this pace up but, time after time, our rate of return keeps increasing – so I’m not going to say anything other than – there’s still plenty of time to get in and have fun with this portfolio!


