

I was on Benzinga's pre-market show this morning.
Here's the Benzinga link:
I gave them a very nice bottom call in /YG, but they stepped all over it while I was talking.
Also talked about yesterday's TXN short play, which I like even more after the way MU was treated this morning.
September 26th, 2019 at 3:50 pm | (Unlocked) | Permalink
P/E for TXN is 23.5 at $120Bn at $128.50 – that's historically high for them. They are pegged to make less money than they did last year but they are up 40% and earnings expectations for Q3 ($1.42) haven't come down since last Q even though chip prices have crashed. Of course TI sold most of their DRAM biz to MU ages ago and 75% of their business is analog semiconductors now but revenues were down 9% last Q and will be down 9% (from last year) again this Q with no end in sight so $130 is silly for them.
As a short on TXN, I'd go for:
- Sell 3 TXN Jan $130 calls for $6.25 ($1,875)
- Buy 5 TXN Jan $140 puts for $14.50 ($7,250)
- Sell 5 TXN Jan $125 puts for $6 ($3,000)
That's net $2,375 on the $7,500 spread so $5,125 (215%) upside potential if TXN is below $125 into Jan. Ordinary margin is $7,179 but hopefully short-term and a nice return either way.
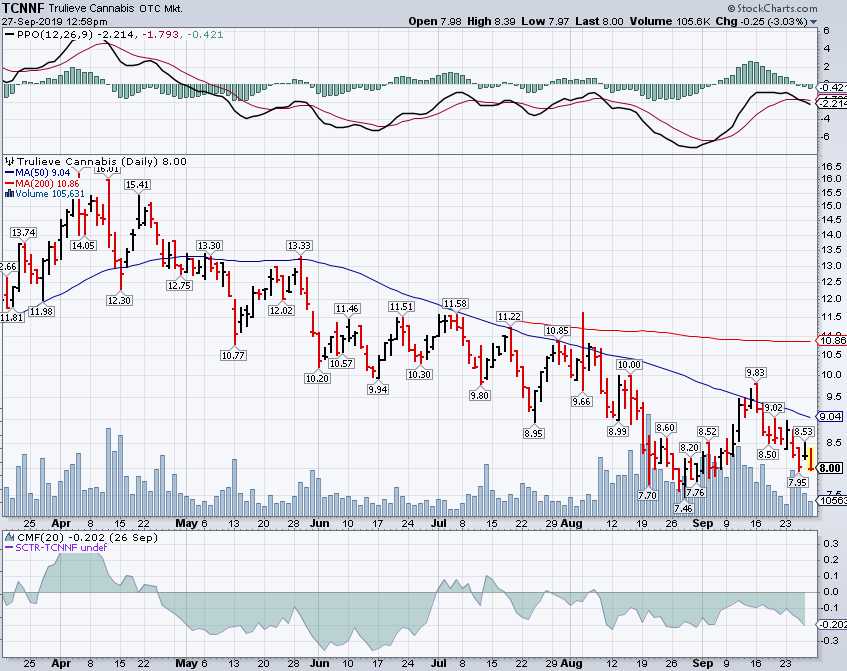
Also, we talked about Truelieve (TCNNF) who are still cheap at $8 (I liked them at $9.15 two weeks ago!). They failed the falling 50 dma but Kim is speaking at a conference on the 2nd in NYC so this might be a good time.
 Check out the quarterly numbers:
| Revenue | 6/30/2019 | 3/31/2019 | 12/31/2018 | 9/30/2018 |
| Total Revenue | 57,920.112 | 44,475.965 | 35,945.457 | 28,325.604 |
| Cost of Revenue | -45,868.393 | 4,364.181 | 2,199.512 | -7,427.494 |
| Gross Profit | 103,788.505 | 40,111.784 | 33,745.945 | 35,753.098 |
| Operating Expenses | ||||
| Research Development | - | - | - | - |
| Selling General and Administrative | 14,519.501 | 11,896.75 | 10,442.113 | 8,041.347 |
| Non Recurring | - | - | - | - |
| Others | - | - | - | - |
| Total Operating Expenses | -29,509.002 | 17,721.768 | 13,131.875 | 914.115 |
| Operating Income or Loss | 87,429.114 | 26,754.197 | 22,813.582 | 27,411.489 |
| Income from Continuing Operations | ||||
| Total Other Income/Expenses Net | -2,185.865 | -1,214.923 | -652.441 | -1,756.244 |
| Earnings Before Interest and Taxes | 87,429.114 | 26,754.197 | 22,813.582 | 27,411.489 |
| Interest Expense | -1,910.064 | -1,225.961 | -691.379 | -372.936 |
| Income Before Tax | 85,243.249 | 25,539.274 | 22,161.141 | 25,655.245 |
| Income Tax Expense | 27,714.464 | 10,837 | 11,441.468 | 8,153.553 |
| Minority Interest | - | - | - | - |
| Net Income From Continuing Ops | 57,528.785 | 14,702.274 | 10,719.673 | 17,501.692 |
$8/share is $883M - I'd buy the whole thing for that price!