
From the start of the bull market back in March 2009 until just recently, oil and the stock market had a seemingly wonderful relationship. Most of the time, when stocks moved higher, oil moved higher as well. On the rare occasion that equities headed lower, oil tagged along to the downside. This wonderful relationship has recently become strained, however, and the two have seemingly chosen to go their separate ways.
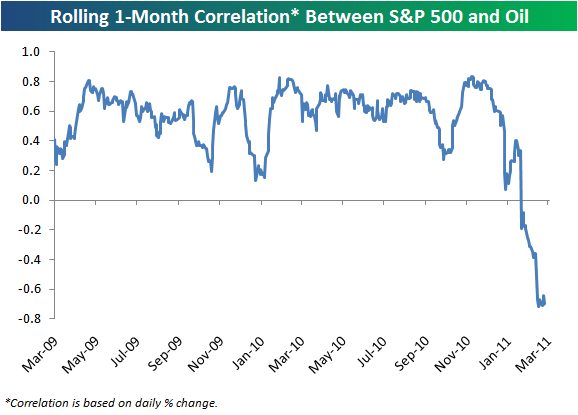
Below is a chart highlighting the rolling 1-month correlation between the S&P 500 and oil (using daily % changes) since the start of the equity bull market on March 9th, 2009. The higher the number on the positive side, the more closely the two are moving together. The lower the number on the negative, the more the two are moving in the opposite direction. As shown, the correlation between the stock market and oil remained positive up until just recently, but the breakup between the two has been swift and extreme. At the moment, the one-month correlation between the two stands at -0.70.
Continue here: Bespoke Investment Group – Think BIG – An Ugly Breakup — A Look at the Relationship Between Oil and Stocks.