

That's the cover of this weekend's Barron's. Unfortunately for Barron's readers, they are 4 days behind my call to buy EWJ as well as my bullish call on the overall market on Tuesday in Member chat, which I reiterated in my BNN interview that evening. We went bargain shopping on Wednesday and picked up the EWJ June $10 calls at .58 and they already powered up to .85 (up 46%) so we took that and ran into the weekend – just in case something blows up (we can always get back in with a hedged position but 46% in 2 days is plenty to start!). We had more bullish trade ideas this week than in any week since early December, when we first broke though 1,225 on the S&P.
Unfortunately, despite the pullback, there are no re-entires on our Secret Santa's Inflation Hedges from late December as they are all in the money and well ahead of the entries. We do have re-loads on our Breakout Defense Part Deux Trades and those can substitute for inflation fighters going forward but we are miles above the original Breakout Defense Virtual Portfolio – which we closed quite some time ago. Once things in Japan do settle down, we'll be ready with a new, bullish virtual portfolio but, at the moment – I'll just be thrilled to see us take back our Major Breakout levels and hold them next week.
Now that we feel better about our Breakout 2 levels holding, it will be a lot easier for us to make long-term commitments where we were hesitant before. Of course there is still plenty to worry about but, if DefCon 3 can't take down the markets – who are we to fret about a little inflation?
Speaking of inflation – let's consider this chart (from Doug Short) and what complete and utter bullshit the CPI is! Very simply, without looking at anything else – it's housing. Housing is 42% of the CPI and declining housing costs have masked rising inflation for 5 years now.
Does a lower price of a new home lower your mortgage payment? Does it lower your monthly rent? Of course not. Not only that but, as many of us have noticed – property taxes are skyrocketing as local governments struggle to offset decreasing income and sales tax revenues and that is not a factor in the CPI either!
Between that and the asinine fact that the Fed excludes food and energy from their calculations of "core" CPI and this index becomes a joke of a joke – but that's the perfect tool for determining our very ridiculous fiscal policies, isn't it? That's all I'm going to say about it though – I'm trying to see how far I can get in this post without getting all pissed about politics. Unfortunately – the more I read – the angrier I get. I'm kind of like The Hulk that way…
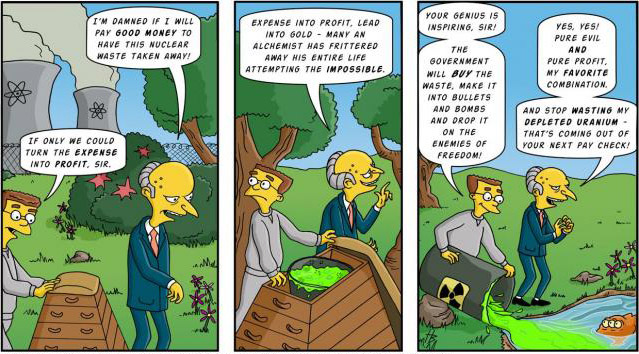
Keep in mind that inflation is pretty much our entire bullish premise as the Global Economy is not really in such good shape but prices do keep rising and that makes Corporate Revenues rise (even if they sell the same number of units) and that makes earnings rise as well – IF they manage to control their input costs. Since Real Estate is still in the dumps, that key cost component is well under control for those businesses still solvent enough to pay their rents. Labor costs, if anything, continue to plunge so – as long as we avoid businesses that are susceptible to commodity input costs – we should do fine. Here's a great chart from ShadowStats giving us a pretty clear picture of just how much out Government is lying to us about inflation:
Again, I say this without anger – I am trying very hard to just point out some of the factors that cause us to think that perhaps it is already too late to be an inflation denier in this economy. We're looking at 8% annual inflation and that is BEFORE all the stimulative policies that have dumped $5Tn of new money onto the US economy and $10Tn onto the Global Economy. The initial swelling of trickle down money goes to the banks to the investing class and then (I do hope this is obvious) into investments like TBills, stocks and commodities and that's how we buy a market rally but stage 2 is much, much more dangerous as the market rally tops out and the top 10% begin to cash out their ill-gotten gains (see Brad DeLong's lecture on inflation).
Once the people who benefited from stock and commodity inflation begin to cash out and buy things – they then begin to send a wave of price inflation, also from the top down, that can hit the lower classes like a tsunami that cannot be stopped. The bottom 90% can't afford to buy homes with a median price of $158,000 at the moment (yes, that's all it is!).
imagine what happens when financial advisors like Goldman begin telling their people to "diversify" back into housing and the top 1% begin to buy 5, 10, 20, 40 homes as investments – driving up the prices for the bottom 99% as they begin flipping homes with each other again. Even worse, this activity quickly leads to an increase in mortgage rates, as the pool of available capital is sucked up by people with the best credit.
Abrupt transition: OK, it's the next day and I'm now bored with inflation and moving on. I wanted to just remind everyone it's still out there and mission accomplished, I hope. Now let's see where today's news flow take us…
 Qaddafi says "everyone gets a gun" so they can defend Libya from the UN. There's a plan that's likely to backfire! US and British forces have begun bombing to cripple Qaddafi's air capability and now he claims he is fighting Al-Qaida while, at the same time saying: "This is a colonialist and crusading aggression." I'm confused already! ZZ made a good point that this is a nice little stimulus program for our defense boys as we lay down 110 $750,000 Tomahawk Missiles on day one so ka-ching for General Dynamics on the reload.
In the other mess we're watching, power is coming back to Fukushima and here's a nice update site from Business Insider. As usual, if I have to only read on paper in life, it has to be the NYTimes, who have an excellent reactor by reactor status report. I was out in NY yesterday and it's amazing how many people are perfectly happy with giving the NYTimes $15 a month for the on-line version. At this point, I think a lot of readers are starting to see the Times as something that needs to be supported – as the list of real news alternatives shrinks every month. Bottom line on the reactors – #4 seems to have a serious leak in the spent fuel pool – they can keep filling it but then they are contaminating the ground.
Already they are finding radioactivity in food as far as 90 miles from the plant (I was thinking about that while I had my sushi last night!). Yukio Edano, the chief cabinet secretary, said that spinach and milk were the only products found to have abnormally high radiation levels. The level of radioactivity found in the spinach would, if consumed for a year, equal the radiation received in a single CAT scan, he said, while that detected in milk would amount to just a fraction of a CAT scan. “These levels do not pose an immediate threat to your health,” Mr. Edano said. “Please stay calm.”
Food safety inspectors said the iodine 131 in the tested milk was up to five times the level the government deems safe, and the spinach had levels more than seven times the safe level. The spinach also contained slightly higher than allowable amounts of cesium 137. Minuscule amounts of radioactive iodine were also detected in the water supply in Tokyo and its five surrounding prefectures. Iodine 131 can be dangerous to human health, especially if absorbed through milk and milk products, because it can accumulate in the thyroid and cause cancer. Cesium 137 can damage cells and lead to an increased risk of cancer.
As an investable premise – we're back to KO again as they bottle water (Dasani, Glaceau) and have the brand trust to be a go-to alternative in a relatively wealthy country like Japan. They took a nice dip below the 50 dma but the 200 dma is rising fast and, of course, it's Coke – so we like them long-term anyway with the 2.9% dividend. You can buy KO for $62.70 and sell the 2013 $60 puts and calls for $14 for net $48.70/54.35, which is pretty good. You can also be more aggressive and buy the 2013 $55 calls for $10 and sell the $55 puts for $4.50 and the May $62.50 calls for $2, which is net $3.50 on the $7.50 spread. Obviously, the plan is to roll the caller a bit higher each quarter but even if KO gets away to the upside, it's still a nice ROI with just $9 of cash and margin used on the trade and your worst case is owning KO at net $58.50.
 Meanwhile, my kids had a sleepover to celebrate the lunar perigee and they all were playing a cool app on their IPhones and IPods which locates werewolves in the vicinity. I had no idea there were so many in our neighborhood but it does explain some of my neighbors… The kids are still too young to watch American Werewolf in London, unfortunately – a totally great film. Other than a drastic increase in lupine activity, the close passage of the moon seems to gone without incident but now we had the 2004 Indonesia earthquake and the Japan one so you can bet that, the next time the moon is closing in on us, people will be very nervous.
Speaking of nervous – Good debate on whether or not economics is a Discipline (or just BS):
The current crisis is not a demand crisis, it is a trust crisis. Bad corporate governance coupled with bad government policies has destroyed the financial sector, scaring investors and freezing lending. It is as if a nuclear bomb had destroyed all roads in America and we claimed that to alleviate the economic impact of such an event we should invest in banks. It is possible that eventually the effect will trickle down. But if the problem is the roads, you want to rebuild roads, not subsidise the financial sector. And if the problem is the financial sector, you want to fix this and not build roads…
This is a good chart that gives us a pretty good idea of what's really wrong with the economy:
Econobrowser has a nice review of price dynamics to remind us what is happening to small business owners as their customers are being driven to poverty. Interestingly, they don't see competition from Large Business as a problem but it's the large businesses that are taking the money from their customers by ratcheting up the cost of necessities – leaving them with little or no disposable income to spend with local businesses.
Along the same lines, there's a paper out titled: "The Sad but True Story of Wages in America" which finds:
- U.S. productivity grew by 62.5% from 1989 to 2010, far more than real hourly wages for both private-sector and state/local government workers, which grew 12% in the same period. Real hourly compensation grew a bit more (20.5% for state/local workers and 17.9% for private-sector workers) but still lagged far behind productivity growth.
- Wage stagnation has hit high school–educated workers harder than college graduates, although both groups have suffered—and a bit more so in the public sector. For example, from 1989 to 2010, real wages for high school-educated workers in the private sector grew by just 4.8%, compared with 2.6% in state government. During the same period, real wages for college graduates in the private sector grew 19.4%, compared with 9.5% in state government.
- The typical worker has had stagnating wages for a long time, despite enjoying some wage growth during the economic recovery of the late 1990s. While productivity grew 80% between 1979 and 2009, the hourly wage of the median worker grew by only 10.1%, with all of this wage growth occurring from 1996 to 2002, reflecting the strong economic recovery of the late 1990s.
- The fading momentum of the 1990s recovery failed to propel real wage gains for college graduates employed by private-sector firms or states from 2002 to 2010, despite productivity growth of 20.2% over the same period.
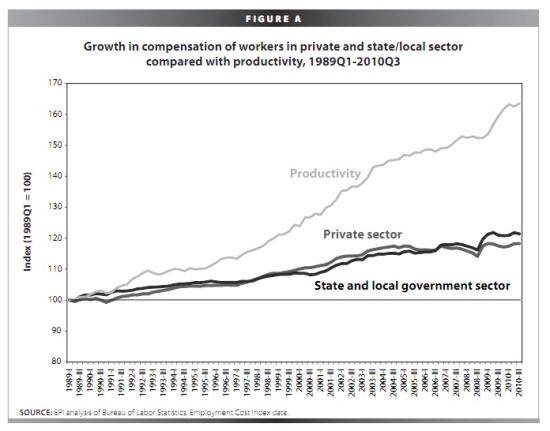 These data underscore that there is a bigger story than public versus private compensation and a more penetrating set of questions to ask than who has more than whom. The ability of the economy to produce more goods and services has not translated into greater compensation for either group of workers. Why has pay fared so poorly overall? Why did the richest 1% of Americans receive 56% of all the income growth between 1989 and 2007, before the recession began (compared with 16% going to the bottom 90% of households)? Why are corporate profits 22% above their pre-recession level while total corporate sector employees’ compensation (reflecting lower employment and meager pay increases) is 3% below pre-recession levels? The answers lie in an economy that is designed to work for the well off and not to produce good jobs and improved living standards.
Essentially, economic policy has not supported good jobs over the last 30 years or so. Rather, the focus has been on policies that were thought to make consumers better off through lower prices: deregulation of industries, privatization of public services, the weakening of labor standards including the minimum wage, erosion of the social safety net, expanding globalization, and the move toward fewer and weaker unions. These policies have served to erode the bargaining power of most workers, widen wage inequality, and deplete access to good jobs. In the last 10 years even workers with a college degree have failed to see any real wage growth.
 Speaking of people getting screwed over by big business:. All roads, of course lead to Goldman and Zach Carter finds GS alumni Mary Kissel is behind the WSJ's campaign to smear Elizabeth Warren. Simon Johnson also follows up on this and, if nothing else, it's a good read on how intwined all this stuff is. As Dealbreaker notes, the "Banking Industry Should Feel Free to Slash, Hip Check General Population into Boards Again."
Liz does need to stop bothering rich people. According to a Fidelity investments survey of more than 1,000 millionaires (households with at least $1 million in investible assets, excluding retirement accounts and real estate), 42% of respondents say they don’t feel wealthy. Keep in mind that while $1 million is the threshold, this group has an average net worth of $3.5 million! Those who don’t feel wealthy were asked how much money they would need to feel wealthy. Their answer: $7.5 million. (That’s the median asset level). But here’s the interesting twist. The 58% of millionaires who did feel wealthy were also asked how much money they had when the began to feel “wealthy.” Their answer: $1.75 million.
 On the other end of the economic spectrum, here's a good run-down in Daily Finance about how screwed up the foreclosure process still is and how difficult it will still be to resolve. Yves Smith sums it up very nicely saying: "The response by the authorities bears disturbing parallels to the Fukushima facility disaster response: a preoccupation with protecting “assets”, meaning the miscreant banks, while putting a much larger community at risk. The stakes were so high and the initial response so visibly insufficient that the prime minister intervened and ordered more aggressive measures be taken. But here, the federal government has cast its lot in with banks and is seeking to muscle the state AGs into line. The reality is that a bailout masquerading as a settlement won’t solve the underlying problem. The powers that be are deluding themselves as to how long it will be before an unaddressed mortgage mess goes critical."
This week we're going to hear a lot about "Supply Chain Disruption" and Friday we get Q4 GDP (again!) – last time it got a huge downward revision to 2.8%, now expected to kick back to 3.1% for some reason. Other fun stuff includes:
—– Monday, March 21st —–
8:30 AM ET: Chicago Fed National Activity Index (February). This is a composite index of other data.
10:00 AM: Existing Home Sales for February from the National Association of Realtors (NAR). The consensus is for sales of 5.15 million at a Seasonally Adjusted Annual Rate (SAAR) in February, down from 5.36 million SAAR in January.
This graph shows existing home sales, on a Seasonally Adjusted Annual Rate (SAAR) basis since 1993.
Housing economist Tom Lawler isforecasting a decline to 5 millon (SAAR) in February. This would put the months-of-supply in the low 8 months range.
Note: the NAR is working on benchmarking existing home sales for previous years with other industry data (expectations are for large downward revisions). These revisions are expected to be announced mid-year.
—– Tuesday, March 22nd —–
8:00 AM: Cleveland Fed President Sandra Pianalto will speak at the University of Akron Economic Summit "The Economy: 2011 and Beyond."
10:00 AM: FHFA House Price Index for January. This is based on GSE repeat sales and is no longer as closely followed as Case-Shiller (or CoreLogic).
10:00 AM: Richmond Fed Manufacturing Survey for March. The consensus is for a slight decrease to 24 from 25 in February.
—– Wednesday, March 23rd —–
Early: The AIA's Architecture Billings Index for February (a leading indicator for commercial real estate).
This graph shows the Architecture Billings Index since 1996. The index showed billings were at the same level in January as in December (at 50).
This index usually leads investment in non-residential structures (hotels, malls, office) by 9 to 12 months.
7:00 AM: The Mortgage Bankers Association (MBA) will release the mortgage purchase applications index. This index has been very weak over the last couple months suggesting weak home sales through the first few months of 2011.
10:00 AM: New Home Sales for February from the Census Bureau. The consensus is for an increase in sales to 290 thousand (SAAR) in February from 284 thousand in January.
This graph shows New Home Sales since 1963. The dashed line is the current sales rate.
New home sales collapsed in May and have averaged only 293 thousand (SAAR) over the last nine months. Prior to the last nine months, the record low was 338 thousand in Sept 1981.
12:00 PM: Fed Chairman Ben Bernanke will speak at the Independent Community Bankers of America National Convention and Techworld, San Diego, California "Community Banking in a Period of Recovery and Change"
—– Thursday, March 24th —–
8:30 AM: The initial weekly unemployment claims report will be released. The consensus is for a decrease to 383,000 from 385,000 last week.
8:30 AM: Durable Goods Orders for February from the Census Bureau. The consensus is for a 1.5% increase in durable goods orders after increasing 2.7% in January.
7:30 PM: Fed Governor Elizabeth Duke will speak at the Virginia Association of Economists Sandridge Lecture, Richmond, Virginia "Changing Circumstances: The Impact of the Financial Crisis on Wealth"
—– Friday, March 25th —–
8:30 AM: Gross Domestic Product, 4th quarter 2010 (third estimate);
Corporate Profits, 4th quarter 2010. This is the third estimate for Q4 from the BEA, and the consensus is for real GDP growth to be revised to an increase of 3.1% annualized from the second estimate of 2.8%.
9:55 AM: Reuter's/University of Michigan's Consumer sentiment index(final for March). The consensus is for a decrease to 68.0 from the preliminary reading of 68.2. This has declined because of higher gasoline prices, and possibly world events.
10:00 AM: Regional and State Employment and Unemployment for February 2011
12:00 PM: Industrial Production and Capacity Utilization (Annual Revision)
Note: Speeches from Philadelphia Fed President Charles Plosser, Minneapolis Fed President Narayana Kocherlakota, and Atlanta Fed president Dennis Lockhart.