

Reminder: Sabrient is available to chat with Members, comments are found below each post.
Courtesy of Sabrient Systems and Gradient Analytics
Whoa, big fella. That’s what the newly vocal bears had to say to the overly aggressive bulls, as a slew of weak earnings reports put a damper on the party. Last week, it seemed that stocks were determined to rally even without traditional leadership from the Technology sector. But alas the spillover from Tech into most other sectors, although mostly expected judging by Wall Street’s continual cuts in earnings estimates (as reflected in Sabrient’s SectorCast model), was too much to overcome.
Google (GOOG) put a scare into everyone when their disappointing report inadvertently came out during market hours instead of afterhours as planned. Even market darling Apple (AAPL) failed to inspire after unveiling its new mini iPad. They joined previous weak reports from Intel (INTC) and IBM (IBM). Marvell Technology (MRVL), Advanced Micro Devices (AMD), Juniper Networks (JNPR), Netflix (NFLX), and F5 Networks (FFIV) have all piled on to add to the Tech woes.
Okay, so we knew that Tech had relinquished its leadership position. But unfortunately what has followed has been disappointment after disappointment from the Industrial, Materials, and Energy sectors, including bellwethers 3M (MMM), United Parcel Service (UPS), Caterpillar (CAT), DuPont (DD), General Electric (GE), and United Technologies (UTX).
In its Morning Briefing on Wednesday, ConvergEx lamented a lack of market breadth in that six of the 30 Dow Jones Industrials (20%) have accounted for two-thirds (66%) of the index’s 7% gain so far this year. Those six are Home Depot (HD), Wal-Mart (WMT), Disney (DIS), The Travelers (TRV), JP Morgan Chase (JPM), and Bank of America (BAC)—i.e., Consumer Discretionary and Financial stocks, which have been the leading sectors. The big Energy and Industrial sector names have contributed very little. Likewise, the S&P 500 is up a little over 12% YTD, but 20% of that gain comes from one mega-cap stock—Apple (AAPL), which is up about 50% YTD even after its recent fall.
This market correction has been a dose of reality. So, where does it go from here? The encouraging news in consumer sentiment, spending, and housing could support investor sentiment right through the holidays. But on the other hand, corporate earnings are weak and the Fiscal Cliff looms ahead, while Europe and China continue to struggle with their economies. And then there is speculation about the fate of Fed Chairman Bernanke no matter who wins the presidential election, which creates even more uncertainty for a stock market that hates uncertainty.
And speaking of the Fed, now that it has gone “all in” with unlimited QE, the market can no longer trade on Fed speculation. Now it’s all about the reality of global economic health, business fundamentals, corporate earnings growth, fiscal policy…and jobs.
The S&P 500 SPDR Trust (SPY) closed Wednesday at 141.02. Looking at the chart, price has now broken down through support levels at its 50-day simple moving average, the bottom of the bullish rising channel that has been in place since the rally started at the beginning of June, and the sideways trading channel between 143 and 147.
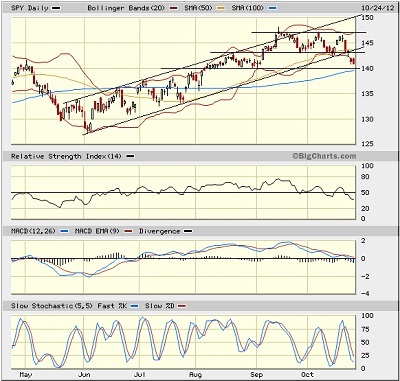
Oscillators RSI, MACD, and Slow Stochastic have all cycled back down in a hurry and might be looking to turn up again soon. We can see the 100-day simple moving average is now converging with prior August support at 140, which is just below the current price, followed by the 200-day SMA near 138, which should provide very strong support. I still think we could see a rally into the presidential election—perhaps back to the top of the sideways channel (which now runs between 140 and 147), where it might yet try to position itself for a post-election breakout.
The CBOE Market Volatility Index (VIX), a.k.a. “fear gauge,” closed Wednesday at 18.33, which is still low by historical standards. The 20 level has been a key level of support and resistance this year. Overall, it remains bullish for stocks.
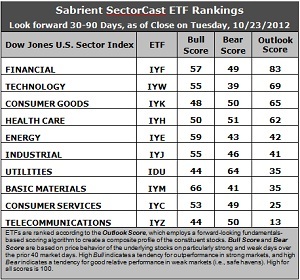
Latest rankings: The table ranks each of the ten U.S. industrial sector iShares (ETFs) by Sabrient’s proprietary Outlook Score, which employs a forward-looking, fundamentals-based, quantitative algorithm to create a bottom-up composite profile of the constituent stocks within the ETF. In addition, the table also shows Sabrient’s proprietary Bull Score and Bear Score for each ETF.
High Bull score indicates that stocks within the ETF have tended recently toward relative outperformance during particularly strong market periods, while a high Bear score indicates that stocks within the ETF have tended to hold up relatively well during particularly weak market periods. Bull and Bear are backward-looking indicators of recent sentiment trend.
As a group, these three scores can be quite helpful for positioning a portfolio for a given set of anticipated market conditions.
Observations:
1. Overall, the Outlook rankings remain neutral. Financial (IYF) retains the top spot with an Outlook score of 83, as stocks within the sector continue to be supported by Wall Street raising earnings estimates. It has a reasonably low forward P/E and strong return on sales, although its return on assets and return on equity are on the low side. In the second spot is Technology (IYW) at 69. Its score has been falling as Wall Street continues to hammer away at earnings projections, although IYW still displays an impressive combination of low forward P/Es, strong projected long-term growth, and solid return ratios.
2. Healthcare (IYH) has lost the third spot to defensive sector Consumer Goods (IYK). IYK scores 65 while IYH falls to 62, primarily due to analyst reductions in earnings estimates. It’s hard to know how much of that is due to Obama vs. Romney election odds and the resulting impact on healthcare companies.
3. Telecom (IYZ) stays at the bottom of the Outlook rankings with an Outlook score of 13. Stocks within the sector remain burdened by the highest forward P/Es and the worst return ratios, plus net downgrades from Wall Street. Basic Materials (IYM) has climbed out of the bottom two, primarily because Wall Street has been letting up on its continual cuts in earnings expectations. Consumer Services (IYC) now finds itself in the bottom two as Wall Street has been taking some shots at its future earnings—the sector had been performing quite well and perhaps had gotten ahead of itself.
4. Looking at the Bull scores, Materials (IYM) is the clear leader on strong market days, scoring 66. Utilities (IDU) is still the weakest on strong market days, scoring 44. In other words, Materials stocks have tended to perform the best when the market is rallying, while Utilities stocks have lagged.
5. Looking at the Bear scores, Utilities (IDU) has returned as the clear investor safe haven on weak market days, scoring 64, which is far ahead of second-place IYH at 51. Technology (IYW) remains the weakling during market weakness, as reflected by its low Bear score of 39, followed by IYM at 41. In other words, Tech stocks have been selling off the most lately when the market is pulling back, while Utilities stocks have held up the best.
6. Overall, Financial (IYF) shows the best all-weather combination of Outlook/Bull/Bear scores. Adding up the three scores gives a commanding total of 189. Telecom (IYZ) is the worst at 107. As for Bull/Bear combination, Utilities (IDU) is suddenly showing the best score of 108, followed closely by Materials (IYM) at 107, while Technology (IYW) and Telecom (IYZ) share the worst combined score of 94.
These scores represent the view that the Financial and Technology sectors may be relatively undervalued overall, while Telecom and Consumer Services sectors may be relatively overvalued based on our 1-3 month forward look.
Top-ranked stocks within IYF and IYW include M&T Bank (MTB), PartnerRe Ltd (PRE), Cerner (CERN), and VMware (VMW).
Disclosure: Author has no positions in stocks or ETFs mentioned.
About SectorCast: Rankings are based on Sabrient’s SectorCast model, which builds a composite profile of each equity ETF based on bottom-up aggregate scoring of the constituent stocks. The Outlook Score employs a fundamentals-based multi-factor approach considering forward valuation, earnings growth prospects, Wall Street analysts’ consensus revisions, accounting practices, and various return ratios. It has tested to be highly predictive for identifying the best (most undervalued) and worst (most overvalued) sectors, with a 1-3 month forward look.
Bull Score and Bear Score are based on the price behavior of the underlying stocks on particularly strong and weak days during the prior 40 market days. They reflect investor sentiment toward the stocks (on a relative basis) as either aggressive plays or safe havens. So, a high Bull score indicates that stocks within the ETF have tended recently toward relative outperformance during particularly strong market periods, while a high Bear score indicates that stocks within the ETF have tended to hold up relatively well during particularly weak market periods.
Thus, ETFs with high Bull scores generally perform better when the market is hot, ETFs with high Bear scores generally perform better when the market is weak, and ETFs with high Outlook scores generally perform well over time in various market conditions.
Of course, each ETF has a unique set of constituent stocks, so the sectors represented will score differently depending upon which set of ETFs is used. For Sector Detector, I use ten iShares ETFs representing the major U.S. business sectors.
About Trading Strategies: There are various ways to trade these rankings. First, you might run a sector rotation strategy in which you buy long the top 2-4 ETFs from SectorCast-ETF, rebalancing either on a fixed schedule (e.g., monthly or quarterly) or when the rankings change significantly. Another alternative is to enhance a position in the SPDR Trust exchange-traded fund (SPY) depending upon your market bias. If you are bullish on the broad market, you can go long the SPY and enhance it with additional long positions in the top-ranked sector ETFs. Conversely, if you are bearish and short (or buy puts on) the SPY, you could also consider shorting the two lowest-ranked sector ETFs to enhance your short bias.
However, if you prefer not to bet on market direction, you could try a market-neutral, long/short trade—that is, go long (or buy call options on) the top-ranked ETFs and short (or buy put options on) the lowest-ranked ETFs. And here’s a more aggressive strategy to consider: You might trade some of the highest and lowest ranked stocks from within those top and bottom-ranked ETFs.