

Courtesy of Sabrient Systems and Gradient Analytics
 For most of 2013 thus far, the market has been on a steady rise without volatility within a narrow channel. Bulls have been looking to recruit reinforcements for their assault on the all-time highs on the S&P 500 large caps and Dow Jones blue chips, after already taking out the all-time highs on the Russell 2000 small caps and S&P 400 mid caps. All they needed was a new entry point to shake out some weak momentum-riders and attract fresh investment capital. Well, it appears they finally got one.
Was that the extent of it? Perhaps. I suspected that the 1500 level on the S&P 500 would be vigorously defended, and it was, despite a brief violation of support.
Now, the technical picture once again is showing stocks poised for continued strength. However, Sabrient’s fundamentals-based SectorCast rankings from Tuesday have taken a slightly defensive turn compared with the gradually bullish trend of the past couple of weeks – but overall they remain bullish.
The market has shown some elevated volume and volatility over the past several sessions. It all started last Wednesday when the FOMC minutes hinted that some members thought the bond-buying program should be scaled back sooner than planned. Then Italy’s anti-austerity vote and the perceived negative impact on the eurozone’s recovery from its debt crisis led to Monday’s market plunge, which was the biggest one-day drop since November. But Wednesday’s performance was the best day for the Dow since the first day of the year.
Bulls got some confidence back when Fed Chairman Bernanke made it clear in his Congressional testimony that the money spigot is firmly soldered in the open position, and new economic data showed continued progress (including a surge in “core capex” from the January durable goods report). And as for Italy, they had a successful bond auction which suggested perhaps rates aren’t going to jump radically in response to the election, plus ECB President Draghi reaffirmed his commitment to the eurozone crisis measures.
Over the past several years, the average investor has been forced to learn a new vocabulary. Terms like “collateralized debt obligations,” “sovereign debt,” “quantitative easing,” “fiscal cliff,” and now “sequestration.” And each time a new term is introduced, the media repeats it over and over again until we just can’t stand it anymore. I used to think that sequestration was the isolation of a jury during a trial, but now I’m told that it refers to the automatic across-the-board budget cuts in the event that Congress can’t agree on a Federal budget by Friday.
The sequester is slated to cut Federal spending by $85 billion in fiscal 2013 (which ends on September 30), and there is a lot of fear-mongering going on about the severity and impact of this. But the drag on the economy in 2013 is forecast to be only about 0.5% of GDP, and there are ways Congress can manipulate it through the timing of expense and revenue events.
I know that a lot of market observers are complaining that incessant Wall Street cheerleading has kept an “irrational” rally in gear. But, to me, the trend is up and there are plenty reasons for it. In fact, this could well be the beginning of a sustained bull run, at least to challenge the all-time highs on the S&P 500 around 1576. The economy is improving, corporate earnings are beating estimates, corporate cash is plentiful, and valuations are still attractive. Although the bull run commenced with the V-bottom off the March 2009 lows, it was more of a relief rally at first as it became evident that we weren’t entering financial system Armageddon. Then, the continuation of the stock rally was driven by quantitative easing programs coupled with a lack of any attractive alternative investments. Now we appear to be entering an actual economic expansion phase.
With over 90% of the S&P 500 companies having reported 4Q earnings results so far, 70% beat expectations, which is well above average. 4Q quarter-over-quarter earnings are projected to show a rise of around 7%, which is above the forecast of 2% at the start of the earnings season and the Q3 growth rate of 2.5%. Analyst consensus says that the Financial sector will continue as the leader.
The S&P500 SPDR Trust (SPY) closed Wednesday at 151.91, which is basically where it was last Wednesday. After the elevated volume and volatility of the past several sessions, oscillators RSI, MACD, and Slow Stochastic have each worked off most of their overbought conditions. SPY seems to have its sights set on reentering the narrow rising bullish channel that had been in place since the New Year. The 150 level appears to have provided the strong support I expected. Lower levels of strong support are shown on the chart, and include the rising 50- and 100-day simple moving averages.
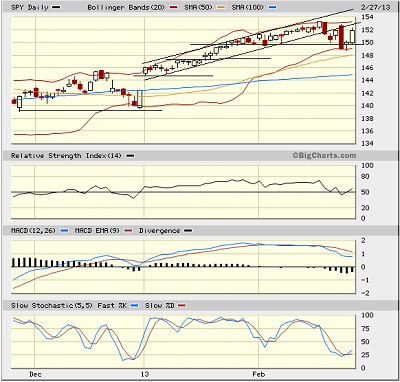
After acting like a yo-yo the past few days, the CBOE Market Volatility Index (VIX), a.k.a. “fear gauge,” closed Wednesday at 14.73, which is about where it was last Wednesday. After a quick spike to 19 on Monday, VIX is back below 15.
Latest rankings: The table ranks each of the ten U.S. industrial sector iShares ETFs by Sabrient’s proprietary Outlook Score, which employs a forward-looking, fundamentals-based, quantitative algorithm to create a bottom-up composite profile of the constituent stocks within the ETF. The multi-factor model considers forward valuation, historical earnings trends, earnings growth prospects, the dynamics of Wall Street analysts’ consensus estimates, accounting practices and earnings quality, and various return ratios. In addition, the table also shows Sabrient’s proprietary Bull Score and Bear Score for each ETF.
High Bull score indicates that stocks within the ETF have tended recently toward relative outperformance during particularly strong market periods, while a high Bear score indicates that stocks within the ETF have tended to hold up relatively well during particularly weak market periods. Bull and Bear are backward-looking indicators of recent sentiment trend.
As a group, these three scores can be quite helpful for positioning a portfolio for a given set of anticipated market conditions.
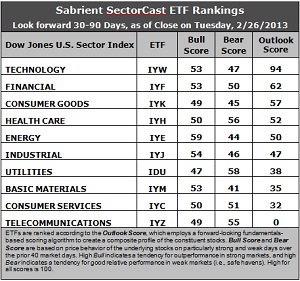
Observations:
1. Technology (IYW) has set itself apart from the pack in a big way, with a very impressive Outlook score of 94 (Say what?!). Financial (IYF) stays in second place with a 62, but its score has been steadily dropping. Healthcare (IYH) drops to fourth this week as its Outlook score fell by 15 points, while Consumer Goods (IYK) moves up to third, even though its score hasn’t really changed. IYW now boasts the lowest forward P/E, strong projected growth, the best return ratios, and the most support from Wall Street analysts. IYF displays the second best forward P/E and the second most support from Wall Street.
2. Telecom (IYZ) stays in the cellar, as its Outlook score has gone all the way to zero. It has the least support among Wall Street analysts, the worst return ratios, the highest (worst) forward P/E, and a reduced projected growth rate. It is joined in the bottom two this week by Consumer Services (IYC) with a score of 32.
3. Overall, this week’s rankings have taken a slightly defensive turn, given the lower scores in Financial (IYF) and Industrial (IYJ). The top five now includes defensive sectors Healthcare (IYH) and Consumer Goods (IYK). On the other hand, the top-bottom spread of 94 is about as big as it can get, which theoretically reflects greater conviction. However, the middle eight sectors only show a range of 30 – so it’s really only the top and bottom that are showing a definitive spread.
4. Looking at the Bull scores, Energy (IYE) is again the leader on strong market days, scoring 59, while defensive sector Utilities (IDU) is the laggard on strong market days, scoring 47.
5. Looking at the Bear scores, Utilities (IDU) is serving as the favorite “safe haven” on weak market days, scoring 58, while Basic Materials (IYM) is the worst during market weakness, as reflected in its low Bear score of 41. Five sectors are now scoring at or above 50, which is a positive development as certain sectors (including Financial) are holding up better than others, rather than mass across-the-board selling on weakness.
6. Overall, Technology (IYW) shows the best all-weather combination of Outlook/Bull/Bear scores. Adding up the three scores gives a total of 194. Telecom (IYZ) is by far the worst at 104. Looking at just the Bull/Bear combination, defensive sectors are showing the best scores, starting with Healthcare (IYH) at 106, followed by Utilities (IDU) at 105. Materials (IYM) displays the lowest at 94. This indicates that Healthcare and Utilities stocks have tended to perform the best in all market conditions.
These scores represent the view that the Technology and Financial sectors may be relatively undervalued overall, while Telecom and Consumer Services sectors may be relatively overvalued based on our 1-3 month forward look.
Top-ranked stocks within Technology and Financial include Priceline (PCLN), SolarWinds (SWI), Berkshire Hathaway (BRK.B), and Bank of America (BAC). By the way, I wrote a piece at the end of 2012 about SPDR S&P Regional Banking ETF (KRE) being a good ETF for the first quarter, and it has been performing well. I think it will continue to do so.
Disclosure: Author has no positions in stocks or ETFs mentioned.
About SectorCast: Rankings are based on Sabrient’s SectorCast model, which builds a composite profile of each equity ETF based on bottom-up aggregate scoring of the constituent stocks. The Outlook Score employs a fundamentals-based multi-factor approach considering forward valuation, earnings growth prospects, Wall Street analysts’ consensus revisions, accounting practices, and various return ratios. It has tested to be highly predictive for identifying the best (most undervalued) and worst (most overvalued) sectors, with a 1-3 month forward look.
Bull Score and Bear Score are based on the price behavior of the underlying stocks on particularly strong and weak days during the prior 40 market days. They reflect investor sentiment toward the stocks (on a relative basis) as either aggressive plays or safe havens. So, a high Bull score indicates that stocks within the ETF have tended recently toward relative outperformance during particularly strong market periods, while a high Bear score indicates that stocks within the ETF have tended to hold up relatively well during particularly weak market periods.
Thus, ETFs with high Bull scores generally perform better when the market is hot, ETFs with high Bear scores generally perform better when the market is weak, and ETFs with high Outlook scores generally perform well over time in various market conditions.
Of course, each ETF has a unique set of constituent stocks, so the sectors represented will score differently depending upon which set of ETFs is used. For Sector Detector, I use ten iShares ETFs representing the major U.S. business sectors.
About Trading Strategies: There are various ways to trade these rankings. First, you might run a sector rotation strategy in which you buy long the top 2-4 ETFs from SectorCast-ETF, rebalancing either on a fixed schedule (e.g., monthly or quarterly) or when the rankings change significantly. Another alternative is to enhance a position in the SPDR Trust exchange-traded fund (SPY) depending upon your market bias. If you are bullish on the broad market, you can go long the SPY and enhance it with additional long positions in the top-ranked sector ETFs. Conversely, if you are bearish and short (or buy puts on) the SPY, you could also consider shorting the two lowest-ranked sector ETFs to enhance your short bias.
However, if you prefer not to bet on market direction, you could try a market-neutral, long/short trade—that is, go long (or buy call options on) the top-ranked ETFs and short (or buy put options on) the lowest-ranked ETFs. And here’s a more aggressive strategy to consider: You might trade some of the highest and lowest ranked stocks from within those top and bottom-ranked ETFs.