

Courtesy of Sabrient Systems and Gradient Analytics
 Cash flush investors who have been waiting for a buying opportunity must be feeling like the guy standing outside the sold-out concert looking for someone willing to sell him a ticket. Stocks just won’t pull back much, despite a huge wall of worry that one might expect would put some quicksand under the bulls’ feet. That recent test of support at 1500 on the S&P 500 was quickly bought as expected, and now bulls have their sights set on the all-time closing high of 1565. To borrow from Thomas Paine, bulls are challenging investors to “lead, follow, or get out of the way.”
As you know, the Federal sequester has kicked in, but the immediate impacts will be muted initially, as investors knew all along, despite hyperbole from the Administration and the media. Most of the spending “cuts” are not cuts at all, but merely reductions in budgetary increases. Sure, these will have real impact as costs faced by the impacted departments and programs continue to rise, but those impacts are gradual, giving our elected officials more time to figure out a solution. More urgent is yet another confrontation with the debt ceiling.
Also, we have 13 million Americans out of work, wages for those who do have jobs are stagnant, spending power took a hit with the increased payroll tax, gas prices are sky high, Italy is taking over from Greece as the big threat to European recovery, the world is in an unprecedented currency war (the “race to debase”), and our elected officials can’t agree on anything long enough to get out of the way of a struggling economy. To use another quotation from Thomas Paine, “Government, even in its best state, is but a necessary evil; in its worst state, an intolerable one.” Where do we think it falls today on that scale?
Nevertheless, bulls have been undeterred. On the positive side of the equation, the Fed’s mortgage-backed securities purchase program continues to inject massive liquidity into the financial system, and much of it finds its way into equities. But that’s not to say equities are being pumped up irrationally. Stock valuations are still entirely reasonable (even low), from a historical standpoint. In fact, there is still a substantial risk premium in equities, as their cash flow yield around 7% has now surpassed the average junk bond yield, and the average dividend yield among blue chips remains quite high.
In addition, consumer confidence is relatively muted compared with its extreme highs in October 2007 when stocks were last at these price levels. Want more? Well, we got that recent technical consolidation (and bullish entry point) and the trend is up. The economy is showing signs of improvement, corporate earnings are beating estimates (at a higher-than-average rate), and sideline cash is plentiful. M&A activity and stock buybacks are vibrant, and investment capital continues to flow into both equities and bonds. In fact, stocks have been able to stay strong even while the US dollar strengthens, which is a testament to the strong bullish conviction.
Yes, the bulls are firmly in charge and equities remain well-positioned to attract new investors. In fact, BlackRock reported that February inflows into exchange-traded products continued the momentum from the strong January start to 2013, as $10.6 billion went into equity products. Real Estate-focused funds were a favorite among sector investors as housing continues to improve. Fixed Income also saw net gains, although it was focused on shorter-term maturities, while Gold-oriented funds continued to see net outflows.
The monthly employment reports on Wednesday and Friday may provide the next catalyst for stocks to challenge their final obstacle: the all-time closing high for the S&P 500 of 1565 from October 2007.
The technical picture remains strong, and Sabrient’s fundamentals-based SectorCast rankings still display a slightly bullish bias overall, despite a continuation of the defensive trend.
The S&P500 SPDR Trust (SPY) closed Wednesday at 154.50. Oscillators RSI, MACD, and Slow Stochastic are moving back toward overbought territory, but price can go a lot further yet. I said last week that SPY seemed to have its sights set on reentering the narrow rising bullish channel that had been in place since the New Year, and that is exactly what has happened. The 150 level is rock-solid support, and the rising 50-day simple moving average is now converging with it, so beware of any confirmed failure at this level. Lower levels of strong support are shown on the chart near 147, 145, and 140. Low trading volume is about the only weakness I see.
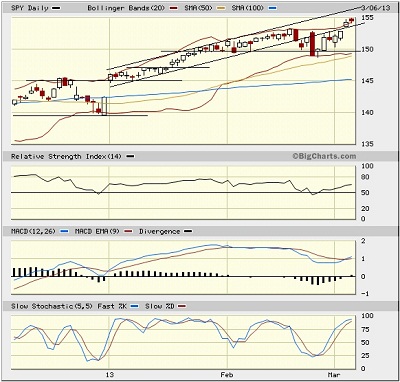
The CBOE Market Volatility Index (VIX), a.k.a. “fear gauge,” closed Wednesday at 13.53. It is back to full-on complacency.
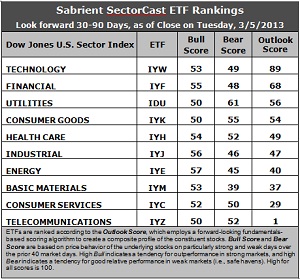
Latest rankings: The table ranks each of the ten U.S. industrial sector iShares ETFs by Sabrient’s proprietary Outlook Score, which employs a forward-looking, fundamentals-based, quantitative algorithm to create a bottom-up composite profile of the constituent stocks within the ETF. The multi-factor model considers forward valuation, historical earnings trends, earnings growth prospects, the dynamics of Wall Street analysts’ consensus estimates, accounting practices and earnings quality, and various return ratios. In addition, the table also shows Sabrient’s proprietary Bull Score and Bear Score for each ETF.
High Bull score indicates that stocks within the ETF have tended recently toward relative outperformance during particularly strong market periods, while a high Bear score indicates that stocks within the ETF have tended to hold up relatively well during particularly weak market periods. Bull and Bear are backward-looking indicators of recent sentiment trend.
As a group, these three scores can be quite helpful for positioning a portfolio for a given set of anticipated market conditions.
Observations:
1. Technology (IYW) continues to sit well above the others, with an impressive Outlook score of 89, which is down from last week’s absurdly high score of 94. Financial (IYF) remains in second place with a 68, as its score has finally bounced back a bit. IYW boasts a low forward P/E, solid support from Wall Street analysts, strong projected growth, and the best return ratios. IYF also displays a low forward P/E and solid support from Wall Street, and has a reasonable projected growth rate.
2. Telecom (IYZ) stays in the cellar with an Outlook score of 1. It has the least support among Wall Street analysts, the worst return ratios, the highest (worst) forward P/E, and a falling projected growth rate. It is joined in the bottom two by Consumer Services (IYC) with a score of 29.
3. Overall, this week’s rankings have taken even more of defensive turn given that three of the top five are defensive sectors, and only four sectors are scoring above 50. Utilities (IDU) vaulted from seventh to third with an 18-point rise in its Outlook score, followed closely by Consumer Goods (IYK) and Healthcare (IYH), while economically-sensitive sectors Industrials (IYJ), Basic Materials (IYM), and Consumer Services (IYC) reside in the bottom half. However, when I look closely at the numbers behind the scores, there are only minor differences in the net Wall Street earnings revisions as very little has been adjusted lately, which allows the rankings to fluctuate more readily. Also, the top-bottom spread of 88 points is still quite wide, which theoretically reflects greater conviction and is a bullish indication. Overall, I still think the rankings display a slightly bullish bias.
4. Looking at the Bull scores, Energy (IYE) is again the leader on strong market days, scoring 57, followed closely by Industrial (IYJ). Defensive sectors Utilities (IDU) and Telecom (IYZ) are the laggards on strong market days, scoring 50. It’s notable to me that all ten sectors show Bull scores of 50 or higher, and top-bottom spread of 7 points, which indicates relatively high correlation (all boats lifted) on strong days.
5. Looking at the Bear scores, Utilities (IDU) is serving as the favorite “safe haven” on weak market days, scoring 61, while Basic Materials (IYM) is the worst during market weakness, as reflected in its low Bear score of 39. The top-bottom spread is now a healthy 22 points, and indicates lower correlation on weak days.
6. Overall, Technology (IYW) shows the best all-weather combination of Outlook/Bull/Bear scores. Adding up the three scores gives a total of 191. Telecom (IYZ) is by far the worst at 103. Looking at just the Bull/Bear combination, defensive sector Utilities (IDU) has sprung to the front with an impressive total score of 111, followed by two more defensive sectors, IYH and IYK. Materials (IYM) displays by far the lowest score at 92. This indicates that Utilities stocks have tended to perform the best lately in all market conditions.
These Outlook scores represent the view that Technology and Financial sectors may be relatively undervalued overall, while Telecom and Consumer Services sectors may be relatively overvalued based on our 1-3 month forward look.
Top-ranked stocks within Technology and Financial include Cognizant Technology Solutions (CTSH), QUALCOMM (QCOM), The Travelers Companies (TRV), and BlackRock (BLK).
Disclosure: Author has no positions in stocks or ETFs mentioned.
About SectorCast: Rankings are based on Sabrient’s SectorCast model, which builds a composite profile of each equity ETF based on bottom-up aggregate scoring of the constituent stocks. The Outlook Score employs a fundamentals-based multi-factor approach considering forward valuation, earnings growth prospects, Wall Street analysts’ consensus revisions, accounting practices, and various return ratios. It has tested to be highly predictive for identifying the best (most undervalued) and worst (most overvalued) sectors, with a 1-3 month forward look.
Bull Score and Bear Score are based on the price behavior of the underlying stocks on particularly strong and weak days during the prior 40 market days. They reflect investor sentiment toward the stocks (on a relative basis) as either aggressive plays or safe havens. So, a high Bull score indicates that stocks within the ETF have tended recently toward relative outperformance during particularly strong market periods, while a high Bear score indicates that stocks within the ETF have tended to hold up relatively well during particularly weak market periods.
Thus, ETFs with high Bull scores generally perform better when the market is hot, ETFs with high Bear scores generally perform better when the market is weak, and ETFs with high Outlook scores generally perform well over time in various market conditions.
Of course, each ETF has a unique set of constituent stocks, so the sectors represented will score differently depending upon which set of ETFs is used. For Sector Detector, I use ten iShares ETFs representing the major U.S. business sectors.
About Trading Strategies: There are various ways to trade these rankings. First, you might run a sector rotation strategy in which you buy long the top 2-4 ETFs from SectorCast-ETF, rebalancing either on a fixed schedule (e.g., monthly or quarterly) or when the rankings change significantly. Another alternative is to enhance a position in the SPDR Trust exchange-traded fund (SPY) depending upon your market bias. If you are bullish on the broad market, you can go long the SPY and enhance it with additional long positions in the top-ranked sector ETFs. Conversely, if you are bearish and short (or buy puts on) the SPY, you could also consider shorting the two lowest-ranked sector ETFs to enhance your short bias.
However, if you prefer not to bet on market direction, you could try a market-neutral, long/short trade—that is, go long (or buy call options on) the top-ranked ETFs and short (or buy put options on) the lowest-ranked ETFs. And here’s a more aggressive strategy to consider: You might trade some of the highest and lowest ranked stocks from within those top and bottom-ranked ETFs.