

Courtesy of Sabrient Systems and Gradient Analytics
 Last week, I talked about the impressive strength this year in the Dow Jones Transportation Average, but it since has been hit by investors’ renewed worries about global economic growth and financial stability. Its fall has been led by weakness in the airlines.
The bad news has included weaker than expected reports here at home on non-farm payrolls, manufacturing and services indexes, and oil demand, along with precedent-setting fixes in Cyprus and bellicose rhetoric out of North Korea – a country that increasingly has become a bizarre caricature of itself. All of us who thought the young heir with the Western education might decide to feed his people and seek to become a member of the global economy have been proven sadly mistaken.
Some end-of-quarter institutional buying last week with “new money” probably got quickly liquidated this week. It’s understandable for investors to be skittish when the S&P 500 just set a new all-time high but had not yet confirmed the breakout, coupled with the uninspiring news and market commentators screaming for an imminent correction. New money trying to join the bandwagon usually becomes hot money when the breakout fails.
The iShares Dow Jones Transportation Index Fund (IYT) is down nearly 5% this week (through Wednesday) and sitting right on its 50-day simple moving average. Homebuilders also have taken a hit, as another big winner joins in the profit-taking fervor. The SPDR S&P Homebuilders ETF (XHB) fell below its 50-day SMA and is also down 5% this week.
Not surprisingly, the higher-beta small caps are struggling. The iShares Russell 2000 Index Fund (IWM) violated its 50-day SMA on Wednesday and is down 3.5% this week. Among the 10 business sectors, Basic Materials and Energy have led to the downside this week, while Healthcare has held up the best. Healthcare now stands alone as the leading sector in year-to-date performance, while Materials has fallen so hard that it unseated Telecom as the worst performing sector.
The S&P 500 set a new all-time closing high of 1570 on Tuesday but failed to break the all-time intraday high of 1576. Looking at the charts, the S&P500 SPDR Trust (SPY) closed Wednesday at 155.23 and remains within a sideways channel between about 153 and 157. After falling out of its earlier bullish rising channel, it has been unable to break back in. Oscillators RSI, MACD, and Slow Stochastic are all pointing down and touching the neutral line. Bollinger Bands are pinching together about as tight as they ever get during this ongoing technical consolidation beneath the all-time high.
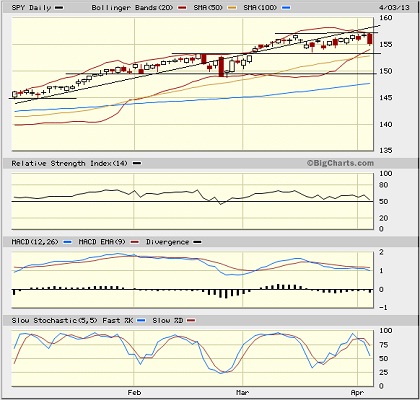
The CBOE Market Volatility Index (VIX), a.k.a. “fear gauge,” has risen to close Wednesday at 14.21, but it is still quite low on a historical basis. We’ll see if 15 remains strong resistance, which would bode well for equities.
As long as the central banks, led by the Federal Reserve, keep the liquidity spigots open as they intend to do, equities remain the primary beneficiary, particularly given the lack of appealing alternatives. We might get a long-anticipated pullback that truly tests bullish conviction, but I would expect it to be followed by a strong resumption of the uptrend. Next week kicks off another corporate earnings season, so all eyes will be watching.
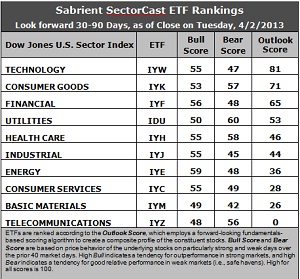
Latest rankings: The table ranks each of the ten U.S. industrial sector iShares ETFs by Sabrient’s proprietary Outlook Score, which employs a forward-looking, fundamentals-based, quantitative algorithm to create a bottom-up composite profile of the constituent stocks within the ETF. The multi-factor model considers forward valuation, historical earnings trends, earnings growth prospects, the dynamics of Wall Street analysts’ consensus estimates, accounting practices and earnings quality, and various return ratios. In addition, the table also shows Sabrient’s proprietary Bull Score and Bear Score for each ETF.
High Bull score indicates that stocks within the ETF have tended recently toward relative outperformance during particularly strong market periods, while a high Bear score indicates that stocks within the ETF have tended to hold up relatively well during particularly weak market periods. Bull and Bear are backward-looking indicators of recent sentiment trend.
As a group, these three scores can be quite helpful for positioning a portfolio for a given set of anticipated market conditions.
Observations:
1. Technology (IYW) continues to hold the top spot, with an Outlook score of 81, which is down noticeably from past few weeks above 90. IYW continues to display a low forward P/E, strong projected long-term growth, and the best return ratios, but Wall Street support has diminished somewhat. Defensive sector Consumer Goods (IYK) stays in second place with a 71. Financial (IYF) holds third with a 65 and has apparently stabilized at this level.
2. Telecom (IYZ) stays in the cellar with a rock-bottom Outlook score of 0. It is the worst or nearly worst in every metric in the model, including poor support (negative earnings revisions) among Wall Street analysts, the worst return ratios, the highest (worst) forward P/E, a low projected long-term growth rate, and poor insider sentiment. It is joined in the bottom two this week by Basic Materials (IYM) with a score of 26, as it continues to swap positions with Consumer Services (IYC). IYM has endured the most net earnings downgrades.
3. Overall, this week’s rankings maintain a neutral tone, and might even be leaning slightly defensive. Defensive sectors IYK, IYH, and IDU rank in the top five, while economically-sensitive sectors IYJ, IYE, IYM, and IYC are all in the bottom half and scoring well below 50. Only four score above 50, and the wide top-bottom spread has narrowed a bit to 81 points.
4. Looking at the Bull scores, Energy (IYE) remains the leader on particularly strong market days, scoring 59. Telecom (IYZ) is the laggard on strong market days, scoring 48. The top-bottom spread is a relatively narrow 11 points, which continues to indicate relatively high correlation on strongly bullish days.
5. Looking at the Bear scores, Utilities (IDU) is serving as the favorite “safe haven” on weak market days, scoring 60, but Healthcare (IYH) took a big 6-point jump to 58 this week as it held up well during the recent market weakness. Basic Materials (IYM) is the worst during extreme market weakness as reflected in its low Bear score of 42. The top-bottom spread is 18 points, which indicates lower correlations when the market is particularly weak — i.e., it pays to be in the right sectors when the market is weak.
6. Overall, Technology (IYW) shows the best all-weather combination of Outlook/Bull/Bear scores. Adding up the three scores gives a total of 183. Telecom (IYZ) is by far the worst at 104. Looking at just the Bull/Bear combination, Healthcare (IYH) has jumped to the top with an impressive total score of 113, followed by Utilities (IDU) and Consumer Goods (IYK) at 110. Materials (IYM) displays by far the lowest score at 91. This indicates that Healthcare stocks have performed the best in extreme market conditions (whether bullish or bearish) while Materials stocks are avoided altogether.
These Outlook scores represent the view that Technology and Consumer Goods sectors may be relatively undervalued, while Telecom and Basic Materials sectors may be relatively overvalued based on our 1-3 month forward look.
Top-ranked stocks within Technology and Consumer Goods include F5 Networks (FFIV), SolarWinds (SWI), NVR Inc. (NVR), and Polaris Industries (PII).
By the way, Sabrient’s “Baker’s Dozen” top 13 stocks for 2013 is still up a robust 8.7% through Wednesday since inception on January 11, despite taking hits this week in top performers from transportation and energy like Air Lease (AL), Alaska Air Group (ALK), and Marathon Petroleum (MPC). Over the same timeframe, the S&P 500 is up 5.5%. Note that Sabrient will soon introduce a fresh list of 20 “Earnings Busters” for Q2.
Disclosure: Author has no positions in stocks or ETFs mentioned.
About SectorCast: Rankings are based on Sabrient’s SectorCast model, which builds a composite profile of each equity ETF based on bottom-up aggregate scoring of the constituent stocks. The Outlook Score employs a fundamentals-based multi-factor approach considering forward valuation, earnings growth prospects, Wall Street analysts’ consensus revisions, accounting practices, and various return ratios. It has tested to be highly predictive for identifying the best (most undervalued) and worst (most overvalued) sectors, with a 1-3 month forward look.
Bull Score and Bear Score are based on the price behavior of the underlying stocks on particularly strong and weak days during the prior 40 market days. They reflect investor sentiment toward the stocks (on a relative basis) as either aggressive plays or safe havens. So, a high Bull score indicates that stocks within the ETF have tended recently toward relative outperformance during particularly strong market periods, while a high Bear score indicates that stocks within the ETF have tended to hold up relatively well during particularly weak market periods.
Thus, ETFs with high Bull scores generally perform better when the market is hot, ETFs with high Bear scores generally perform better when the market is weak, and ETFs with high Outlook scores generally perform well over time in various market conditions.
Of course, each ETF has a unique set of constituent stocks, so the sectors represented will score differently depending upon which set of ETFs is used. For Sector Detector, I use ten iShares ETFs representing the major U.S. business sectors.
About Trading Strategies: There are various ways to trade these rankings. First, you might run a sector rotation strategy in which you buy long the top 2-4 ETFs from SectorCast-ETF, rebalancing either on a fixed schedule (e.g., monthly or quarterly) or when the rankings change significantly. Another alternative is to enhance a position in the SPDR Trust exchange-traded fund (SPY) depending upon your market bias. If you are bullish on the broad market, you can go long the SPY and enhance it with additional long positions in the top-ranked sector ETFs. Conversely, if you are bearish and short (or buy puts on) the SPY, you could also consider shorting the two lowest-ranked sector ETFs to enhance your short bias.
However, if you prefer not to bet on market direction, you could try a market-neutral, long/short trade—that is, go long (or buy call options on) the top-ranked ETFs and short (or buy put options on) the lowest-ranked ETFs. And here’s a more aggressive strategy to consider: You might trade some of the highest and lowest ranked stocks from within those top and bottom-ranked ETFs.