

 What a great rally it's been.
Thank you all for playing – have a nice Summer, be sure to come back for our Santa Claus Classic run in November. As you can see from the chart on the right, even CNBC is noticing the disconnect between actual earnings and the performance of the market. Earnings are the same as they were in early 2012 but the Dow is up 20% since then (from 13,000ish). So, do we think earnings will pop 20% or the Dow will drop 20%?
These things used to matter. As you can see, there's usually a pretty good correlation between earnings and the price of stocks. I know, what a quaint, old-fashioned way of looking at things, right? Well, you know what they say about old dogs and new tricks so you'll have to humor me and my paranoia when the market gets this far ahead of what we used to call a rational valuation.
Of course, this time IS different as we have a runaway Central Bank that's throwing $85,000,000,000 into the economy every 30 days in the hopes of it stimulating the economy. As I often say to members, when you have a patient lying in a hospital that needs $85Bn a month to survive – don't be fooled into thinking they're fine just because they're not getting worse! Europe is getting worse as they're not getting $85Bn a month from their Central Bank and EuroZone unemployment hit 12.2% in April with 26.8% of the people in Spain out of work. That's SPAIN, the 13th largest economy in the World!

Money printing is forcing us to ignore the MASSIVE underlying problems that are still plaguing the Global Economy because we simply don't have room under our mattresses for $85Bn a month (and another $75Bn from Japan) so the money is forced into riskier and riskier assets and creating bigger and bigger bubbles as it moves up the chain. 13,000 + 20% is 15,600 and that's where we are now and 20% is right around where these bubbles tend to pop – or at least let some air out.
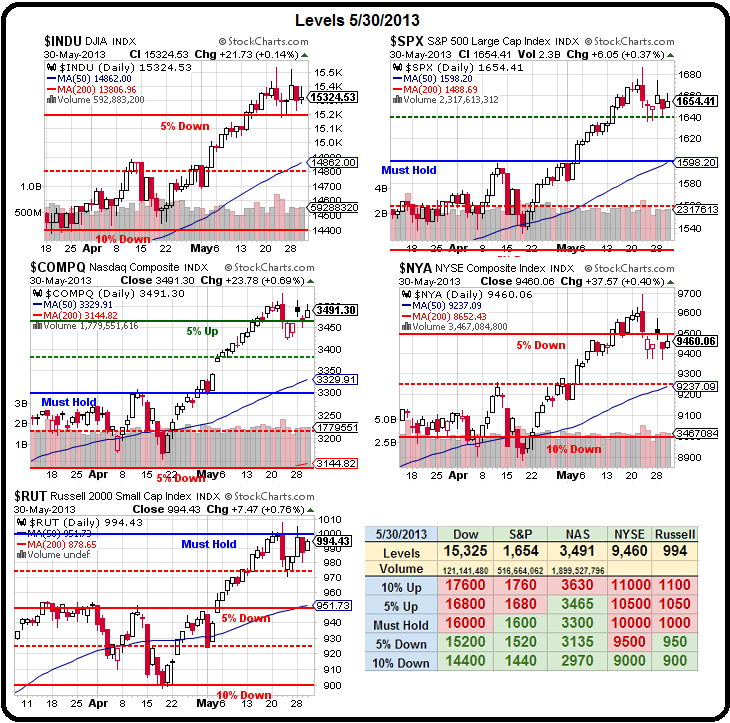 That's why we raised our Must Hold levels on the Big Chart as we are not bullish until 3 of our 5 Must Hold lines are held and I've been focusing on Russell 1,000 for the past two weeks and it's been failing to hold it for the last two weeks – there's nothing bullish about this action folks. As I said to our Members this morning:
Big Chart – I don't like that pattern one bit. That's a spitting cobra pattern and usually they strike to the downside (and, before you ask, yes – I made that up). Still, very logical for the M to form down to the 50 dmas – especially as those 50s are right on major lines for the S&P, NYSE and the RUT and we know the Dow is too silly to worry about and the Nas is ruled by 10 stocks and 5 of them are AAPL so they also give funny readings but the 3 that are broad and hard to control are all lining up perfectly for a 2.5% drop.
 Fortunately, we didn't wait for this morning's Futures sell-off to hedge our positions for a drop. In yesterday's morning post, I outlined our plan to protect the Income Portfolio using TZA October $30/37 bull call spreads at $1.90 along with DIA August $147 puts, which opened yesterday at $1.72 ($2.25 was our pre-market price) and the TZA spread was right on target at $1.85. If you missed yesterday's play, I doubt DIA will stay that cheap but the spread may still be close as it's self-hedged.
We also have TZA July $34 calls (now $1.55) in our Short-Term Portfolio as a straight-up bet that the market drops next week. In our STP we also shorted the Financials in a FAS Money trade and took an aggressive short on oil at $93.68 with 10 USO $35.50 puts that expire today at .32 so $320 at risk (we had a stop at $150 to risk a $170 max) and they finished the day at .33 but this morning we have a lovely dip in oil back to $92.50 so those should do nicely this morning if it doesn't reverse on us.
I won't say "I told you so" on oil because, if you read us regularly and don't know that we told you so – there's no hope you'll figure it out now… We had a FUNDAMENTAL premise that the Holiday Weekend driving numbers would not support $96 oil and they didn't. Our downside goal was $92.50 and we beat that yesterday at $91.65 but then the NYMEX pump crew took over and jacked it back up to $94 so of course we short them again. This stuff really isn't that hard to follow!
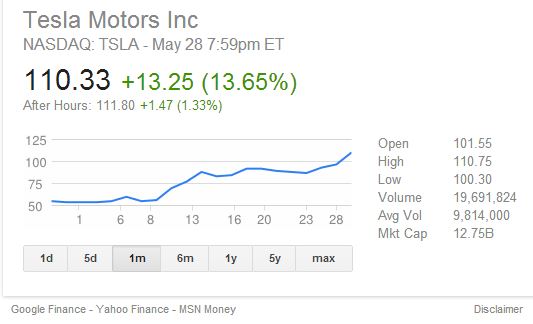 We're not religiously short on oil – if the Fundamentals change we will be happy to change our minds. We are, however, religiously short on TSLA at the moment and Jim Cramer disagrees, specifically saying my simple method of dividing the value of the company by the number of cars and coming up with a ridiculous $500,000 per car valuation is "not the way to look at it." Too bad Cramer doesn't have the balls to directly debate me but listen to his BS and then we can continue the discussion in chat. Cramer is on tour pumping TSLA and we welcome the bagholders he's sending in for the slaughter.
By the way, for those of you with a memory – yes, this is the same Jim Cramer that called for shorting TSLA at it's $20 IPO in 2010 – back when I was urging people to buy it! We waited until TSLA had options to hedge with on July 15th of 2010 to make our first play on TSLA, which was:
TSLA back to $20 and now they have options. Jan $17 puts can be sold for $3.10, which is net $13.90 for an entry and you can play the long upside with 2012 $17.50/25 bull call spread at $2.10 so owning TSLA at net $18 (the low) is your worst possible fate.
 TSLA came in at $30 in Jan 2012 and that spread returned $8.50 off a $1 cash credit in 18 months. We had similar success with this year's TSLA longs but we made the huge mistake of pressing our luck with short calls and those are the positions we are currently working our way out of. Like many shorts – TSLA has squeezed us and Cramer is doing the bidding of his hedge fund buddies to drive the price as high as possible so they can short the Hell out of it before it comes back to Earth.
Speaking of high flyers, NFLX is being added to the Nasdaq 100 next week and now we know why they popped 30% this month. A lot of index funds are forced to buy it here and that allows a lot of hedge funds who jacked it up to sell to retail bagholders who own those index funds and end up diverting a portion of their IRA money to a brand-new over-priced stock – and that's the beautiful system the Banksters have constructed to funnel money from the bottom 90% to the top 1% (with some of it trickling down to the next 9%, who are happy to facilitate the system in exchange for those scraps).
 Cramer does have one thing right, he's telling people to invest in companies that service the top 10% in what he calls the "Great Gatsby Index" of stocks like LULU, RL, WFM, JWN, PNRA, TOL, BC, KORS, SKS, COH, SBUX and TIF (gotta have diamonds!). This is a premise we've been following all year as the rich get richer and RICHER.
In fact, Global wealth grew faster in 2012 than in the previous two years, boosting the number of millionaires and improving the outlook of the wealthy. Private investable assets were up 7.8 percent last year, versus rises of 3.6 percent in 2011 and 7.3 percent in 2010, according to the Global Wealth 2013 report released Thursday by the Boston Consulting Group. The study calculated the global number of millionaires at 13.8 million, or 0.9 percent of households (based on investable assets, not including residence).
Among millionaire households as BCG defines them, the U.S. has the most—5.9 million. Japan is next on the list with 1.5 million, followed by China with 1.3 million; BCG predicts that they will switch places by 2017.
If you want to keep up with the Gatsby's in this FREE MONEY environment, you have to be buying those Bernanke Bubbles right alongside them but, as I noted yesterday, we can use options in an inflationary market to give us both great upside leverage and great protection but that only works IF YOU HAVE THE CASH TO DEPLOY.
So PLEASE take the time today to look over your portfolio and take some of those winners off the table. If this market is heading higher and you don't think your current position is good for more than a 20% gain this year – then it's not doing you any good to keep it. If the market is going down – you'll be thrilled you took your gains off the table as we will have a great time bottom fishing on the next dip.
Have a great weekend,
– Phil