

 Wheeeee, what a ride!
There's nothing better than a good sell-off (see Dave Fry's SPY charts) when you're ready for it. The stocks we want to buy get cheaper and we're able to raise money to buy them by cashing in our hedges and the VIX jumps back (18.59) to levels that make it fun to sell short puts again (our favorite way to initiate a long position).
Take LULU, for example, they BEAT by 6.7% and the stock fell from $82.50 to $64 (22%) and now we can sell 2015 $50 puts for $4.30 for a net $45.70 entry.
The margin on that sale is about $4.50 to make $4.30 (95%) in 18 months if LULU simply doesn't drop another 22% and our break-even is another 10% below that! That's what we call a "set and forget" trade and we'll add 5 of those to our Income Portfolio and collect $2,150 now in exchange for our promise to buy 500 shares of LULU at $50 ($25,000) in Jan 2015 – if they are trading below that line.
 Following through that trade – should LULU be put to us at, say $40 (50% off the highs), then we could sell the 2017 $40 puts and calls for at least $10 (the 2015 $65 puts and calls are $26) and that would drop our net basis to $30 with a commitment to own 1,000 shares of LULU at an average of $35 if they are below $40 in 2017. That's what we're committing to by taking a position in LULU at $64, buying 1,000 shares for $35. As long as we REALLY want to own 1,000 shares of LULU at net $35 in 2017 ($17,500 of ordinary margin), then there couldn't be an easier way to collect $2,150 today.
As I always tell people at our conferences, a good put sale is one in which you are UNHAPPY not to get the stock assigned to you at the net price. We're being paid $2,150 by the put buyer NOT to take their stock from them. They buy those puts because they FEAR it will go lower and they want someone to promise to buy the stock at a certain price, worst case. Once that worst-case scenario washes out – those short buyers are very regretful of their panicked decisions.
That's our job – to take advantage of that panic by making rational assessments of the true value of a stock. It's what Warren Buffett calls "being greedy when others are fearful."
We were "fearful" this past month as the market topped out and we sold calls to the greedy and now, as the market begins to fall, we sell puts to the fearful – and that's how we collect a nice premium on both ends and make a fortune if things end up in the middle – as they often do – eventually.
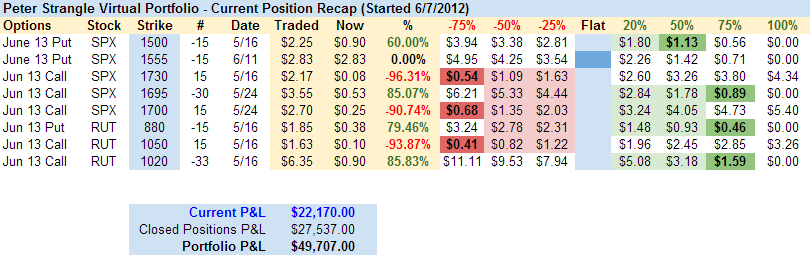
One of the virtual portfolios we follow at Philstockworld is Peter D's Short Strangle Portfolio, which sells fear premium on both sides of the indexes. Less than 30 days ago, on 5/15, the market was topping and the open positions were down $40,556 and the portfolio was taking a $10,317 hit as the market hit what we thought was the top of the range. By sticking with the positions (making rolling adjustments) instead of panicking, as of yesterday the June rolls are now UP $22,170 and the overall portfolio is up just under $50,000 ($49,707), returning about 25% on margin for the year.
These are not, of course, risk-free investments. Risk-free investments pay 3-5% these days (although I question the use of "risk-free" when applied to low-yield bonds in a rising rate environment). Our Short-Term Portfolio can move up and down a few thousand Dollars a day in P&L but, so far, we've closed $10,652 in profits since we started it on 5/17. Now all we have to do is adjust the remaining positions until we can get out even and that $10,652 becomes a realized gain. It's what to do between here and there that we try to teach people!
 At the moment, we're more worried about the broad-market picture as the S&P tests the 1,600 mark for the first time since gapping over it in early May. That was the silliness we were determined to ride out and now we're going to be looking for the bottom of the channel but we crossed below ALL of our predicted weak bounce levels yesterday and thank goodness our 5% Rule helped us to ignore the BS "rally" of last week and stick with our shorts.
My main job is teaching people to trade stocks and options, my side job is being a Fundamental Analyst and my hobby is making fun of TA people so, be very clear, that when we talk about charts and stuff, they are really only being used to illustrate our 5% Rule™, which is all about MATH – we could care less about the squiggly lines on the charts.
The S&P ran up from 800 (we ignore silly panic spikes) in 2008 to 1,600 in 2013. Along the way, it hit 1,200 (up 50%) in April of 2010 and pulled back to 1,000 – giving up 40% of it's gains (strong retrace).
Then it got back to 1,200 in Nov of 2010, consolidated between 1,320 (10% up) and 1,150 (5% down) until May of last year, when it finally used 1,320 for a floor and then continued on to 1,600 last month, where it's now testing that as a floor. That's it – very simple – very straightforward. If you need to see it, here it is:
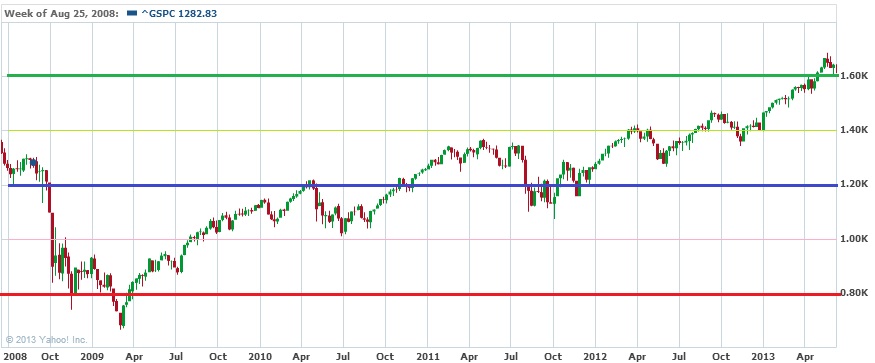
Keep in mind that this is our 3rd attempt at 1,600 since 1999, both initial attempts knocked us back to 800 but 800 was actually pretty good since we had gotten there from 400 in 1992. So 100% move up, 50% retrace is pretty "normal" for market growth (see "Fibonacci Rules"). Fibonacci teaches us that there are retraces within retraces as any complex system grows so a drop by the S&P to 1,400 from here (12.5%) would be nice and healthy as we look to finally make a proper move over 1,600 down the road.
 This is our first actual test of 1,600 from above – the chances of not failing it are both slim and none but hope springs eternal among the bulls and pundits, who seem to believe that what goes up, must go up some more – regardless of the underlying fundamentals. That's where my second job always gets in the way – I believe in Stock Market Physics, one of the first things I ever taught Members at PSW.
Thanks to the addition of "fuel" from the Fed and the BOJ, we have had enough thrust to get back over the 1,600 line. Our formula for adding global stimulus to our market goals is $1Tn per S&P point per month and our goal was 1,450 for the end of last year and now we have $75Bn a month from the BOJ and $85Bn a month from the Fed should be good for 160 points over our Fundamental view of the underlying stocks and – Hey, what do you know? 1,610!
So we're right where we should be coming into earnings and our Fundamental valuation of equities hasn't changed, so the primary variable is how much monetary fluff the Central Banksters are willing to inject in order to make the charts look pretty.
We're very happy to get more bullish if the Fed or the ECB want to give us MORE FREE MONEY or even if we are upside surprised by Corporate Earnings or other economic indicators but, as I noted yesterday, those "other economic indicators" kind of suck. That means we'll maintain a cautious stance coming into July earnings season and we'll pay close attention to next week's Fed Statement, which can make or break the Summer for the markets.
Meanwhile, there's plenty of LULU's out there and we have plenty of cash on the sidelines we've been waiting to deploy!